


 Extract (6-MSITC) in Healthy Older Adults")
: An In-Depth Exploration into its Thermogenic Role and Social Significance")


How do human beings perceive their environment and take their decisions?
To successfully interact with the immediate environment, for human beings it is not enough to have basic evidence of the world around them.
This information by itself is insufficient because it is inherently ambiguous and requires integrating into a particular context to minimize the uncertainty of sensory perception.
But, at the same time, the context is ambiguous. For example, am I in a safe or a dangerous place?
A study published on 28 November in Nature Communications by Philipp Schustek, Alexandre Hyafil and Rubén Moreno-Bote, researchers at the Center for Brain and Cognition (CBC) of the Department of Information and Communication Technologies (DTIC) at UPF, suggests that the brain has a refined form of representation of uncertainty at several hierarchical levels, including context.
Hence, the brain has a very detailed, almost mathematical probabilistic representation of all that surrounds us we consider important.
“The notions of probability, though intuitive, are very difficult to quantify and use rigorously. For example, my statistics students often fail to solve some of the problems I pose in class.
In our study, we find that a complicated mathematical problem involving the use of the most sophisticated rules of probability can be solved intuitively if it is presented simply and in a natural context”, asserts Rubén Moreno-Bote, coordinator of the Research Group on Theoretical and Cognitive Neuroscience at the CBC.
Cognitive tasks of hierarchical integration
Let us suppose that a city airport is hosting a football final and we look at a few passengers who are leaving a plane.
If we note that four of them are fans of the red team and two of the blue team, we could conclude that more fans of the red team are attending the final than of the blue team.
This inference, based on incomplete sensory evidence, could be improved with contextual information.
For example, if worldwide there are more fans of the blue team than of the red team, despite our initial observation, we would review our inference counting how many supporters of each group are travelling on the plane to more accurately confirm whether more fans of the red team have really come to the city than of the blue team.
Or, we could also do the opposite, basing ourselves on the context inferring whether the sample observed follows the more general context or not.
The researchers designed their experiments presenting hierarchical integration tasks using the plane task.
“For the study, we told our participants that they are at an airport where planes can arrive carrying more of one type of person than of another, for example, more supporters of Barça than of Madrid.
On seeing a handful of passengers leaving several aircraft, the participants can predict with mathematical precision the likelihood that the next plane will be carrying more passengers of a certain type”, Moreno-Bote explains.
The researchers designed their experiments presenting hierarchical integration tasks using the plane task.
“In general, this structure of tasks creates hierarchical dependencies among the hidden variables to be solved bottom up (deducing the context of previous observations) and then passing the message top down (deducing the current status combining current observations with the inferred context)”, the authors explain.
The results showed that the participants, based on their preliminary observations, built a probabilistic representation of the context.
These results help to understand how people form mental representations of what surrounds us and how we assign and perceive the uncertainty of this context.
Over the past few decades, research of the brain’s spatial system advanced tremendously, providing insights into how the brain represents complex information and how these processes are impaired in disease states (e.g. Banino et al., 2018; Kunz et al., 2015; for reviews see Buzsáki and Moser, 2013; Epstein et al., 2017; Moser et al., 2008).
However, scientific investigations of spatial cognition in humans and animals are often limited to small scale environments such as single rooms or short walkable pathways. It is therefore unclear whether representation and processing of large-scale environments rely on the same neurocognitive systems (Wolbers and Wiener, 2014).
This question is of importance for several reasons. First, the lack of knowledge on how the brain’s spatial system treats different spatial scales affects interpretation of past investigations that used different types of experimental environments.
Second, disorientation is a prevalent symptom across neurological and psychiatric disorders, but remains poorly understood and diagnosed, in part because it may have different subtypes that manifest at different spatial scales (Peer et al., 2014). Finally, recent findings suggest that the brain’s spatial system is also used to represent conceptual knowledge (Behrens et al., 2018; Bellmund et al., 2018; Constantinescu et al., 2016; Gärdenfors, 2000). Since large-scale environments are often remembered in a schematic manner not consistent with Euclidean geometry (McNamara, 1986; Moar and Bower, 1983; Tversky, 1981), understanding their representation may provide clues to representation of abstract domains.
Previous neuroscientific evidence supports the idea that the brain’s spatial representations are not unified but separated into multiple scales.
Functional MRI studies in humans demonstrated that locations within rooms and their surrounding buildings are coded in different cortical regions (Kim and Maguire, 2018), and that directions are represented in the retrosplenial complex with respect to the local axis of a room irrespective of its large-scale context (Marchette et al., 2014).
Electrophysiological evidence in animals also points to separate representation of small scale regions and their large-scale context, as grid- and place-cells within the medial temporal lobe undergo remapping when crossing borders between rooms (Fyhn et al., 2007; Skaggs and McNaughton, 1998; Tanila, 1999), and form independent representations of different segments of the environment (Derdikman et al., 2009; Derdikman and Moser, 2010; Paz-Villagrán et al., 2004; Spiers et al., 2015). Recordings from the rat retrosplenial cortex also demonstrate coding of location both in the immediate small-scale region and in the large-scale surrounding environment (Alexander and Nitz, 2017; Alexander and Nitz, 2015).
Finally, evidence from patients with disorientation disorders shows that disorientation can be limited to a specific spatial scale according to the underlying lesion (Peer et al., 2014). Patients with lateral parietal cortex lesions are impaired in navigating their immediate, small-scale environment (‘egocentric disorientation’; Aguirre and D’Esposito, 1999; Stark, 1996; Wilson et al., 2005).
In contrast, patients with retrosplenial lesions (Aguirre and D’Esposito, 1999; Takahashi et al., 1997) and Alzheimer’s disease (Monacelli et al., 2003; Peters-Founshtein et al., 2018) show the opposite pattern – correct localization in the immediately visible environment but inability to navigate in the larger unseen environment. Despite this evidence, few neuroscientific studies directly contrasted between representation of different scales of space.
Several studies indicated a posterior-to-anterior progression from small to large scales along the hippocampal axis, manifested as larger spatial receptive fields, in both humans and animals (Brunec et al., 2018; Kjelstrup et al., 2008; Poppenk et al., 2013). However, these investigations only used routes ranging up to several meters, and focused only on the hippocampus and not on the rest of the brain’s spatial system.
Another fMRI study contrasted coarse- and fine-grained spatial judgments in one scale (city), finding increased hippocampal activity for fine-grained distinctions (Hirshhorn et al., 2012a).
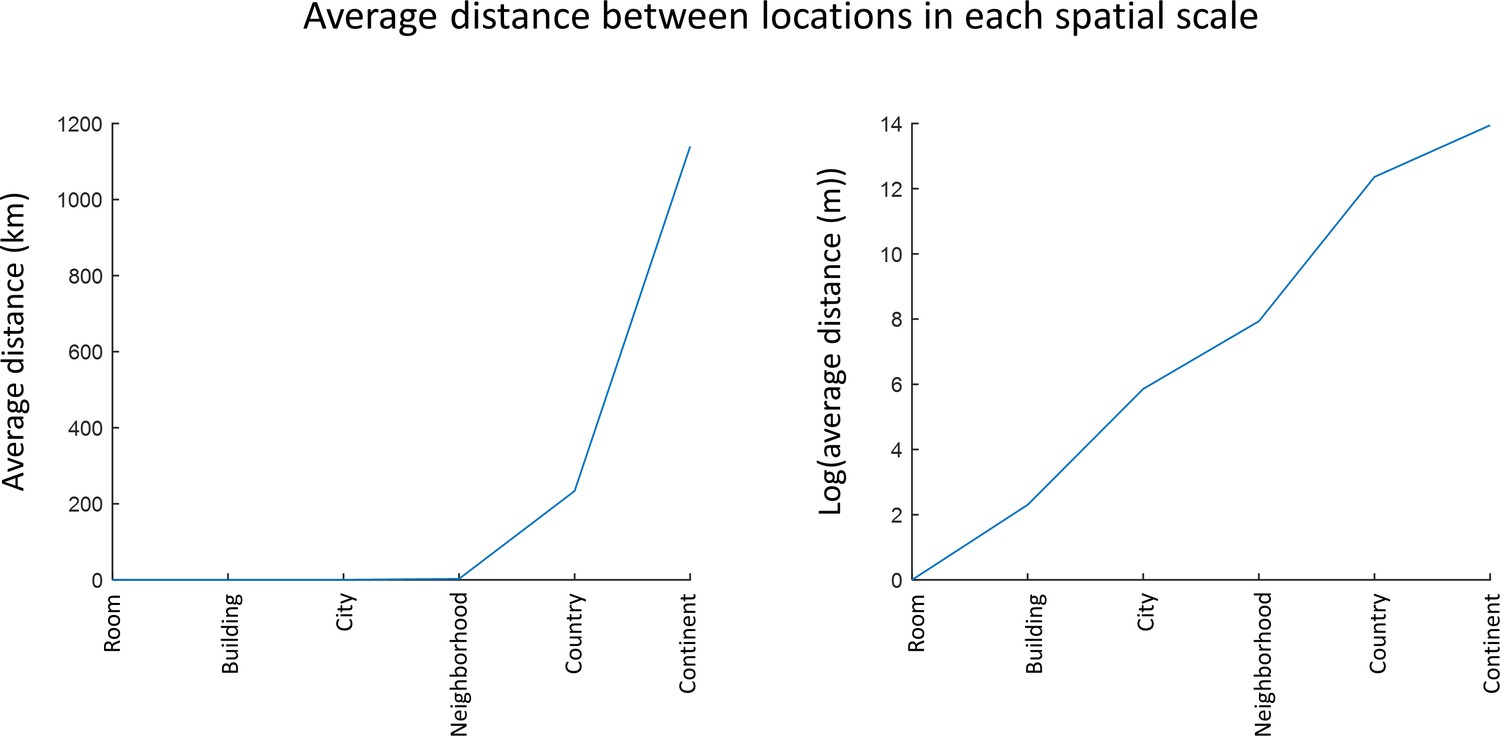
In the current work, we sought to characterize human brain activity under ecological experimental settings, across a large range of spatial scales, when directly manipulating only the parameter of spatial scale. To this aim, we asked subjects to compare distances between real-world, personally familiar locations across six spatial scales (rooms, buildings, neighborhoods, cities, countries and continents; Figure 1), under functional MRI, and looked for differences in brain response for the different scales.Figure 1 with 2 supplements

Figure 1—figure supplement 2
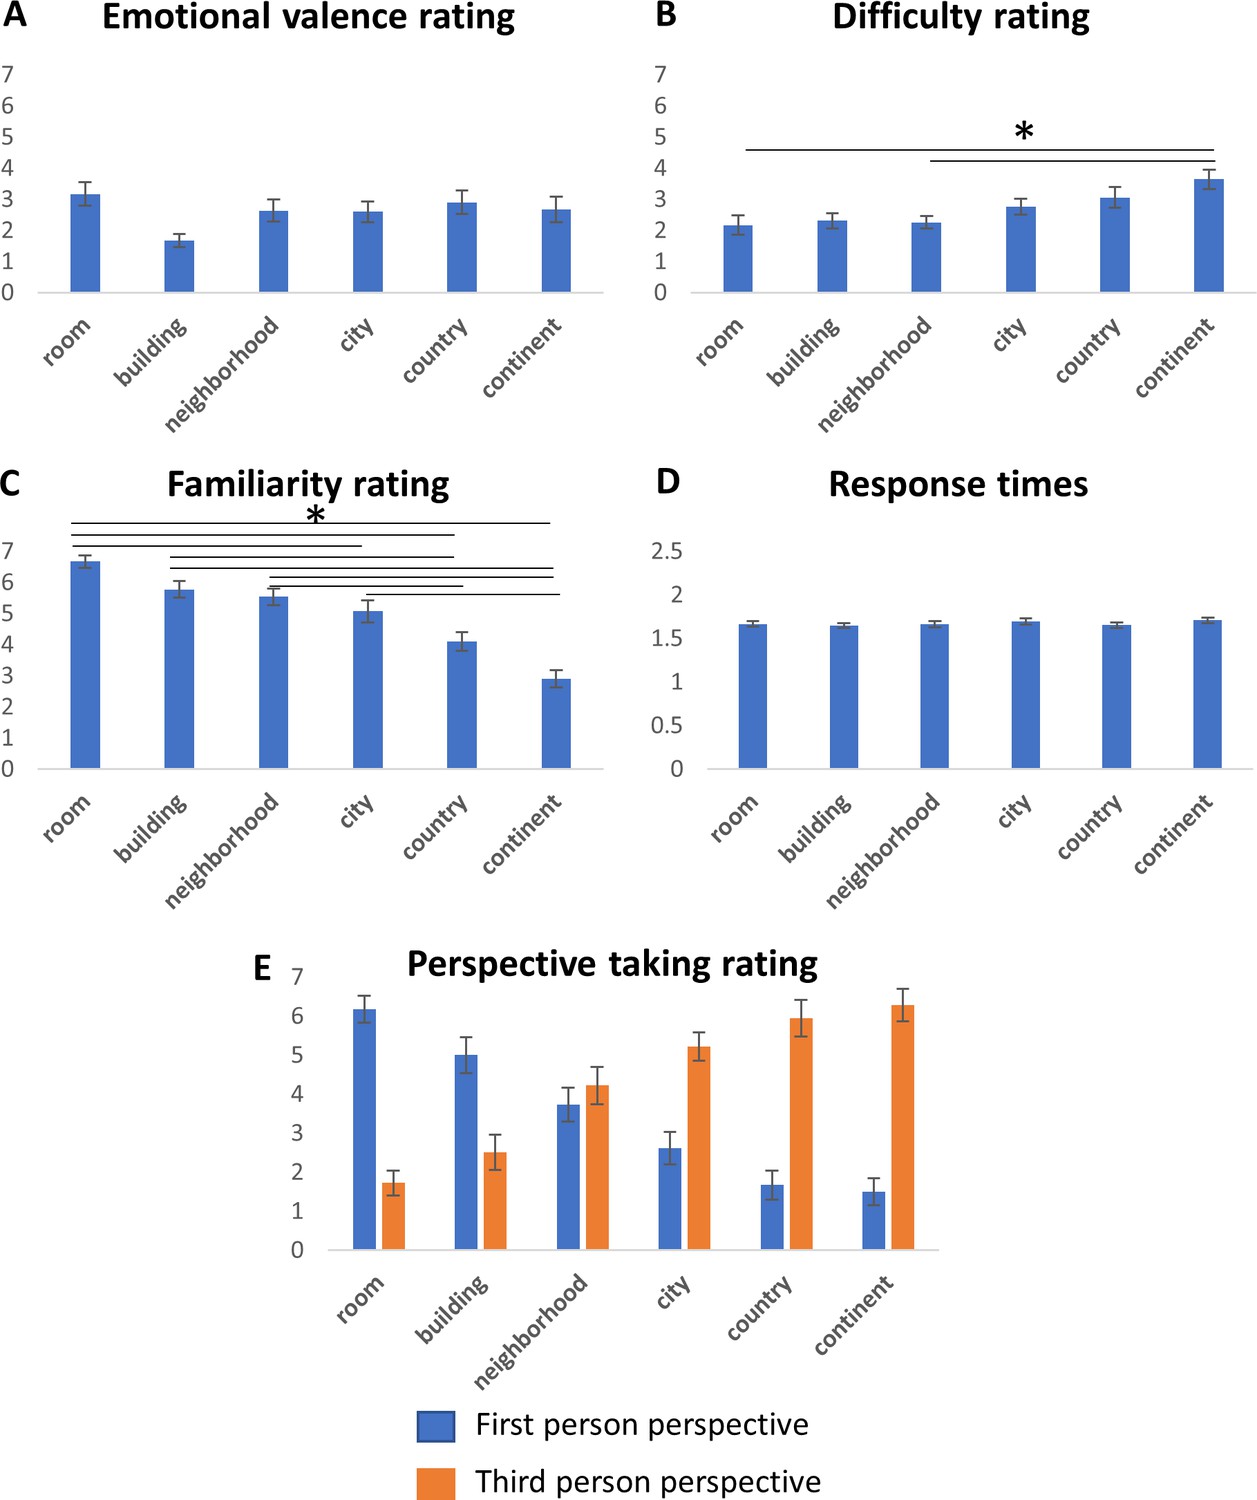
Figure 1—figure supplement 1
Results
Posterior-anterior gradients of spatial scale selectivity
To investigate spatial scale-selective activity, we looked for voxels showing difference in response to task performance at the different scales, and characterized their gradual response profiles by fitting a Gaussian function to the beta value graphs at each voxel (Figure 2—figure supplement 1). This analysis identified three cortical regions that displayed a continuous gradual shift in spatial scale selectivity: the medial temporal cortex, medial parietal cortex and lateral parieto-occipital cortex (Figure 2A–D, Figure 2—figure supplement 2).
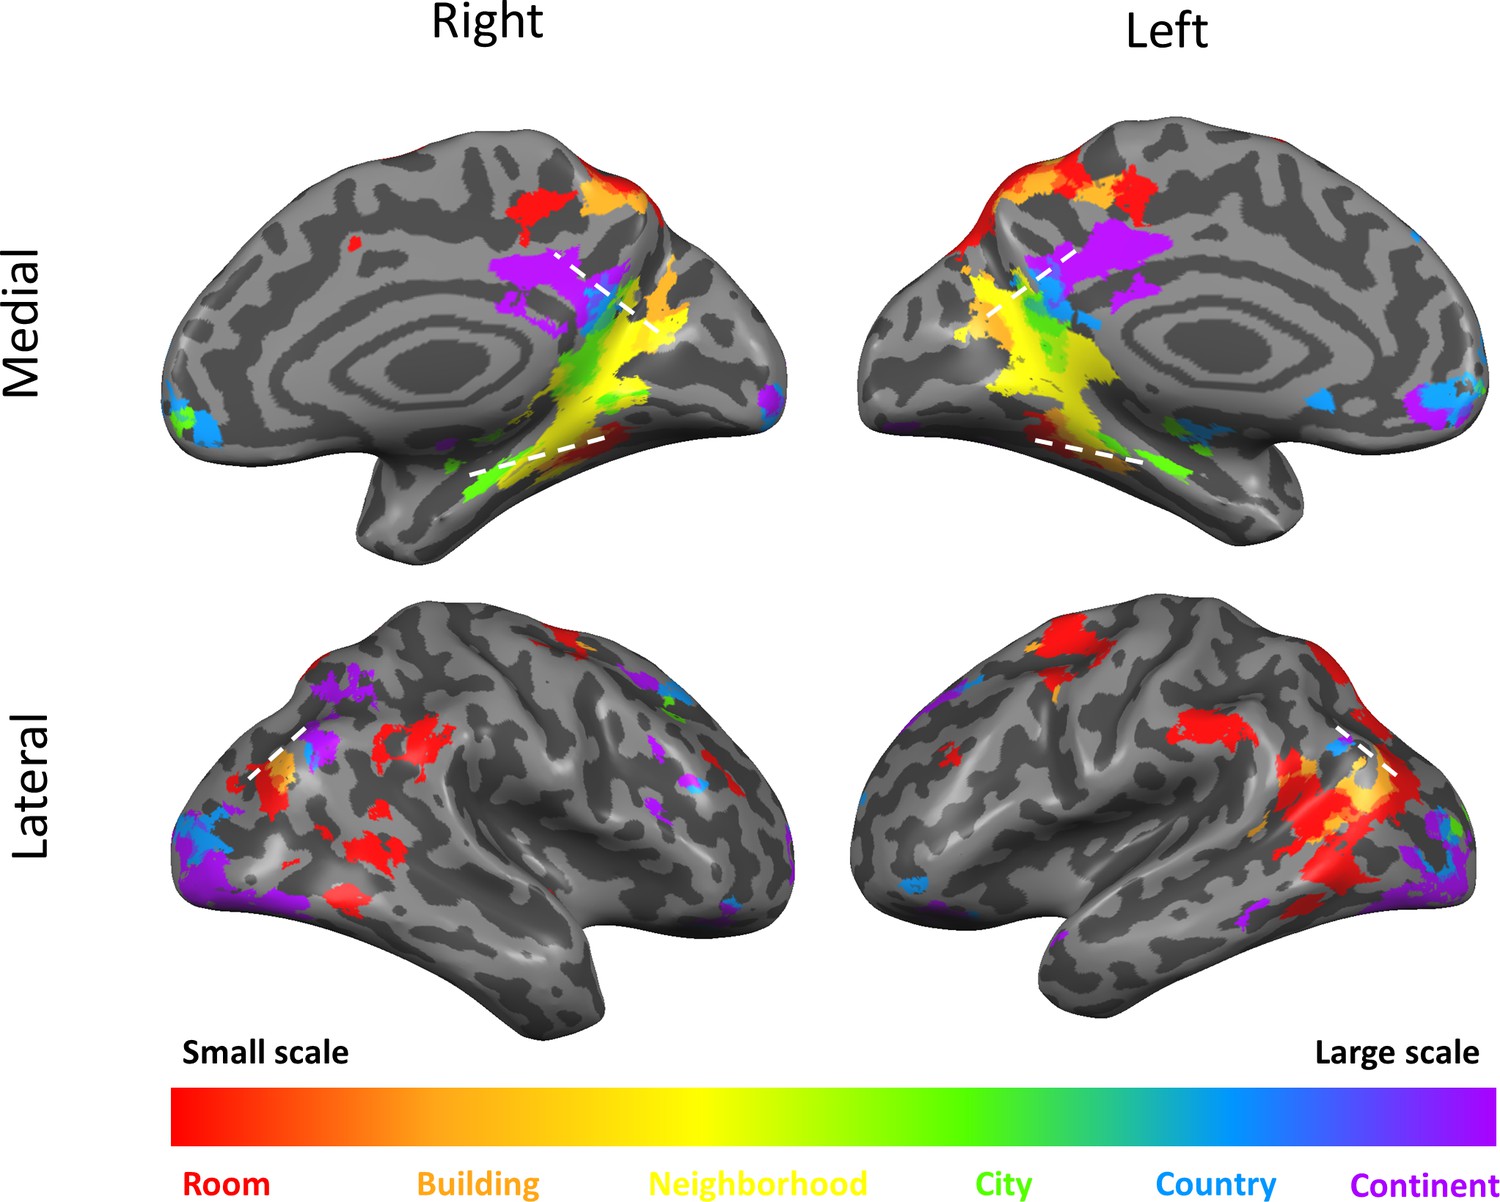
Activity in these regions displayed a gradual shift from selectivity for the smallest spatial scales (room, building) in their posterior parts, followed by selectivity for medium scales (neighborhood, city) more anteriorly, and for the largest scales (country, continent) in the most anterior part of each gradient (Figure 2E; p<0.001 for all gradients, permutation test on linear fit slope, FDR-corrected).
The three scale-selective gradients were symmetric across the two hemispheres. Extraction of the scale with maximal response from each voxel (while disregarding the pattern of activity at other scales) also demonstrated posterior-to-anterior progression along the three abovementioned gradients (Figure 2E, Figure 2—figure supplement 3; p<0.001 for all gradients, permutation test on linear fit slope, FDR-corrected). To further characterize the scale selectivity of each region, we plotted the event-related activity and beta values for each spatial scale at each part of the three gradients.
Results showed the same gradual posterior-anterior shift from small to large spatial scales, with each part of the gradient having a preferred scale and gradually diminishing activity to other scales around it (Figure 2—figure supplement 4A–C). Finally, in light of previous findings of spatial scale selectivity changes along the hippocampal long axis (Brunec et al., 2018; Poppenk et al., 2013), we measured average spatial scale selectivity along the hippocampus. Activity shifted from small to large scales along the posterior-anterior axis of the hippocampus (Figure 2E; p<0.001 for average position of Gaussian fit peak, permutation test on linear fit slope, FDR-corrected).
Using the same analysis at the individual subject level, 16 of 19 subjects showed significant increase in preferred scale along the lateral parietal gradient, 17 of 19 along the medial temporal gradient, 17 of 19 along the medial parietal gradient, and 6 of 19 along the hippocampus (all p<0.05, permutation test on linear fit slope, FDR-corrected).Figure 2 with 5 supplements
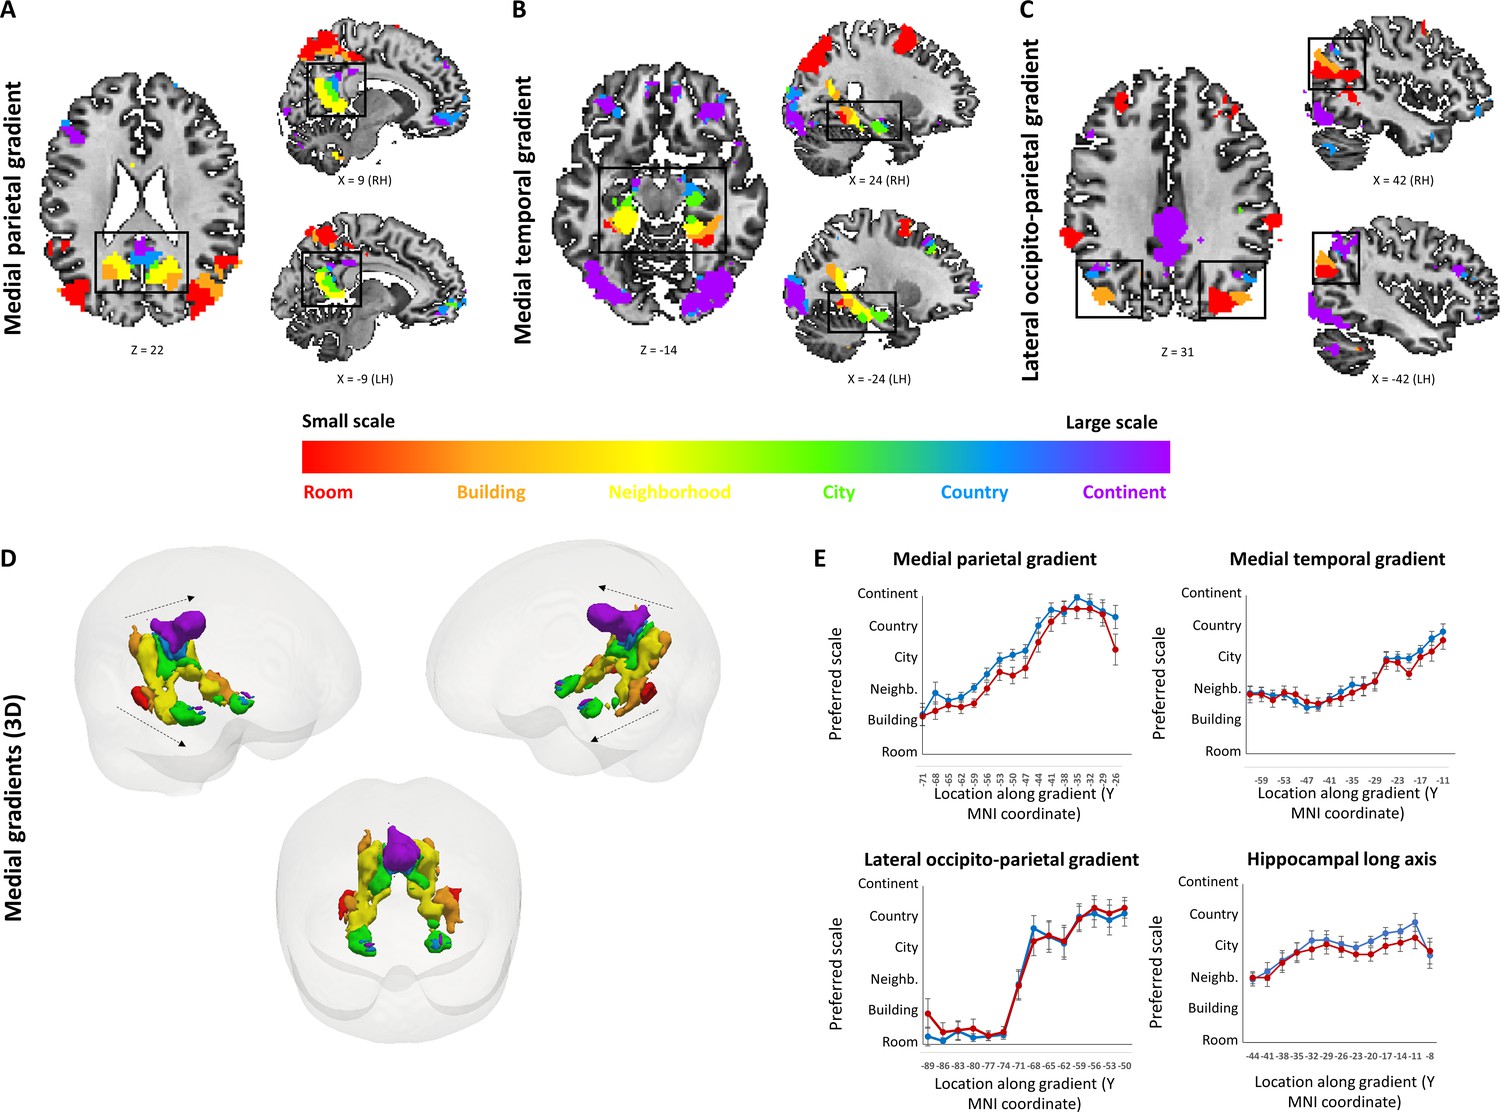
Figure 2—figure supplement

Figure 2—figure supplement 4
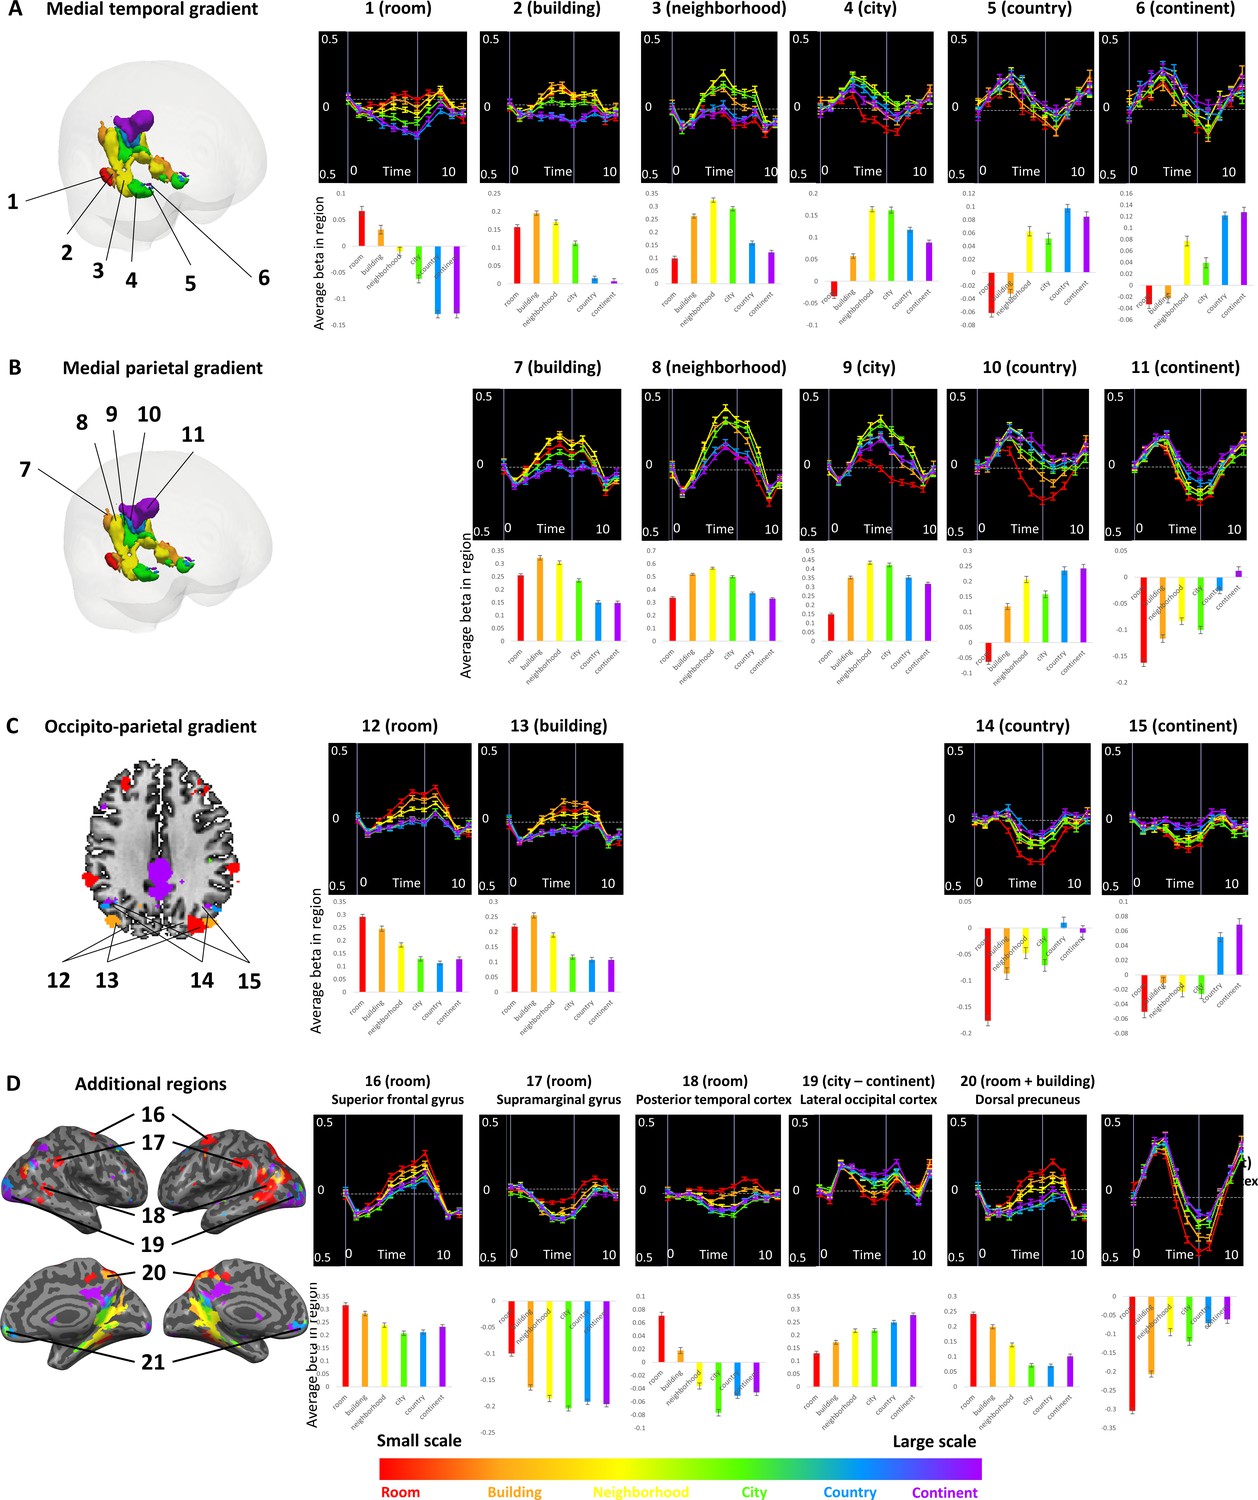
Figure 2—figure supplement 3
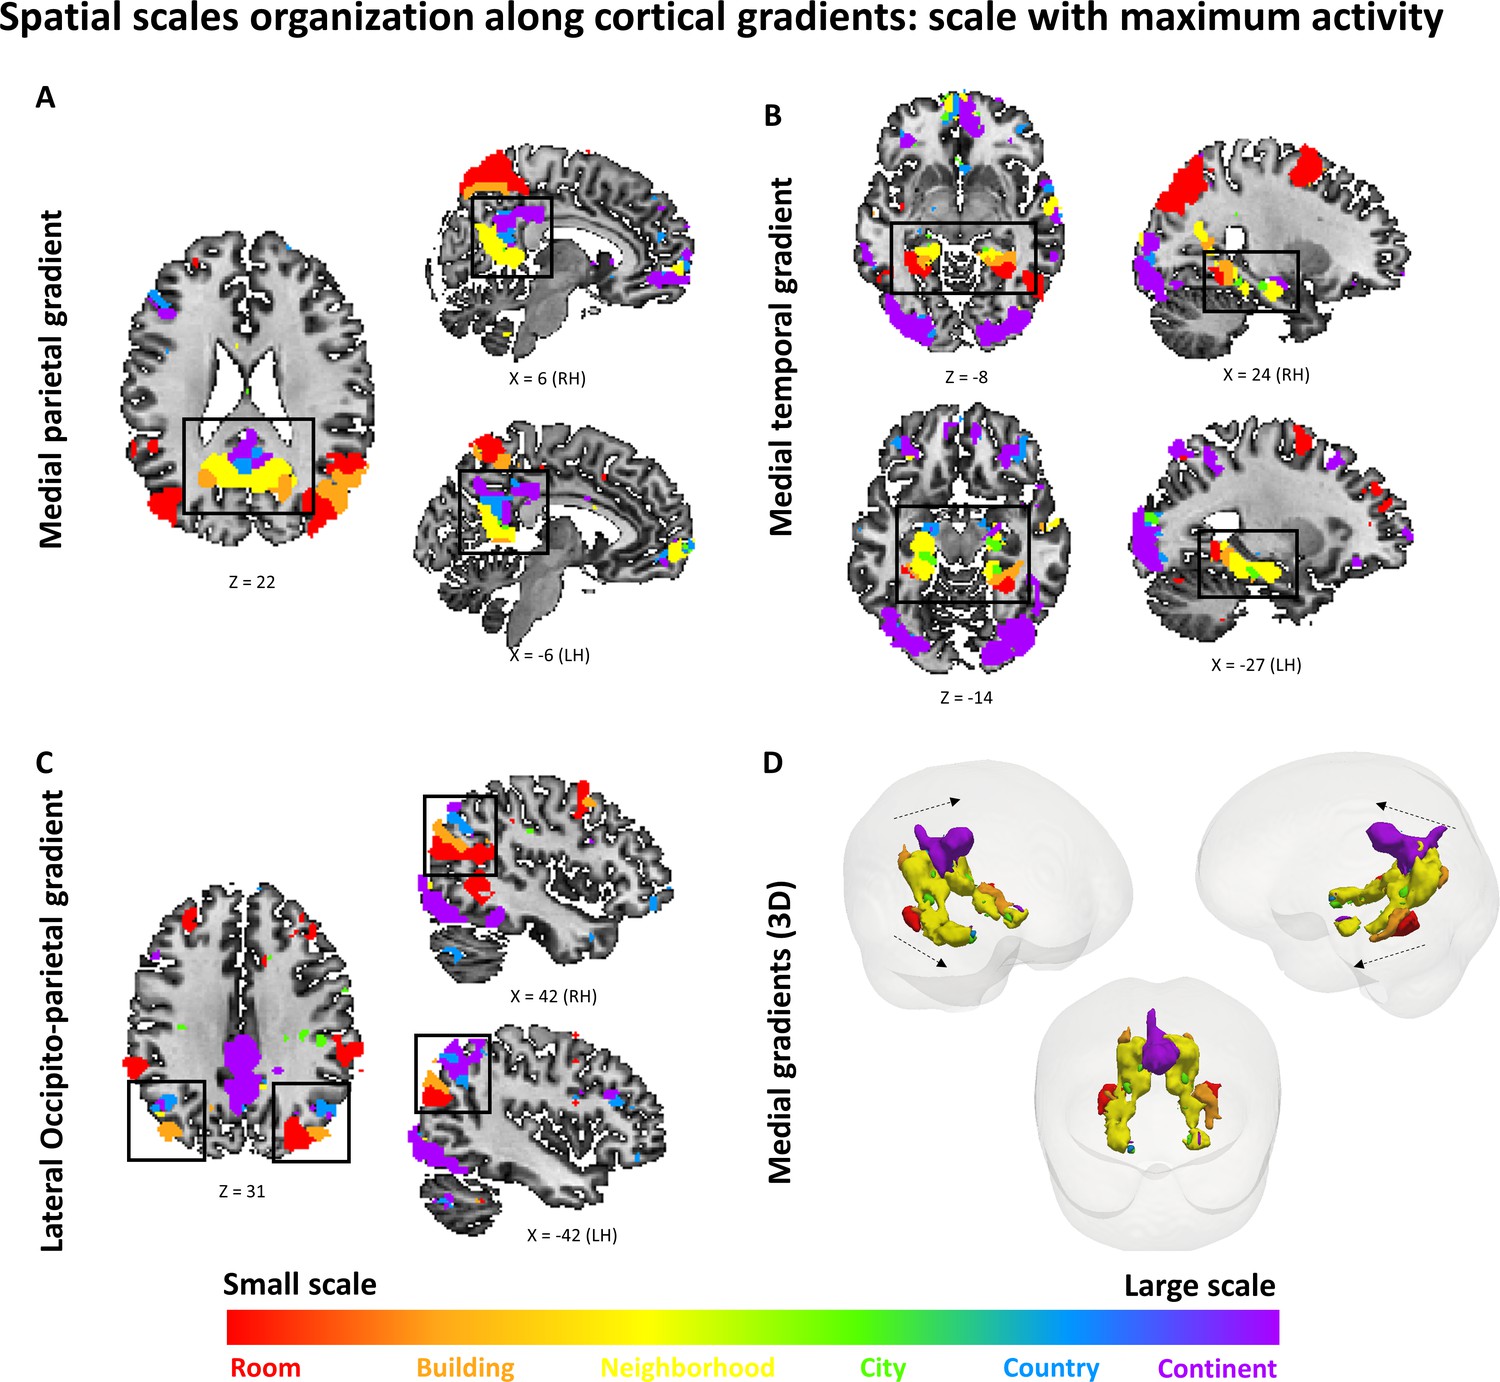
Figure 2—figure supplement 2
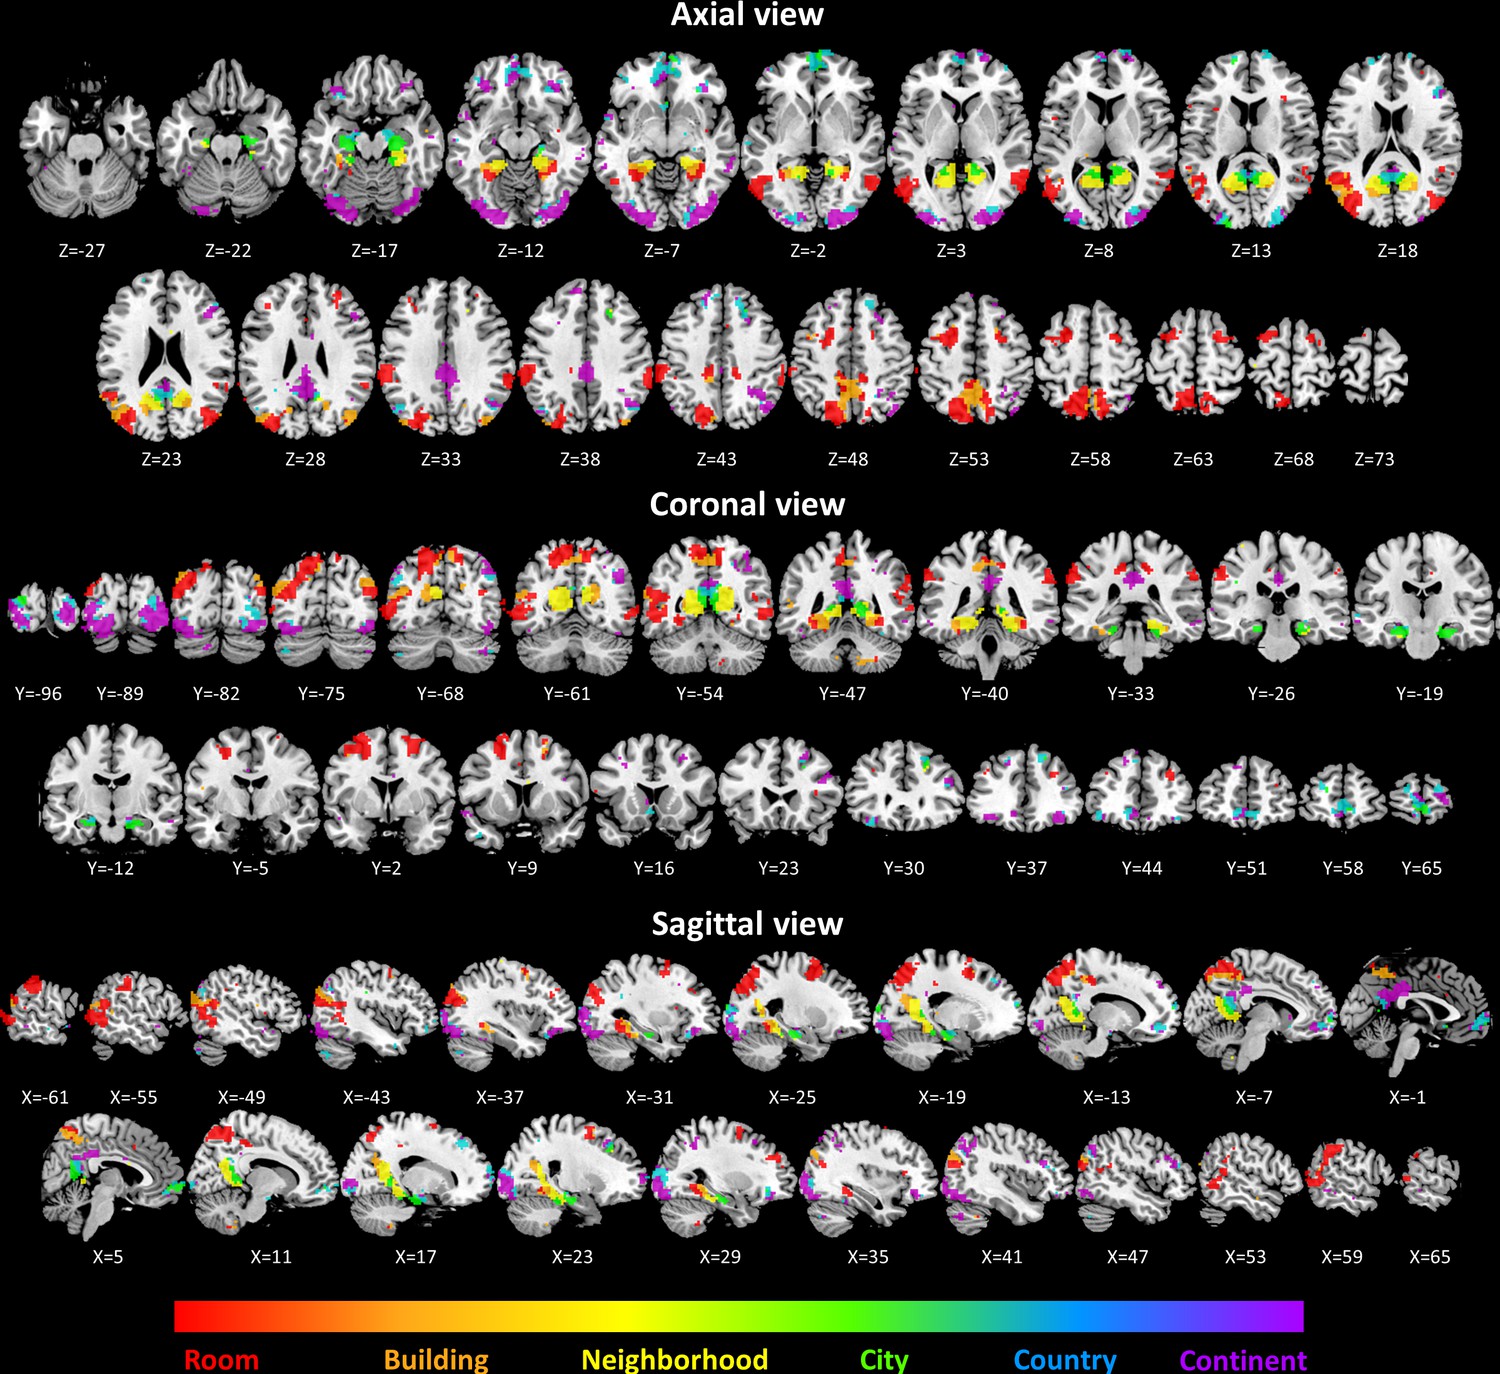
Figure 2—figure supplement 1

In addition to the continuous gradients, several other brain regions displayed scale-specific activity not organized as a continuous gradient (Figure 3, Supplementary file 1). Clusters of activity at the supramarginal gyrus, posterior temporal cortex, superior frontal gyrus and dorsal precuneus displayed the highest activity levels for the smallest spatial scales (room and building), and their activity gradually diminished for larger scales (Figure 2—figure supplement 4D). In contrast, the lateral occipital cortex and the anterior medial prefrontal cortex clusters displayed the opposite pattern of higher activity for the largest spatial scales (city, country and continent), and gradually decreasing activity for the smaller scales (Figure 2—figure supplement 4D).Figure 3
The three cortical scale-selective gradients extend anteriorly from scene-responsive cortical regions
The three cortical gradients identified by our analyses are located in close proximity to known scene-responsive cortical regions – parahippocampal place area (PPA), retrosplenial complex (RSC) and occipital place area (OPA) (Epstein et al., 2017). To test the exact locations of these regions with respect to our findings, we used masks of these regions as previously defined on an independent sample (Julian et al., 2012).
The three regions (PPA, RSC and OPA) were found to be situated at the posterior part of the medial temporal, medial parietal and lateral occipito-parietal gradients, respectively. Accordingly, the scene-responsive regions were most active for the small and medium scales: room, building and neighborhood (Figure 4).
This finding suggests their stronger involvement in the processing of immediate visible scenes, compared to more abstract larger environments. However, these regions also showed activity for the larger scales, suggesting that their computational role may extend beyond the exclusive processing of the immediately visible environment, though to a lesser extent (Figure 4).Figure 4

The three cortical gradients indicate a shift between the visual and default-mode brain networks
To relate the three cortical gradients to large-scale brain organization, we compared their anatomical distribution to a parcellation of the brain into seven cortical resting-state fMRI networks, as identified in data from 1000 subjects (Yeo et al., 2011). Across the three gradients, the posterior regions (related to processing of small scales) overlapped mainly with the visual network, while the anterior regions (related to processing of large scales) mainly overlapped with the default-mode network (Supplementary file 1).
Differences in scale selectivity between the three cortical gradients
The previous analyses identified three cortical regions with gradual progression of scale selectivity. We next attempted to identify differences between these three regions that may be indicative of their functions. To this aim, we analyzed the number of voxels with preferential activity for each scale within each gradient (Figure 5, Figure 5—figure supplement 1). The medial parietal gradient was mostly active for the neighborhood, city and continent scales, indicating a role for this region in processing medium to large scale environments. In contrast, the medial temporal gradient contained mostly voxels sensitive to scales up to the city level, suggesting that this region is involved mostly in processing small to medium scales. Finally, the lateral occipito-parietal gradient was most active for the smallest scales (room, building) and the largest (continent) scale. These findings demonstrate that despite their similar posterior-anterior organization, the three scale-sensitive cortical gradients have different scale preferences, indicating possible different spatial processing functions.Figure 5 with 1 supplemen
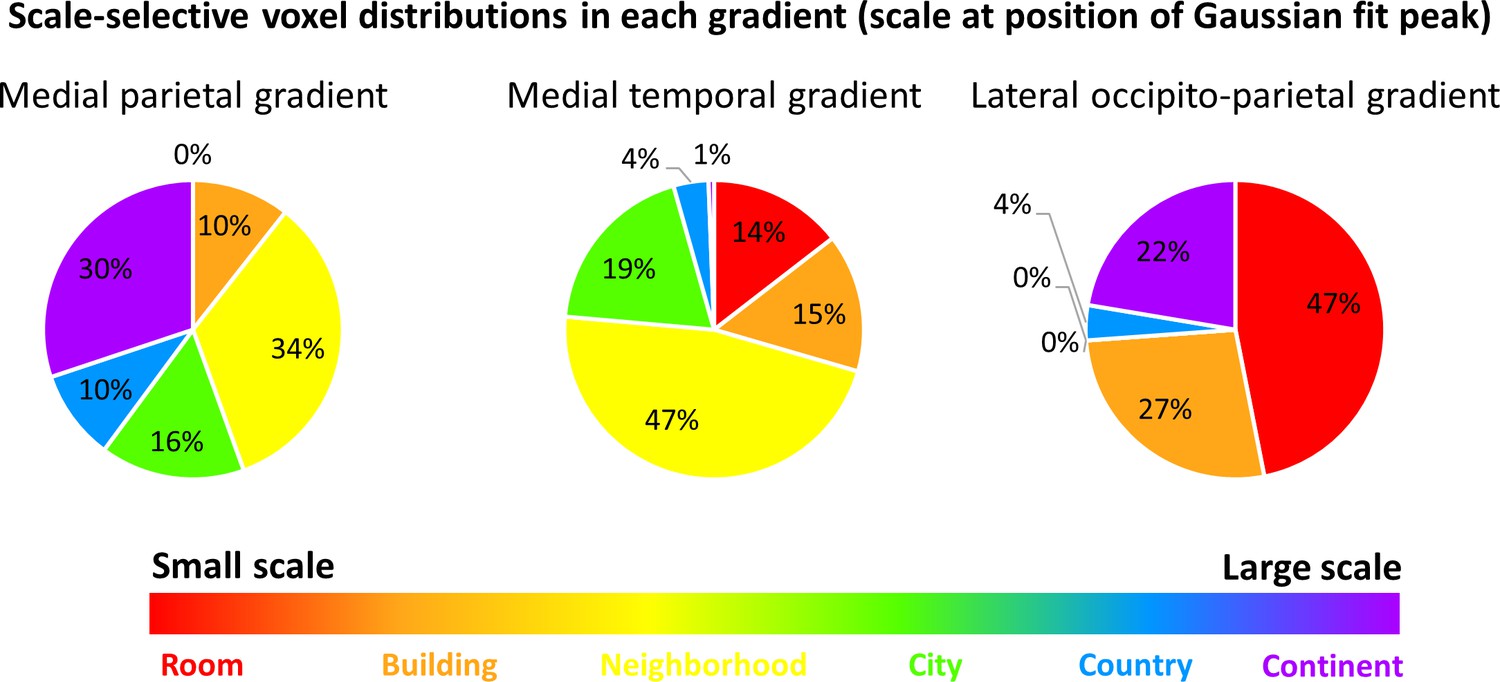
Figure 5—figure supplement 1

Subjects’ behavioral ratings and their relation to the scale effects
Analysis of subjects’ ratings of emotional significance and task difficulty for each location indicated no significant differences between scales, except for difficulty difference between the continent and the room and neighborhood scales (Figure 1—figure supplement 2A–B; correlation between difficulty and scale, r = 0.39; p<0.05, two-tailed one-sample t-test across subjects). Familiarity ratings did significantly differ across scales, with larger average familiarity for the smaller scale environments (Figure 1—figure supplement 2C; average correlation of familiarity and scale increase, r = −0.72; p<0.05, two-tailed one-sample t-test across subjects). First-person perspective taking and third-person perspective taking ratings were also highly correlated with scale increase, indicating a gradual shift between imagination of locations from a ground-level view in small-scale environments to imagination from a bird’s-eye view in large-scale environments (r = −0.81, r = 0.80, respectively; both p<0.05, two-tailed one-sample t-test across subjects; Figure 1—figure supplement 2E, Supplementary file 1). Response times did not significantly differ between scales (Figure 1—figure supplement 2D). The verbal descriptions of task-solving strategy confirmed the trend of decrease in ground-level and increase in map-like (or ‘bird’s-eye’) imagination with increasing scale (Supplementary file 1). These descriptions also demonstrated that as the scale decreased, subjects increasingly relied on estimations of walking or driving times between locations, except for the room scale where this strategy was not used (Supplementary file 1).
To measure the effect of these different factors on the observed activations, we used parametric modulation using subjects’ ratings of emotion, familiarity, difficulty, perspective taking and strategy. The familiarity, perspective taking (first-person and third-person) and reports of use of a map strategy showed significant effects inside the scale-related gradients, in accordance with their high correlation to spatial scale (Figure 2—figure supplement 5). No other factor showed any significantly active regions in this analysis.
We next contrasted the activity for the experimental task with that for the lexical control task at each region. Within the three gradients, this contrast revealed significantly higher activity for the spatial task compared to the lexical control task (GLM contrast, all p-values<0.05, FDR corrected for multiple comparisons across regions), except for the anterior city, country- and continent-related regions in the medial temporal gradient and the continent region in the occipito-parietal gradient. Among the other scale-sensitive regions outside of the gradients, only the supramarginal and lateral occipital cortex clusters did not show a significant activity above that of the lexical control task.
Source:
UPF Barcelona
Media Contacts:
Press Office – UPF Barcelona


