


 Extract (6-MSITC) in Healthy Older Adults")
: An In-Depth Exploration into its Thermogenic Role and Social Significance")


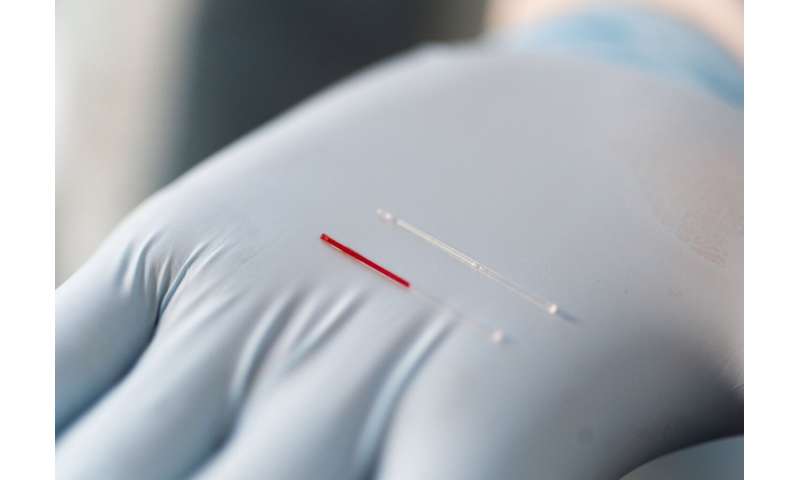
Using an array of tiny needles that are almost too small to see, researchers have developed a minimally-invasive technique for sampling a largely-unexplored human bodily fluid that could potentially provide a new source of information for routine clinical monitoring and diagnostic testing.
Biochemical information about the body most commonly comes from analysis of blood – which represents only 6% of bodily fluids – but valuable information may also be found in other bodily fluids that are traditionally hard to get.
Researchers have now developed a way to extract dermal interstitial fluid (ISF) – which circulates between cells in bodily tissues – using a simple through-the-skin technique that could provide a new approach for studying the metabolic products of cells, obtaining diagnostic biomarkers, and identifying potential toxins absorbed through the skin.
Because the dermal interstitial fluid doesn’t clot like blood, the microneedle-based extraction could offer a new approach for continuous monitoring of glucose and other key health indicators.
Results of a human trial on the microneedle-based ISF sampling is reported Nov. 25 in the journal Science Translational Medicine. The study, conducted by researchers from the Georgia Institute of Technology and Emory University, was supported in part by the National Institutes of Health.
“Interstitial fluid originates in the blood and then leaks out of capillaries to bring nutrients to cells in the body’s tissues. Because interstitial fluid is in direct communication with the cells, it should have information about the tissues themselves beyond what can be measured from testing the blood,” said Mark Prausnitz, Regents’ Professor and J. Erskine Love Jr. Chair in Georgia Tech’s School of Chemical and Biomolecular Engineering, “This microneedle-based technique could provide a minimally-invasive and simple way to access this interstitial fluid to make it available for medical diagnostic and research applications.”
ISF has been difficult to sample. Indwelling instruments for monitoring glucose in ISF already exist, and other researchers have used surgically-implanted tubing and vacuum-created blisters to extract ISF through the skin, but these techniques are not suitable for routine clinical diagnostic use.
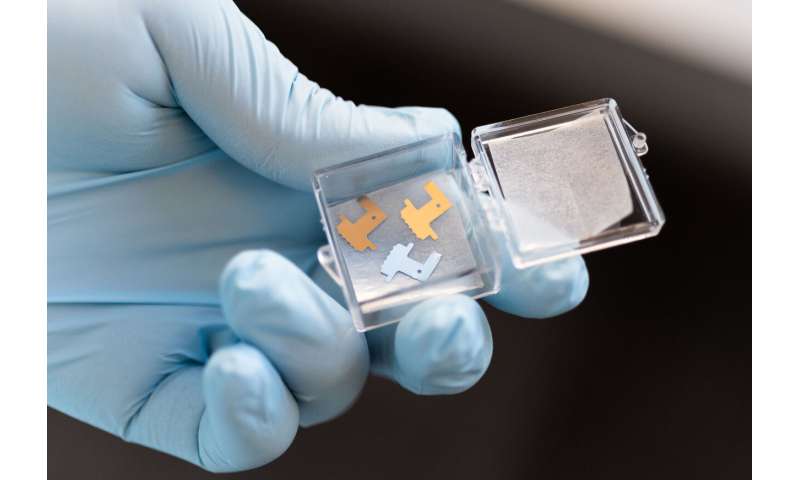
The researchers, led by first author Pradnya Samant, used a patch containing five solid stainless-steel microneedles that were a hundredth of an inch in length. By pressing the patch at an angle into the skin of 50 human subjects, they created shallow micropores that reached only into the outer layer of skin containing ISF.
The researchers then applied a suction to the area of skin containing the pores and obtained enough ISF to do three types of analysis. For comparison, they also took blood samples and obtained ISF using the older blister technique.
To accurately determine the biomarkers available in the ISF, the researcher needed to avoid getting blood mixed with the ISF. Though major blood vessels don’t exist in the outer layers of skin, capillaries there can be damaged by the insertion of the microneedles. In their studies, the researchers found that if they slowly ramped up the suction after inserting the microneedles, they could obtain fluid clear of blood.
The overall extraction procedure took at total of about 20 minutes for each test subject. The procedure was well tolerated by the volunteers, and the microscopic pores healed quickly within a day with minimal irritation.
The extracted fluid was analyzed at Emory University using liquid chromatography-mass spectrometry techniques to identify the chemical species it contained.
Overall, there were about 10,000 unique compounds, most of which were also found in the blood samples. However, about 12 percent of the chemical species were not found in the blood, and others were found in the ISF at higher levels than in the blood.
“The skin is metabolically active, and it is full of cells that are changing the fluid,” Prausnitz said. “We found that some of the compounds were unique to the ISF, or enriched there, and that is what we were hoping to find.”
While not all the compounds unique to the ISF could be analyzed, the research team identified components of products that are applied to the skin – such as hand lotions – and pesticides that may enter the body through the skin. This discovery could set the stage for use of the microneedle technique for dermatological and toxicology studies.
“If you want to look at what accumulates in the skin over time, this may provide a way to obtain information about those kinds of exposures,” Prausnitz said. “These are materials that may accumulate in the tissues of our body, but are not found in the bloodstream.”
The researchers also determined the pharmacokinetics of caffeine and the pharmacodynamics of glucose – both small molecules – from the ISF, indicating that that dynamic biomarker information could be obtained from the technique.
Those measurements suggested that ISF could provide a means for continuously monitoring of such compounds, taking advantage of the fact that the fluid does not clot.
“We were encouraged that we found a good correlation between the blood and interstitial fluid glucose, which suggests we might be able to have a continuous glucose monitoring system based on this technology,” Prausnitz said. A microneedle-based system could provide a less-invasive alternative to existing implantable glucose sensors by allowing the sensing components to remain on the surface of the skin.
In future research, Prausnitz would like to reduce the time required to extract the ISF and simplify the process by eliminating the vacuum pump. Additional study of the compounds found in the fluid could also show whether they may have medical diagnostic value.
“We’d like to make this microneedle-based technique available to the research community to make ISF routinely available for study,” he said. “Tissue interstitial fluid could be a novel source of biomarkers that complements conventional sources. This research provides a means to study this further.”
Blood is the gold standard matrix for the analysis of most biomarkers in humans, i.e., for the monitoring of molecules that relate to health and for the detection or prediction of disease. Recently, interstitial fluid (ISF) has been proposed as an alternative or complementing matrix to blood for these purposes (1).
ISF surrounds the cells of all tissues and provides a medium for the transport of nutrients, signals, and waste products. The capillary endothelium allows molecules to actively or passively transport between blood plasma and ISF (2). Thus, the molecular composition of plasma relates to that of ISF (3). Difficulties in harvesting ISF using non- or minimally invasive methods have limited its use in clinical and research settings. Furthermore, there is still a lack of characterized biomarkers present in ISF.
Two areas for the use of biomarkers in ISF have been proposed: I) as an alternative to blood to monitor systemic responses (4); and II) for the analysis of molecules that reflect the local environment at the site of sampling, which cannot be quantified in the systemic circulation (5).
We recently showed that ISF derived from suction blister fluid (SBF) contains many lipids in similar proportions as in plasma and that ISF could be used interchangeably with plasma to monitor risk prediction biomarkers for cardiovascular disease, such as long-chain polyunsaturated fatty acids (4).
Proteomics studies have identified proteins that are unique to ISF, unique to plasma, or found in both compartments (5–7). Similarly, the transcriptome and the metabolome of ISF show resemblance to plasma but with distinct differences (8–10). These studies suggest that ISF could be used as a surrogate for plasma for the study of certain biomolecules, but also that non-overlapping information can be gained by analyzing ISF. However, most studies have focused on qualitative rather than quantitative differences between ISF and plasma.
Inflammation is characterized by the release of a large repertoire of molecules at the inflamed tissue and also into systemic circulation. Blood interleukins and cytokines are used as diagnostic biomarkers for inflammation caused by allergic reactions (11), autoimmune diseases (12), and to follow the immune system based on the response from different cell types after transplantation (13).
As an example, Interleukin 6 (IL-6) is routinely used as a biomarker for the acute response of the immune system and serves as an early indicator of bacterial infection (14). Knowledge about how inflammatory markers found in blood relate to those in ISF is therefore of great clinical value for the possible future use of ISF in health monitoring.
Here, we analyzed the levels of 92 inflammatory markers in ISF from suction blisters and in plasma using semi-quantitative proteomics by Proximity Extension Assay (PEA). In comparison to mass spectrometry, which has been the primary method for analyzing the proteomes of ISF and plasma, PEA offers superior analytical sensitivity that allows the quantification of low abundant proteins, thereby capturing information on mediators with important signaling roles. Our results show that ISF and plasma have unique protein profiles but that many inflammatory markers are proportionally related between the matrices on an individual subject level.
Plasma and Suction Blister Fluid Show a Large Overlap in Detectable Inflammatory Markers
Of the 92 targeted proteins, 75 (82%) and 76 (83%) in plasma and SBF, respectively, could be quantified above LOD ( Table S1 ). Only 5 proteins quantified above the LOD were unique to plasma whereas 6 of the proteins quantified above the LOD were unique to SBF ( Table S2 ). Consequently, 70 proteins were successfully quantified in both plasma and SBF (Figure 1A and Table S3 ).

Differential protein profiles in suction blister fluid (SBF) and plasma. (A) Venn diagram showing proteins quantified above the LOD unique to SBF (6 proteins) and plasma (5 proteins), and common to both matrices (70 proteins). Listed are those proteins detected above the LOD only in SBF or plasma, respectively. (B) Volcano plot showing the difference in protein abundance (ΔNPX) between SBF and plasma (x-axis) versus statistical significance (-log10 of the p-value, y-axis). Proteins with significant differences in abundance (Student’s t-test, p<0.05) between SBF and plasma are highlighted in blue. Proteins showing > fourfold (ΔNPX >2) difference in abundance between SBF and plasma are labeled.
Next, fold change in protein levels between plasma and SBF was investigated. For this and further analyses, only the 70 proteins that were detectable above the LOD in both plasma and SBF were considered. Thus, proteins unique to plasma or SBF were not included in the following analyses. The difference in protein levels between the two matrices is visualized in the volcano-plot in Fig 1B.
Highlighted are proteins with an NPX difference of >2 between plasma and SBF. Since NPX is in the Log2 scale, this represents proteins that show more than a fourfold abundance difference between the matrices. Of the proteins in plasma, 24 were significantly enriched, and in SBF 38 proteins were significantly enriched ( Table S3 ). Thus, a considerable fraction of the quantified proteins were found in higher concentrations in SBF than in plasma.
Plasma and Suction Blister Fluid Show Distinct Protein Profiles
Protein profiles were further investigated using principal component analysis (PCA). The PCA score plot shows correlations between observations (Figure 2A) and the loading plot correlations between variables (Figure 2B) (two-component model with 61% of the variance explained by the first component and 8% by the second component, model R2X=0.69, and Q2 = 0.62). The score plot and loading plot can be compared to find relationships between observations and variables. Plasma and SBF samples were separated in the first component and in most, but not all cases the second component separated the study subjects.

Unsupervised and supervised separation of plasma and suction blister fluid (SBF) samples based on the abundance of 70 proteins. Unsupervised principal component analysis (PCA) based on data from 36 samples collected from 18 individuals is visualized as a score plot (explained variance: Component 1 = 61%, Component 2 = 8%) (A), showing clear separation of plasma and SBF samples, and corresponding loading plot (B) showing the correlations between underlying variables. In (A), triangles indicate samples from plasma and circles from SBF, and the numbers above symbols and color indicate the subject ID. (C) Loading column plot of the predictive component from a supervised orthogonal partial least squares discriminant analysis (OPLS-DA), aimed to separate samples based on class, i.e., plasma or SBF. In this model, differences in protein abundance that depend on class membership are captured in one predictive component. Variables with a high magnitude pq have a large discriminatory power and contribute significantly to separate plasma and SBF samples in the model.
In a subsequent orthogonal partial least squares discriminant analysis (OPLS-DA), samples were separated based on group classification (plasma or SBF). In this supervised model, the between-group variation is captured in one component that is orthogonal to other variations (within-group).
Figure 2C shows the loading plot of the predictive component for the OPLS-DA model where protein abundance patterns unique to SBF are found to the left of the plot and those associated with plasma to the right. A large part of the variation between samples could be explained by matrix type according to the model (the model consisted of one predictive component, but no orthogonal components, model R2X = 0.61, R2Y = 0.98, and Q2 = 0.98, CV-ANOVA p = 1.7 × 10⁻²⁸).
The ability of the OPLS-DA model to discriminate plasma from SBF samples was validated by a permutation test in which the sample class was randomly permuted 999 times ( Figure S1 ). There was, as expected, a large overlap between proteins showing matrix specificity in the OPLS-DA model and those showing large differences in abundance between plasma and SBF (Figure 1B and Table S3 ). As the primary aim of this study was to identify inflammatory markers that show similar patterns in plasma and SBF, proteins that are not predictive for the OPLS-DA model are of the greatest interest. These are primarily proteins with a pq value close to zero in the OPLS-DA loading plot (Figure 2C).
Many Inflammatory Markers Show Correlation Between Plasma and Suction Blister Fluid
To further explore the relationship between inflammatory markers in plasma and SBF, the correlation in protein abundance between plasma and SBF was investigated. Out of the 70 proteins, 25 showed significant correlations between plasma and SBF at the p<0.05 level (Figure 3A and Table S1 ).
In Figures 3B–G, abundances in plasma and SBF are shown for the six proteins that displayed the highest correlation coefficients. Not only did these proteins show high correlations between the matrices, but also the absolute abundance was largely similar between plasma and SBF.

Correlation in protein abundance between SBF and plasma. (A) shows the Pearson’s correlation coefficient (black dots) and p-value (red squares) for the 25 proteins that demonstrated significant (p < 0.05) correlations in abundance between plasma and SBF. Whiskers indicate 95% CI. The relation between levels of Chemokine (C-C motif) ligand 25 (CCL25) (B), IFN-gamma (C) Fibroblast growth factor 21 (FGF-21) (D), FGF-19 (E), Cystatin-D (CST5) (F), and matrix metalloproteinase-10 (MMP-10) (G) in SBF and plasma are shown.
Reference link : https://www.ncbi.nlm.nih.gov/pmc/articles/PMC7670055/
ì
More information: P.P. Samant el al., “Sampling interstitial fluid from human skin using a microneedle patch,” Science Translational Medicine (2020). stm.sciencemag.org/lookup/doi/ … scitranslmed.aaw0285


