


 Extract (6-MSITC) in Healthy Older Adults")
: An In-Depth Exploration into its Thermogenic Role and Social Significance")


https://www.nature.com/articles/s41421-021-00329-3
Upon SARS-CoV-2 infections, many people developed various degrees of respiratory syndromes, and some with gastrointestinal conditions. It had been reported that blood coagulation disorders, vasculature issues, electrolytes imbalances, renal disorders, metabolic disorders, etc. were major clinical complications with COVID-1916,17.
The manner in which vaccination would mimic an infection has not been fully evaluated. In this study, we enrolled healthy volunteers who were to be vaccinated with an inactivated SARS-CoV-2 vaccine (Vero Cell)3, to participate in antibody and neutralizing antibody testings, as well as detailed clinical laboratory measurements before and at different times after vaccination (two-dose regimens with slightly different schedules were applied).
To our surprise, we observed quite consistent pathophysiological changes regarding electrolyte contents, coagulation profiles, renal function as well as cholesterol and glucose metabolic-related features, as if these people had experienced an infection with SARS-CoV-2. In addition, PBMCs scRNA-seq results also indicated consistent reductions in CD8+ T cells and increases in monocyte contents, as well as enhanced NF-κB inflammatory signaling, which also mimicked responses after infection.
Surprisingly, type I interferon responses, which had been linked to reduced damages after SARS-CoV-2 infection and milder symptoms, appeared to be reduced after vaccination, at least by 28 days post the 1st inoculation.
This might suggest that in the short-term (1 month) after vaccination, a person’s immune system is in a non-privileged state, and may require more protection.
Alterations in clinical laboratory measurements after vaccination
Clinical laboratory routine tests including infection-related indices, hematologic parameters, coagulation function, blood glucose, serum lipids, cardiac function-related enzymes, electrolytes, liver, and renal function-related biomarkers, were measured to reveal safety features of the vaccine (Fig. 2a and Supplementary Tables S4 and S5). White blood cell count was significantly, yet only slightly, increased after vaccination on day 7.
No differences were detectable at the following time points (Fig. 2b). To our surprise, quite consistent increases in HbA1c levels were observed in healthy volunteers, regardless of whether they belonged to cohort A or B. By day 28 post the 1st inoculation, three out of 11 individuals reached the prediabetic range (Fig. 2c). By days 42 and 90, medium HbA1c levels appeared to revert back, yet were still significantly higher than those before vaccination.
Fig. 2: Temporal changes of clinical laboratory measurements after vaccination.
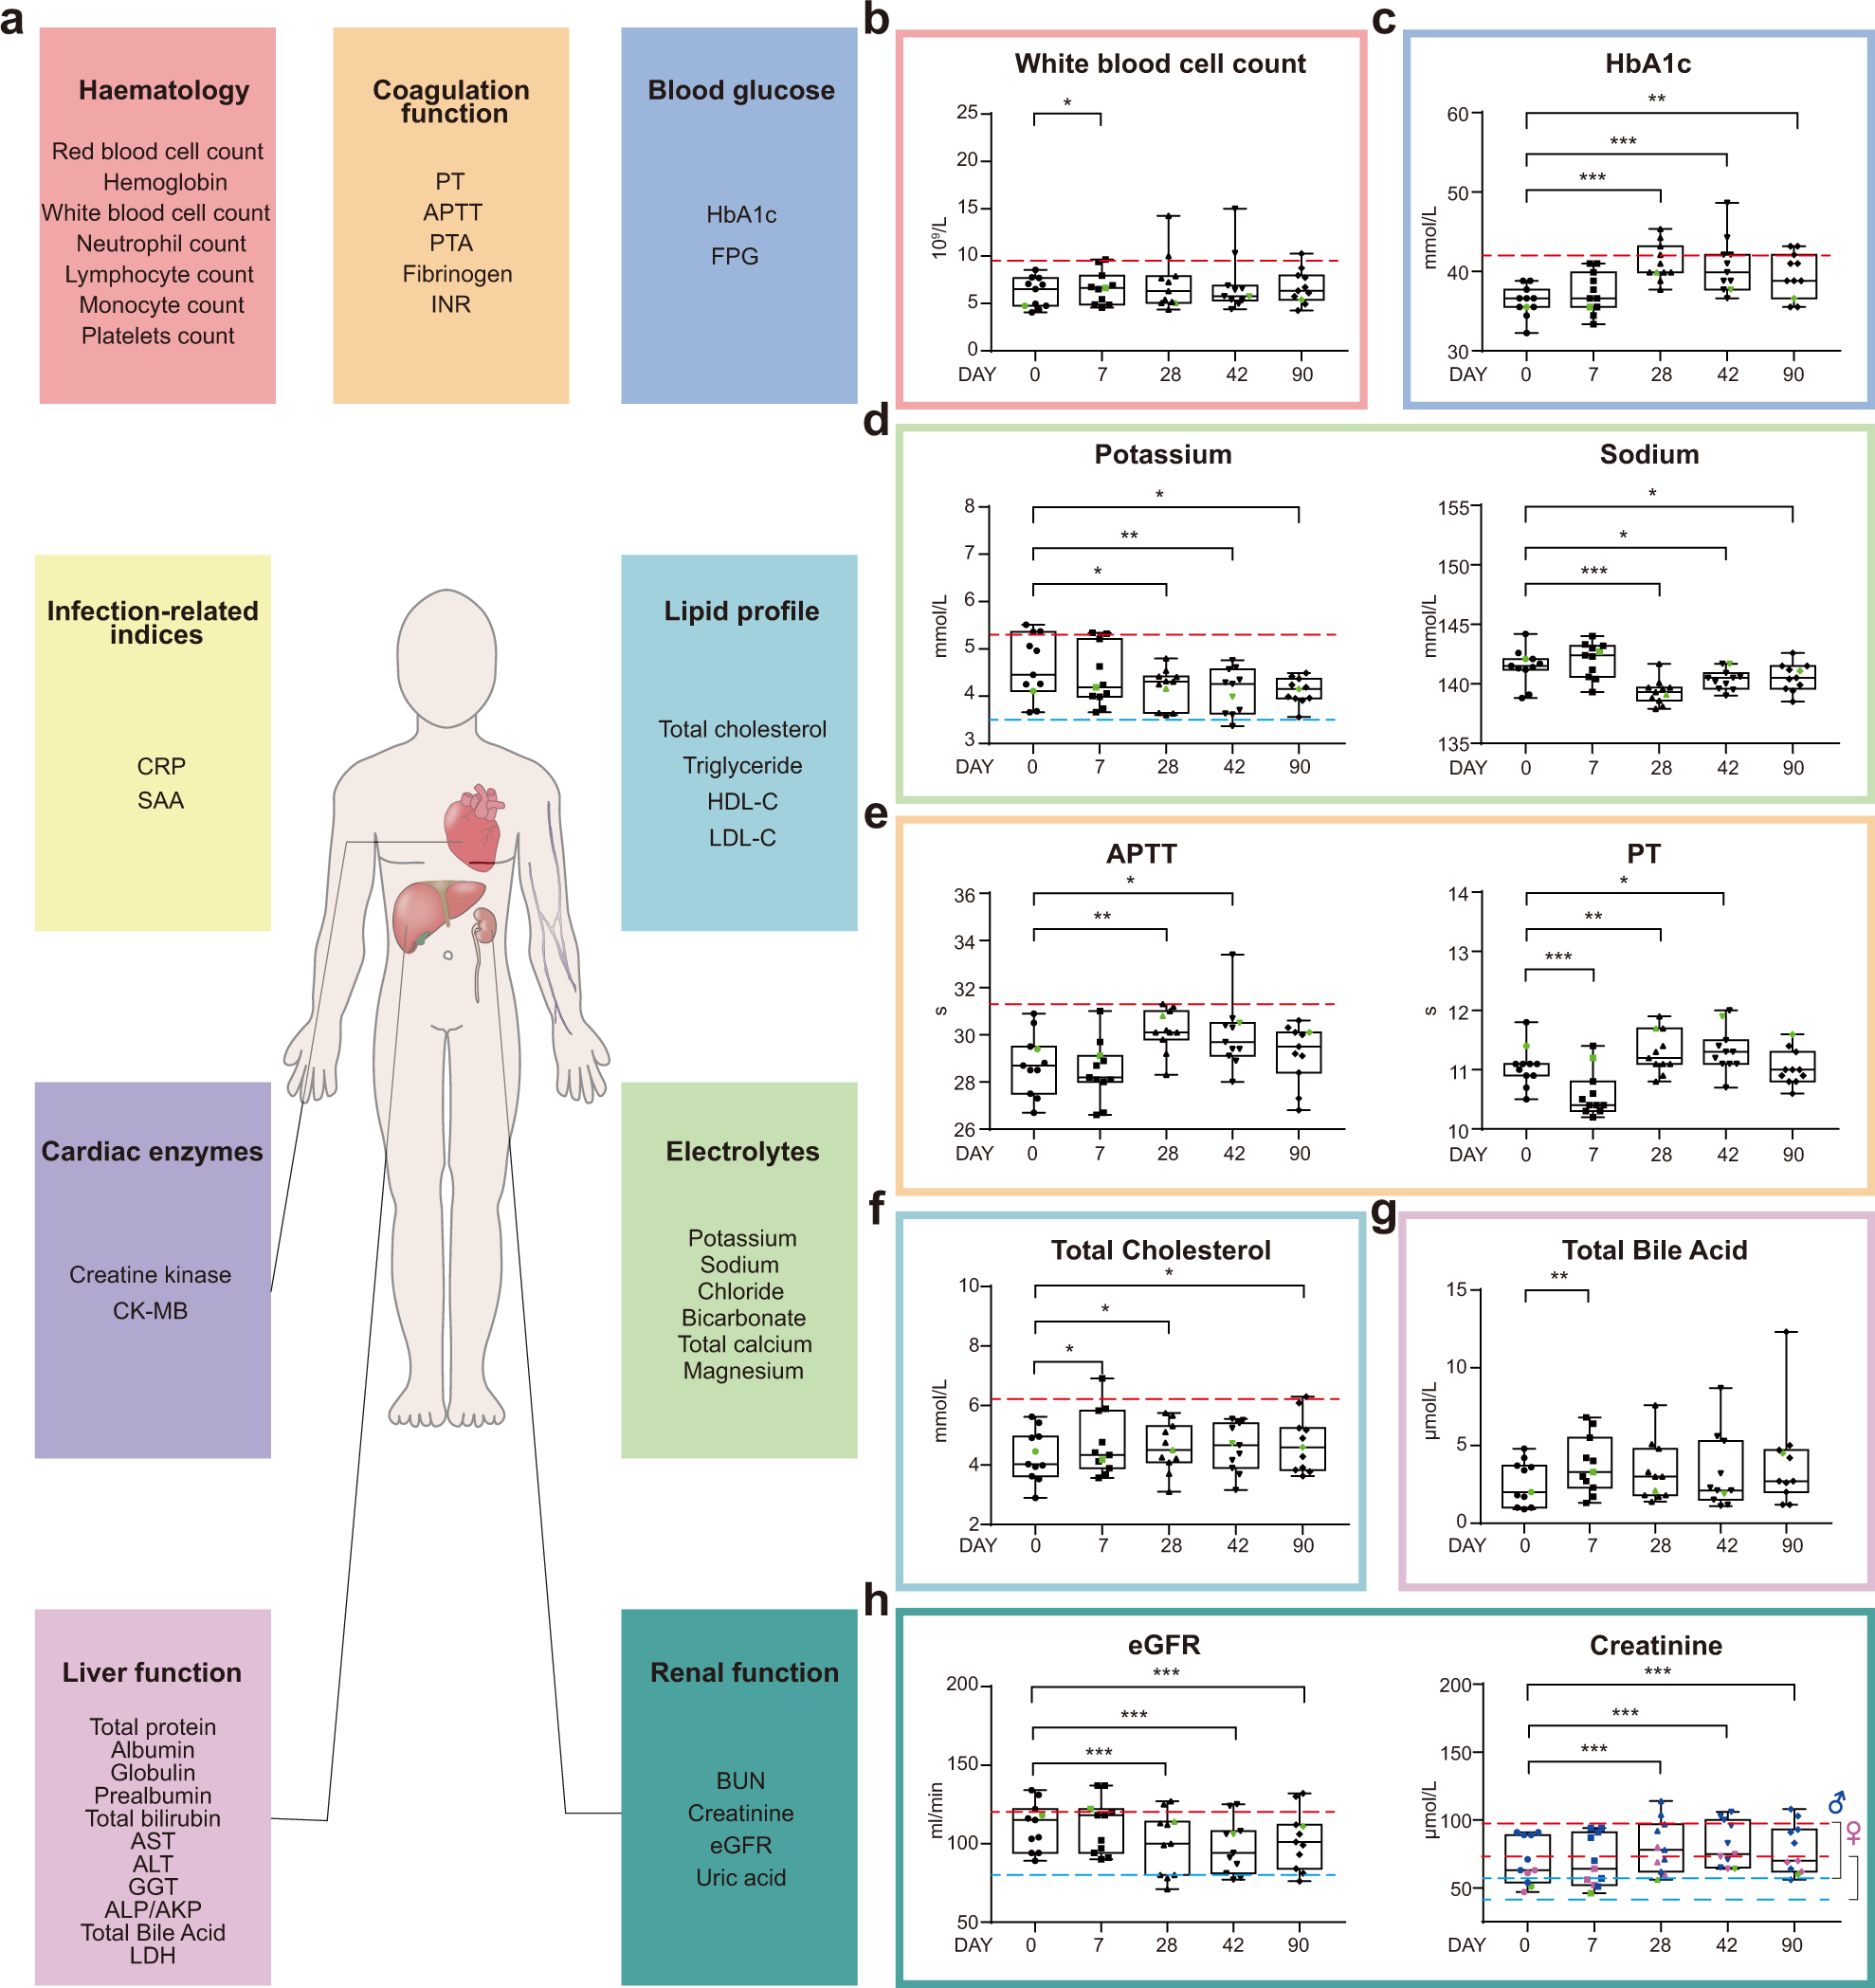
Serum potassium levels decreased significantly by days 28, 42, and 90 post the 1st inoculation, with one sample below the lower normal limit at day 42 (Fig. 2d, left panel). Similarly, serum sodium levels also decreased following vaccination (Fig. 2d, right panel), indicative of vaccine influences on electrolyte balance. Again, electrolyte imbalance has also been linked to COVID-1921.
By day 90, the profiles returned back to those before vaccination (Fig. 2e). Moreover, we found elevated blood cholesterol levels at days 7, 28 after the 1st inoculation, and elevated total bile acid levels were also detected at day 7 (Fig. 2f, g). Renal dysfunction is another clinical condition linked to COVID-19, and by 28, 42, and 90 days after the first inoculation, serum creatinine levels were significantly higher than those before vaccination, resulting in reduced eGFR (Fig. 2h).
Most of these clinical features have been reported to be associated with the development of severe symptoms in COVID-19 patients (Supplementary Table S6). Overall, there were no statistically significant differences between cohorts A and B, except for only a few indices (Supplementary Table S7), therefore data from two cohorts were pooled for clinical data presentation and subsequent analyses.
scRNA-seq revealed dramatic alterations in gene expression of almost all immune cells after vaccination
To explore the immunological features of healthy volunteers following vaccination, we performed droplet-based scRNA-seq (10× Genomics) to study transcriptomic profiles of PBMCs from volunteers belonging to either cohort A or B, before and 28 days after vaccination (Fig. 3a and Supplementary Fig. S1a).
After preprocessing and low-quality cell elimination (see “Materials and methods”), we obtained 188,886 cells from all PBMC samples, among which 86,685 cells were from cohort A and 102,201 cells from cohort B. All qualified cells were integrated into the unified dataset and subjected to downstream analyses.
Fig. 3: Changes in peripheral immune cell type and subtype compositions as well as gene expression before and 28 days after the 1st inoculation.
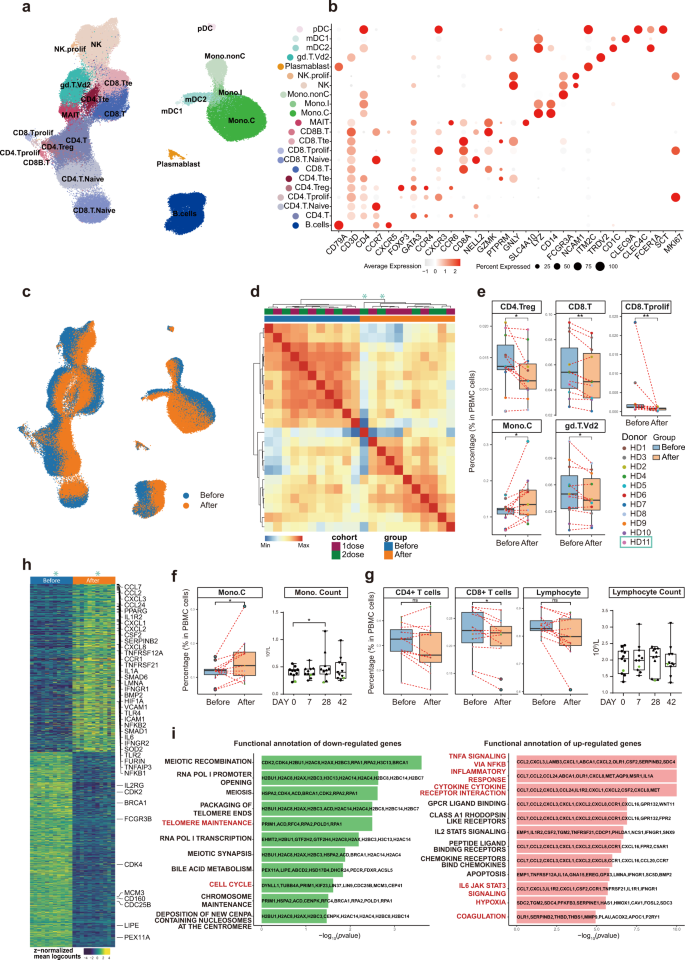
Using graph-based clustering of uniform manifold approximation and projection (UMAP)23, Single-cell Recognition of cell types (SingleR) algorithm24, and manual annotation based on canonical gene markers, we identified 22 cell types or subtypes and performed differential expression analysis amongst all cell types (Fig. 3b and Supplementary Table S8). Cells (cell transcriptomes) from samples before (blue) and after (orange) vaccination were distinctly separated in the UMAP representation for both cohorts, which meant immunological features had changed quite drastically in almost all immune cell types detected, and consistently in all volunteers (Fig. 3c).
Among the 11 pairs (before and after) of PBMC samples, 10 pairs were sequenced together and one pair was sequenced separately in a different batch. UMAP distributions were drastically similar regardless of the different batches, suggesting minimal sequencing batch effects (Supplementary Fig. S1b).
Two independent batches of sequencing revealed similar changes before and after vaccination, suggesting the changes are real, whereas using the batch effect correction method (Harmony25) (Supplementary Fig. S1c–e) would result in over filtration and elimination of the real changes caused by vaccination.
Moreover, sample clustering based on the Pearson Correlation coefficient of the transcriptomes indicated that samples from the two cohorts (A and B) intermingled well with each other both before and after vaccination, whereas vaccination-induced changes could clearly be observed (Fig. 3d). Therefore, to increase the statistical power, we combined the two cohorts for subsequent analyses.
To reveal differences in cell-type compositions before and after vaccination, we calculated relative percentages of all cell types in PBMCs of each individual on the basis of scRNA-seq data (Fig. 3e). We observed decreases in contents of CD4+ regulatory T cells (CD4.Treg), CD8+ T cells (CD8.T), and proliferating CD8+ cells (CD8.Tprolif) after vaccination (Fig. 3e).
Decreases in γδ-T cell (gd.T.Vd2) contents were also significant (Fig. 3e). In contrast, vaccination increased CD14+ classical monocyte (Mono.C) contents (Fig. 3e), consistent with clinical laboratory measurements (Fig. 3f). The overall lymphocyte contents, which included all CD4+ T cells, all CD8+ T cells, B cells, and NK cells, did not change significantly before and after vaccination, which was also confirmed by clinical laboratory measurements (Fig. 3g).
We collected a published dataset from 196 COVID-19-infected patients and controls7, and analyzed our data together with that dataset. The result indicated that vaccination-induced changes in cell contents of all five different immune cell subtypes also changed in the same directions in COVID-19 patients as compared to controls, except for proliferating CD8+ T cells (Supplementary Fig. S2).
To study detailed gene expression changes induced by vaccination, we merged individual samples into pseudo-bulk samples and used paired sample test to identify differentially expressed genes (DEGs) (Fig. 3h and Supplementary Table S9). Significantly upregulated genes were involved in “TNFα signaling via NF-κB”, “inflammatory responses”, and “cytokine-cytokine receptor interaction”, “IL6-JAK STAT3 signaling”, “coagulation”, “hypoxia”, which had been reported for COVID-19, while cell cycle-related pathways were downregulated (Fig. 3i). These results supported the notion that vaccination mimicked an infection6,7,8,9,10,11,12.
Featured immune cell subtype-specific gene expression changes mirrored clinical laboratory alterations
Prior to the elucidation of the functional heterogeneity and cell-type-specific gene expression changes between samples before and after vaccination, we grouped cells into 11 major types: (1) naive-state CD4+ T cells, (2) naive-state CD8+ T cells, (3) CD4+ helper T cells (including CD4.T, CD4.Treg, and CD4.Tprolif), (4) CD8+ cytotoxic T cells (including CD8.T, CD8B.T, and CD8.Tprolif), (5) MAIT, (6) γδ-T cells, (7) NK cells (including NK, NK proliferative), (8) B/plasmablast cells (including B cells and plasmablasts), (9) monocytes/dendritic cells (including classical mono, intermediate mono, non-classical mono, myeloid DC1, myeloid DC2, and plasmacytoid DC), (10) CD4+ terminal effector T cells, and (11) CD8+ terminal effector T cells.
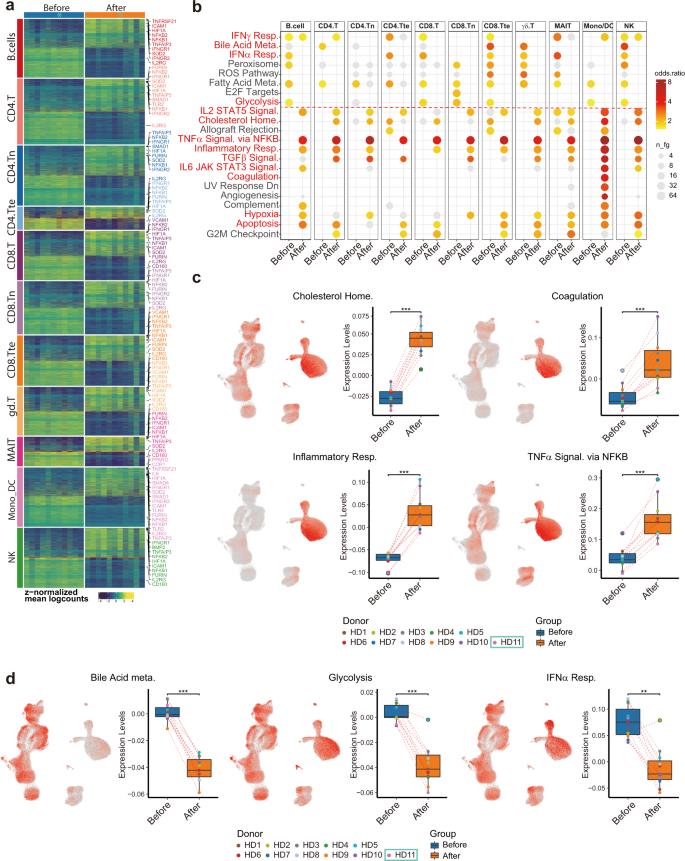
Following eleven major cell-type categorizations, we performed sample-level comparisons by aggregating gene expression across major cell types within each donor and then performed differential expression analysis using muscat26. We identified diferentially expressed genes (DEGs) among all major cell types (Fig. 4a and Supplementary Table S10) and conducted gene functional analysis (Fig. 4b). Echoing the clinical measurement results, genes related to “cholesterol homeostasis”, “coagulation”, and “inflammatory response” (CXCL8, CD14, IL6, and TNFRSF1B), “TNFα signaling via NF-κB” (NFKB1, NFKB2, NFKBIE, TNFAIP3, and TNFSF9) and “hypoxia” (HIF1A) were upregulated.
In addition, “TGFβ signaling”, “IL2-STAT5 signaling” (IFNGR1, MAPKAPK2, and CASP3), and “IL6-JAK-STAT3 signaling”-related genes were also upregulated (Fig. 4c). To visualize which cell types were enriched for those signatures, we performed gene module scoring and displayed the scores on UMAP coordinates as well as grouped box plots (Fig. 4c and Supplementary Table S11).
Interestingly, “inflammatory response” genes were highly expressed in monocytes and after vaccination further increased (Fig. 4c), suggesting monocytes were one of the major cell types participating in inflammatory responses after vaccination. In contrast, genes related to “glycolysis”, “bile acid metabolism”, and “type I interferon (IFN-α/β) response” were downregulated, consistent with our clinical data and the pathophysiology of COVID-1913 (Fig. 4d).
Fig. 4: Subtype-specific differential gene expression and gene set overrepresentation analyses depicting common gene expression changes amongst different types of immune cells after vaccination.
Vaccination-induced inflammatory responses in monocytes
Recent reports have described conserved host immune response signatures to respiratory viral infections, namely the Meta-Virus Signature (MVS), which is also conserved in SARS-CoV-2 infection32,33. Higher MVS scores are associated with infection32,33. In all, 380 (158 positively- and 222 negatively contributed to MVS scores) out of 396 (161 positively- and 235 negatively contributed) genes selected for MVS measurement were detected in our dataset.
To investigate host immune responses after vaccination with inactivated SARS-CoV-2, we separated the positive and negative gene sets and calculated MVS scores (Fig. 6a). The MVS scores were substantially higher after vaccination (Fig. 6b, c), suggesting that vaccination mimicked an infection. Interestingly, the positive MVS gene set was predominantly expressed in monocytes, while the negative set in lymphocytes, indicating different cell-type-specific immune responses would take place after vaccination (Supplementary Fig. S3a, b).
Fig. 6: Monocytes displayed high MVS scores and MVS score-correlated pathways.
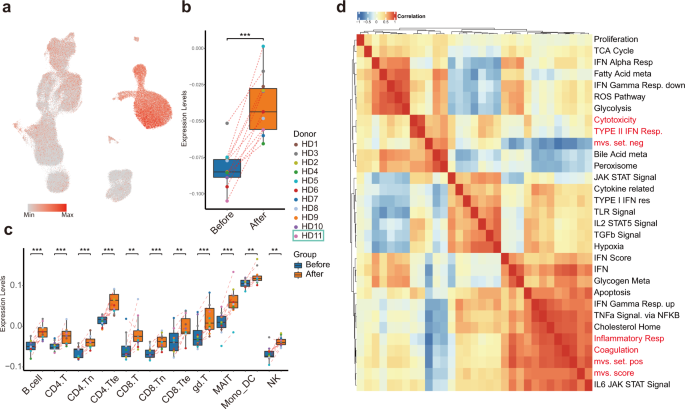
To investigate which pathways were associated with MVS-positive gene set and MVS-negative gene set, we calculated Spearman correlation among MVS gene sets scores and previously identified differentially enriched pathways using our scRNA-seq data (Fig. 6d). The most highly correlated pathway with MVS score and MVS-positive set was “Inflammatory response signaling”, which was strikingly upregulated in monocyte after vaccination, together with CD14, FPR1, C5AR1, NAMPT, NLRP3, CDKN1A, and IFNGR2. Whereas, MVS-negative set correlated well with “Cytotoxicity signature”, represented by NKG7, CCL4, CST7, PRF1, GZMA, GZMB, IFNG, and CCL3 expression, significantly decreased in many T-cell subtypes but not NK cells after vaccination (Supplementary Fig. S3c).


