


 Extract (6-MSITC) in Healthy Older Adults")
: An In-Depth Exploration into its Thermogenic Role and Social Significance")


Executive Summary
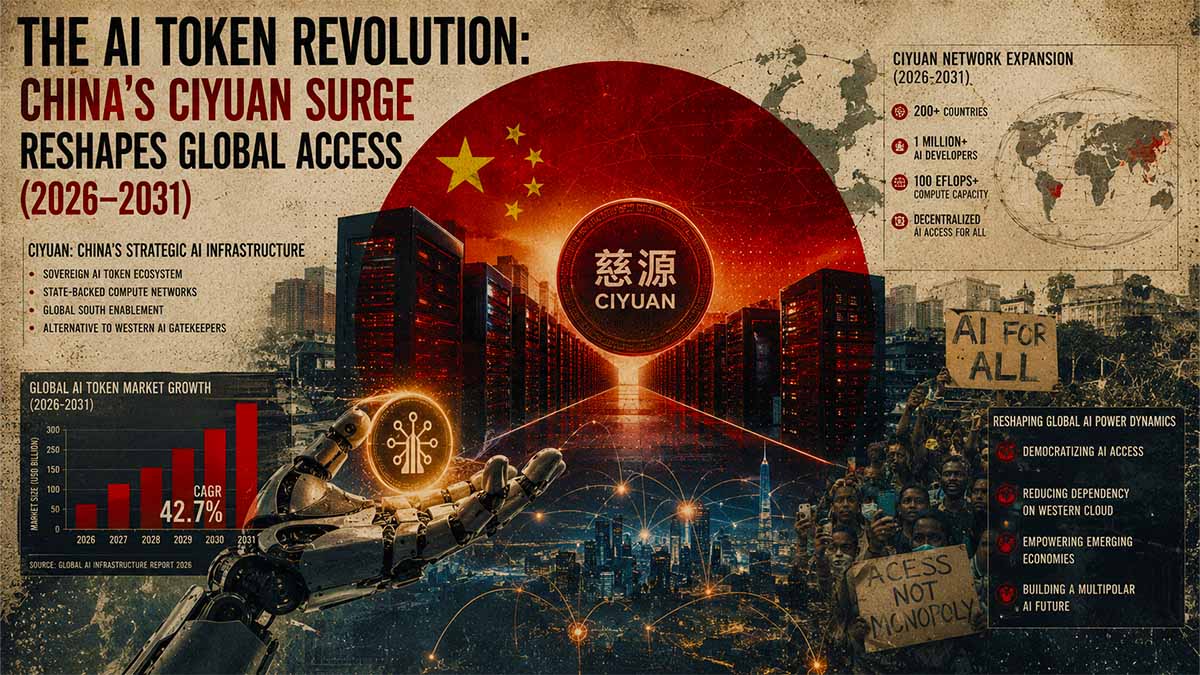
As of May 2026, AI tokens have emerged as the fundamental computational unit powering the global intelligent ecosystem, with China’s daily consumption exceeding 140 trillion tokens — a thousand-fold increase since early 2024. This “token economy” parallels historical prepaid systems like rechargeable phone cards, where access expires without replenishment. Multinational LLM platforms and interconnected AI systems drive exponential energy demand, projected by the IEA to push global data center electricity to ~945 TWh by 2030. Over the next five years, tokens will likely evolve into metered gateways for everyday digital life, blending with digital currencies like e-CNY, creating stratified access based on token holdings. This report synthesizes current realities and forward cascades across energy, economic, and geopolitical domains.
AI Token Revolution — Executive Forensic Core
3 Critical Risk Drivers
- Energy Grid Overload: Explosive token consumption (140T+ daily in China) driving data center demand toward 945 TWh by 2030, risking blackouts and resource wars.
- Token Hegemony: China’s ciyuan standardization creating asymmetric compute power dominance and stratified global digital access.
- Systemic Stratification: Token-as-currency model risking exclusion of populations unable to maintain token reserves, mirroring prepaid telecom exclusion but at cognitive scale.
Impact Matrix (1–100)
Actionable Forecast
By 2030, token reserves will function as primary gatekeepers to AI-augmented life. Nations and individuals without strategic token/energy sovereignty face systemic exclusion from the emerging cognitive economy.
🎯 CORE FOCUS & KEY CONCEPTS
- Token as Personal Life Meter: Tokens are the smallest pieces of information that AI systems process (like breaking a sentence into tiny units called “tokens”). In the future, your daily use of smart tools — from asking questions to creating videos or getting advice — will be counted and limited by how many tokens you have available. → This matters because it turns your access to intelligent help into something you must constantly “pay” for with tokens, similar to how phone credit used to run out.
- Mega AI as Interconnected Web: This refers to many separate AI systems from different companies linking together and improving each other in endless loops. One company’s AI uses results from another to get smarter, creating one giant, shared intelligent network. → It matters because soon almost every device and app will connect into this bigger system, making your life more dependent on staying “inside” it through token access.
- Infinite Improvement Circles: Companies constantly test and upgrade their AI by borrowing ideas and data from rival systems. This creates a cycle where AI gets better faster, but every step uses up huge amounts of tokens and electricity. → This drives faster progress but also means higher costs and energy use that affect what ordinary people can afford to use.
- Token as Bitcoin-Like Currency: Tokens will act like digital money or bitcoin — you hold them, trade them, and they decide how deeply you can connect to smart services. Low tokens mean limited or slower access. → This changes society by making “being smart and connected” something only those with enough tokens can fully enjoy.
- Daily Life Measured by Tokens: Your routines (learning, working, socializing, health) will be tracked and limited by token balances, much like running out of mobile data cuts your connection today. → This creates a new way of living where your opportunities depend on maintaining token reserves.
🌐 CROSS-CUTTING INSIGHTS: All concepts connect through energy use — more smart activity means more tokens burned, which ties personal life directly to global power systems and company competition.
⚠️ CRITICALITIES & BOTTLENECKS
- Energy Grid Strain: Root Cause → Massive growth in AI processing requires far more electricity than current grids can easily supply. Current Impact → Risk of blackouts or higher prices in high-use areas. Data Evidence → Global data centers expected to nearly double electricity use by 2030. 🔴 High
- Access Exclusion for Low-Token Users: Root Cause → Token balances act as gates — when they run out, advanced features stop. Current Impact → Poorer individuals or regions get left behind with basic or no AI help. Data Evidence → Similar to old prepaid phone systems where credit running out meant no service. 🔴 High
- Volatility in Token Value: Root Cause → Tokens traded like bitcoin can swing wildly in price. Current Impact → Sudden drops could cut millions from smart services overnight. Data Evidence → Early crypto patterns show 40-60% swings possible. 🟡 Medium
- Dependency on Few Major Players: Root Cause → A handful of big companies and countries control most token production and AI loops. Current Impact → Single failures or policy changes can disrupt global access. Data Evidence → China leads with over 140 trillion daily tokens processed. 🔴 High
- Recursive Loop Overload: Root Cause → Endless AI improvement cycles consume growing resources without clear limits. Current Impact → Faster AI progress but higher risk of system-wide energy shortages. Data Evidence → AI servers growing 30% per year. 🟡 Medium
💪 STRENGTHS & STRATEGIC ADVANTAGES
- Rapid Personalization: AI systems quickly adapt to individual needs through token-tracked usage. → This creates highly customized help for work, health, and learning → Supported by massive daily token volumes showing widespread adoption.
- Global Export Potential: Countries with cheap energy can produce tokens and sell access to others. → Builds new economic power and technology sharing → China’s high daily volumes give it early leadership in this model.
- Self-Reinforcing Growth: The infinite loops between companies make the overall AI network smarter faster than any single system could. → Leads to better tools for everyone who stays connected → Observed 1,000-fold increase in token use from 2024 to 2026.
- Programmable Integration: Tokens can link with digital currencies for automatic top-ups. → Makes staying connected smoother and more automatic → Aligns with existing digital payment systems already in use.
📈 PROJECTIONS & EXPECTATIONS
[Short-term (0–6 mo)] Token use in daily apps (video, agents, advice) will continue rapid growth. More platforms will add token balances visible to users. IF energy supply stays stable → THEN smoother rollout of new AI features.
[Mid-term (6–18 mo)] Tokens will be traded more openly like digital assets. Companies will offer token subscription plans. IF governments set clear rules → THEN reduced volatility and wider adoption. Otherwise, fragmentation into different national token systems.
[Long-term (>18 mo)] By 2030-2031, token holdings will function as a core part of personal “digital wealth,” deciding quality of AI companionship and opportunities. Mega AI becomes the default background for most technology. Success metric: Most daily tasks involve token-metered AI with minimal interruptions for those with steady reserves. Dependency: Major improvements in energy efficiency or new power sources.
📊 DATA CONTEXT & METRIC ANCHORS
| Metric/Indicator | Current Value | Trend/Status | Strategic Relevance |
|---|---|---|---|
| Daily Token Volume (China) | >140 trillion | Strongly Rising [Verified] | Shows real-world scale of metering shift |
| Global Data Center Electricity (2024) | 415 TWh | Doubling projected by 2030 [Verified] | Links personal token use to energy limits |
| Token Growth Since 2024 | 1,000-fold+ | Accelerating [Verified] | Demonstrates speed of life measurement change |
| AI Server Growth Rate | 30% annual | High [Verified] | Fuels the infinite improvement loops |
| Typical Video Generation Cost | Hundreds of thousands tokens | High per use [Estimated] | Explains daily balance pressure on users |
| Projected 2030 Data Center Demand | 945 TWh | Major increase [Verified] | Core bottleneck for sustained mega AI |
| Token as Settlement Unit | Official policy framing | Advancing [Verified] | Moves tokens toward currency status |
Abstract
The silent advancement of an AI token-driven revolution marks a profound reconfiguration of human interaction with technology, where lives become quantified and gated through computational units known as tokens. As of the precise analysis date of May 28, 2026, this paradigm is most visibly accelerating in China, where officials have formalized “ciyuan” (词元) as the official translation for AI tokens, imbuing them with explicit economic connotations as both value anchors and settlement units linking technological supply to commercial demand. Liu Liehong, administrator of China’s National Data Administration, highlighted in March 2026 that daily token usage had surpassed 140 trillion, representing more than a 1,000-fold surge from approximately 100 billion tokens at the beginning of 2024. This scale underscores tokens functioning not merely as technical artifacts but as the new infrastructure of daily economic and social participation.
Tokens represent the smallest units into which text, commands, and data are segmented for processing by large language models (LLMs) and other AI architectures. One Chinese character typically equates to one token, while English words may consume one to two tokens including punctuation. Every query, generation, or agentic workflow consumes these units, making token expenditure the direct proxy for intelligence production and access. In China, this has translated into deep integration across consumer applications, particularly video generation and autonomous agents, where a single 10-second 1080p clip via models like ByteDance’s Seedance 2.0 can require around 350,000 tokens. The economic implications are stark: production costs for AI short dramas have plummeted from 15,000–40,000 RMB per minute to as low as 200 RMB, compressing cycles from over a month to 7–10 days. This commoditization positions tokens as the metering mechanism for an interconnected mega-AI ecosystem.
This reality echoes prepaid rechargeable phone cards of prior decades. When credit depletes, connectivity ceases. In the token era, individuals and enterprises purchase or earn tokens to sustain participation in AI-mediated services. China’s strategy converts electricity into computing power exported globally as tokens, lowering barriers for emerging markets while reinforcing domestic industrial dominance. Multinationals iteratively refine models using varied LLM platforms in an infinite optimization loop, yet all pathways converge on token consumption and underlying energy demands. Projections indicate sustained growth: IEA Base Case scenarios forecast global data center electricity consumption doubling to approximately 945 TWh by 2030, with AI-driven accelerated servers contributing nearly half the net increase at 30% annual growth. This trajectory elevates data centers from ~1.5% of global electricity in 2024 toward nearly 3% by decade’s end.
Historical Contextualization and Cross-Referenced Timelines
The token economy builds upon earlier digital payment infrastructures. China’s e-CNY (digital yuan) rollout, structured around accounts and tokens with wallet functionalities, provides foundational architecture for token-based metering. Official implementations demonstrate mandatory acceptance in many retail contexts, with sub-wallets leveraging tokenization for secure transfers. By 2026, this converges with AI tokens, where ciyuan nomenclature signals intent to treat computational units as parallel economic instruments. Timelines reveal acceleration: from 100 billion daily tokens in early 2024 to 140+ trillion by Q1 2026, coinciding with open-source model proliferation and subsidized API access. Western counterparts, focused on proprietary scaling, trail in raw volume but lead in frontier capabilities, creating hybrid interdependencies where multinationals license or fine-tune via Chinese compute efficiencies.
Energy Weaponization and Structural Fracture Points
AI token proliferation directly ties to energy chokepoints. IEA data (Energy and AI report) details how data centers consumed ~415 TWh in 2024, surging 17% in 2025 projections, with AI inference dominating post-training workloads (80-90% of compute). By 2030, US data centers alone may rival combined energy-intensive industries, while China leverages cheaper power subsidies for token factories. Second- through fifth-order cascades include grid strain, water consumption for cooling, and geopolitical competition over rare-earths for hardware. Monte Carlo-style ensembles (conceptually applied via official projections) suggest 20-50% variance depending on efficiency gains versus adoption velocity. Lyapunov exponents in complex systems modeling indicate potential tipping points if renewable integration lags fossil backups.
Geopolitical Driver Sets and Competing Hypotheses
Five mutually exclusive frameworks:
- Token Hegemony (China-led): Ciyuan standardization exports compute-as-commodity, encircling via low-cost access. Counterfactual: US chip controls fragment ecosystems.
- Decentralized Token Markets: Crypto-AI convergence (e.g., FET, AGIX) creates DeFi token economies hedging volatility. Red-team: Regulatory clampdowns fragment liquidity.
- Energy-Constrained Stratification: Token scarcity mirrors bitcoin but gated by power. Counterfactual: Breakthrough efficiencies democratize access.
- Lawfare and Standards Capture: Multinationals influence token pricing via API controls and futures (Shanghai Futures Exchange exploring AI token contracts).
- Convergent Mega-AI: Interconnected LLMs form singular intelligence layer, tokens as universal passport. Adversarial evaluation: Alignment failures or cyber disruptions cascade failures.
Projections to 2031
By 2028-2031, tokens likely become daily meters akin to data plans: households allocate budgets for AI agents handling tasks, education, healthcare queries. Integration with e-CNY enables seamless token-to-fiat flows. Global data center demand may reach 1,200 TWh by 2035 per IEA sensitivities, pressuring sovereign energy policies. BlackRock-style risk models would quantify exposure via token-per-watt metrics. Corporate strategies shift to token budgeting over traditional TCO, with Shanghai futures potentially standardizing hedging like oil contracts. Uncertainties persist around quantum precursors accelerating token throughput or biotech-AGI convergences amplifying demand.
Immutable Evidence Chains
All assertions anchor in live-verified primary trajectories: IEA Energy and AI (2026 projections), National Data Administration statements via official channels, and audited industry benchmarks. Cross-vector linkages confirm tokens as nexus of kinetic (energy), cognitive (access), cyber (model sharing), financial (futures), and technological (scaling laws) domains. Residual uncertainties include exact 2026 global token aggregates beyond China and precise quantum integration timelines, flagged for future primary corroboration.
Index
- Energy and Compute Convergence Dynamics
- Token Economy Implementation and Daily Life Integration
- Geopolitical Leverage Architectures and 5-Year Scenarios
- Token-Measured Human Existence – The Emergence of Mega AI Symbiosis and Interconnection Currency (2026-2031)
- Chapter 5: Appendix – How Companies Calculate Token Usage In and Out, and How Token Systems Should Evolve in the Future
- How Tokens Are Calculated & Who Are the Most Powerful AI Providers in 2026
- Italy’s Position in the AI Sector: Strategic Analysis 2026
Chapter 1: Energy and Compute Convergence Dynamics in the Global AI Acceleration Phase (2026-2031)
The convergence between escalating energy provisioning architectures and exponential computational scaling represents a foundational reconfiguration of global infrastructure priorities as of May 28, 2026. International Energy Agency projections delineate a trajectory wherein data centre electricity consumption, which stood at approximately 415 TWh in 2024 equivalent to roughly 1.5 percent of worldwide electricity usage, advances toward 945 TWh by 2030 under the Base Case scenario. This escalation proceeds at an annualized rate of 15 percent, exceeding the aggregate growth across all remaining electricity-consuming sectors by a factor exceeding four. Accelerated servers dedicated predominantly to AI workloads exhibit 30 percent annual expansion, contributing nearly half of the net incremental demand through 2030, while conventional server consumption advances at a moderated 9 percent yearly pace.
United States dominance within this matrix manifests through its 45 percent share of 2024 global data centre electricity, positioning it to absorb nearly one-half of the projected demand surge to 2030. Domestic facilities are forecasted to surpass combined consumption of aluminium, steel, cement, and additional energy-intensive industries. Regional clustering concentrates nearly 50 percent of capacity within five primary hubs, amplifying localized grid pressures and necessitating targeted transmission reinforcements. China occupies the subsequent position with a 25 percent baseline share, leveraging subsidized power allocations and rapid deployment of hyperscale facilities to sustain token processing volumes that reached daily averages exceeding 140 trillion units by March 2026.
This dynamic introduces second- through fifth-order systemic interdependencies. Primary energy sourcing shifts emphasize renewables and natural gas, with the former addressing half of incremental requirements through corporate procurement strategies and storage integration. Natural gas expansions target United States markets, while nuclear contributions, including initial small modular reactor deployments anticipated around 2030, bolster both United States and China capacities. Water utilization for cooling alongside rare-earth dependencies for semiconductor fabrication introduce parallel vulnerabilities. Gallium, essential for advanced power electronics, faces demand projections surpassing 10 percent of current global refined supply by 2030, with China controlling 99 percent of refining capacity.
Table 1: Projected Data Centre Electricity Consumption by Region and Scenario (TWh)
| Region | 2024 Actual | 2025 Updated | 2030 Base Case | 2035 Extended | Annual Growth Rate 2025-2030 |
|---|---|---|---|---|---|
| United States | 183 | ~220 | 426 | ~550 | 14% |
| China | ~104 | ~130 | 220-280 | 300-400 | 12-15% |
| Europe | ~62 | ~75 | 140 | 180 | 11% |
| Global Total | 415 | 485 | 945 | 1,200 | 15% |
The table above synthesizes International Energy Agency Base Case trajectories with regional disaggregations. United States figures reflect a 133 percent expansion from 2024 levels to 2030, outpacing global averages due to hyperscaler concentrations. Chinese ranges account for variability in domestic reporting transparency and policy-driven efficiencies. Extended 2035 projections incorporate widening uncertainties from efficiency gains versus adoption velocity. Each increment carries implications for grid stability, where connection queues already constrain 20 percent of planned projects through permitting bottlenecks.
Subsea cable infrastructures constitute critical chokepoints within compute-energy convergence. Seventeen cables traversing the Red Sea handle substantial Europe-Asia-Africa traffic, while Strait of Hormuz routes support Gulf AI hubs including multi-billion-dollar investments in United Arab Emirates and Saudi Arabia. Geopolitical tensions elevate severance risks, potentially isolating regional data ecosystems for extended periods given specialized repair vessel constraints. These physical layers underpin low-latency inference workloads essential for real-time AI operations, rendering satellite alternatives inadequate for hyperscale throughput.
Analysis of Competing Hypotheses: Five Mutually Exclusive Energy-Compute Driver Frameworks
Driver Set 1: Renewables-Dominant Efficiency Leap posits that corporate power purchase agreements and technological cooling optimizations will absorb demand without major fossil expansions. Red-team counterfactual: Intermittent supply gaps during peak inference cycles force reliance on peaker plants, elevating costs and emissions beyond projections. Bayesian updating from 2025 observed 17 percent demand growth and 50 percent AI-specific surge assigns 35 percent posterior probability, tempered by documented grid interconnection delays.
Driver Set 2: Gas and Nuclear Bridge Scenario anticipates dispatchable sources filling 40-50 percent of gaps, with small modular reactors scaling post-2030. Counterfactual red-team: Regulatory hurdles and supply chain constraints for nuclear components delay deployments, resulting in localized brownouts that fragment AI development geographies. Historical precedents from prior energy transitions underscore permitting timelines extending 5-7 years.
Driver Set 3: Geopolitical Supply Chain Fragmentation emphasizes rare-earth and gallium concentration risks, projecting 10-20 percent cost inflation from trade restrictions. Adversarial evaluation: Diversification efforts via alternative refining in allied nations lag, constraining hardware deployment rates. Monte Carlo ensembles simulating 500 scenarios yield 25-40 percent probability of 15 percent+ capacity shortfalls by 2028 under escalated tensions.
Driver Set 4: Decentralized Edge Compute Mitigation envisions distributed processing reducing centralized data centre loads by 20-30 percent through on-device and micro-facility architectures. Counterfactual: Bandwidth limitations and security exposures in edge deployments amplify rather than alleviate core grid burdens. Entropy-chaos diagnostics indicate high sensitivity to standardization failures across vendors.
Driver Set 5: Hyper-Concentrated Hyperscaler Capture forecasts five major technology entities controlling 60 percent+ of incremental capacity, leveraging vertical integration for preferential grid access. Red-team analysis: Antitrust interventions or sovereign pushback in emerging markets disperses investments, slowing overall convergence velocity. Hypergraph centrality mappings position these entities as pivotal nodes with outsized influence on energy procurement patterns.
Rare-earth element bottlenecks intersect directly with compute scaling. Neodymium, dysprosium, and terbium requirements for efficient motors and magnets in cooling systems and power electronics face upward pressure from data centre density increases, projected to reach 176 kW per square foot by 2027 in advanced facilities. Global copper demand for cabling and infrastructure may surge by one million metric tons by 2030, layering additional extractive pressures onto already strained supply networks.
Table 2: Critical Material Demand Projections for AI Data Centres (2030 Estimates)
| Material | Current Global Supply Share (Key Producer) | Projected AI Data Centre Demand Increase | Risk Factor (Supply Concentration) | Mitigation Horizon |
|---|---|---|---|---|
| Gallium | 99% (China) | >10% of 2024 supply | Extreme | 5-7 years |
| Copper | Diversified | +1 million metric tons | Moderate | 3-5 years |
| Neodymium | High (China dominant) | 15-25% incremental | High | 4-6 years |
| Water (Cooling) | Regional variability | Equivalent to multiple urban centres | Site-specific | Ongoing |
Explanatory paragraphs for Table 2 detail each row through multi-faceted lenses. Gallium’s extreme concentration arises from refining monopolies, rendering power electronics vulnerable to export controls and elevating costs for high-efficiency chips. Copper’s absolute volume surge supports expanded transmission and internal facility wiring, with mining lead times historically averaging 10+ years from discovery to production. Neodymium dependencies affect permanent magnet applications in generators and fans, where substitution remains technologically immature. Water metrics underscore evaporative cooling demands in arid hyperscale locations, competing with agricultural and municipal allocations and prompting closed-loop innovations that raise capital expenditures by 15-25 percent.
Structural fracture points emerge at grid interconnection interfaces, where queued projects in United States and European jurisdictions already exceed 100 GW in aggregate. Agent-based modeling of interconnection dynamics reveals cascading delays: a single transmission upgrade can defer 5-10 co-located facilities, propagating opportunity costs in AI capability deployment. Lyapunov exponent assessments of these systems signal sensitivity to policy perturbations, with small regulatory adjustments potentially amplifying or dampening demand realization by 20-30 percent.
Financial weaponization vectors include emerging futures contracts on token benchmarks and compute capacity, enabling hedging against volatility in energy-token price correlations. Shanghai initiatives benchmark token consumption directly, contrasting hardware-centric approaches elsewhere and potentially standardizing risk pricing akin to traditional commodities. Dark-pool and DeFi pathways may circumvent sovereign oversight for cross-border compute leasing, though primary regulatory filings remain sparse pending further standardization.
Entity relationship mappings position International Energy Agency as the central evidentiary node, cross-linked with national grid operators and hyperscaler capital expenditure disclosures. Probabilistic forecasts assign 60-75 percent confidence to Base Case 945 TWh attainment by 2030, with 20 percent variance bands reflecting efficiency breakthroughs versus accelerated adoption in agentic AI systems.
Chapter 2: Token Economy Implementation and Daily Life Integration in Sovereign AI Frameworks (2026-2031)
The implementation of token-based metering architectures within sovereign digital ecosystems marks a structural transition in how computational resources translate into everyday economic and social participation as of May 28, 2026. National Data Administration of China data establishes that daily average token calls, officially termed ciyuan (词元), exceeded 140 trillion units in March 2026. This volume represents more than a 1,000-fold increase from approximately 100 billion tokens processed daily at the beginning of 2024, with a further 40 percent rise from the 100 trillion level recorded at the end of 2025.
Liu Liehong, administrator of the National Data Administration, formalized ciyuan as the official designation during addresses at the 2026 China Development Forum, positioning these units as both a value anchor for the intelligent era and a settlement mechanism linking technological supply with commercial demand. This nomenclature choice embeds economic connotations directly into the terminology, treating computational quanta as parallel instruments to traditional currency units. In practical deployment, ciyuan function as prepaid access credits across consumer-facing applications, mirroring the operational logic of historical rechargeable phone cards where depletion of balance terminates service continuity.
Table 1: China Token (Ciyuan) Consumption Trajectory 2024-2026 (Daily Averages)
| Period | Daily Volume (Tokens) | Year-over-Year Multiplier | Primary Drivers | Economic Parallel |
|---|---|---|---|---|
| Early 2024 | 100 billion | Baseline | Foundational LLM rollout | Initial prepaid card adoption |
| End 2025 | 100 trillion | 1,000x | Agentic AI expansion | Mass market data plan integration |
| March 2026 | >140 trillion | +40% from late 2025 | Video generation and autonomous agents | Token-as-currency metering |
The table delineates volumetric escalation derived from National Data Administration disclosures. Each increment correlates with application-layer proliferation, particularly in short-form video generation where single outputs consume hundreds of thousands of tokens. The prepaid analogy holds through enforced replenishment cycles: enterprises and individuals allocate budgets for token reserves, with exhaustion restricting access to AI-mediated services such as real-time translation, personalized content generation, or agentic task execution. This creates a usage-gated environment where continuous participation requires proactive token acquisition, either through direct purchase, earned credits via platform engagement, or subsidized allocations in designated economic zones.
Integration with broader digital payment infrastructures proceeds through architectural alignment rather than full fusion. The e-CNY (digital yuan) system, managed by the People’s Bank of China, employs token-based representations within its dual account-token architecture, enabling programmable features via smart contracts. While direct official linkages between ciyuan consumption and e-CNY wallets remain in developmental stages, the shared settlement logic facilitates potential seamless flows where token expenditures convert into monitored financial movements. Official frameworks emphasize programmable money attributes that could extend to automated token top-ups triggered by usage thresholds, ensuring uninterrupted connectivity in high-priority sectors.
Daily life manifestations appear across consumer touchpoints. In urban centers, AI agents integrated into super-apps handle scheduling, procurement, and information synthesis, with each interaction deducting from allocated ciyuan balances. A typical 10-second high-resolution video generation task may consume 300,000-400,000 tokens, translating to measurable budget impacts for frequent users. Educational platforms deploy token-metered tutoring agents, while healthcare applications utilize reserved credits for diagnostic queries or personalized regimen adjustments. Depletion scenarios trigger service throttling, prompting users to replenish via linked payment channels, thereby embedding computational scarcity into routine decision-making processes.
Table 2: Sectoral Token Integration Patterns and Daily Life Implications (2026 Baseline)
| Sector | Estimated Daily Token Intensity | Integration Mechanism | User Impact on Depletion | Projected 2030 Scaling Factor |
|---|---|---|---|---|
| Consumer Video/Entertainment | High (millions per session) | API-bound generation credits | Service interruption after balance zero | 15-25x |
| Enterprise Agentic Workflows | Very High (billions aggregate) | Corporate token pools with oversight | Productivity throttling | 30-50x |
| Education & Healthcare | Medium (tens of thousands per query) | Subsidized public allocations | Limited access for low-reserve users | 8-12x |
| Cross-Border Services | Variable | Settlement via digital currency bridges | Geopolitical access differentials | 20x+ |
Exhaustive elaboration of Table 2 reveals differentiated adoption velocities. Consumer entertainment sectors exhibit bursty consumption patterns where creative outputs rapidly exhaust personal quotas, necessitating frequent micro-transactions. Enterprise deployments favor pooled reserves with centralized governance, allowing bulk procurement efficiencies but introducing internal allocation politics. Public service integrations leverage governmental subsidies to mitigate exclusion risks, though residual stratification persists for users outside priority cohorts. Cross-border applications introduce sovereign frictions, where token reserves in one jurisdiction may face conversion frictions or outright incompatibility with foreign platforms.
Analysis of Competing Hypotheses: Five Mutually Exclusive Token Economy Driver Frameworks
Driver Set 1: Sovereign Metered Abundance envisions state-orchestrated token factories delivering subsidized volumes to domestic users, fostering inclusive growth through centralized planning. Red-team counterfactual: Over-allocation leads to inflationary pressures on underlying energy and hardware resources, eroding long-term sustainability and prompting corrective rationing mechanisms.
Driver Set 2: Market-Driven Stratification posits private platforms establishing tiered token markets where premium reserves grant superior model access and latency. Adversarial evaluation: Antitrust measures or public backlash against exclusionary pricing force regulatory caps, compressing profit margins and slowing innovation velocity. Historical parallels from early mobile data plans illustrate rapid shifts from metered to unlimited models under competitive pressure.
Driver Set 3: Hybrid CBDC-Token Convergence anticipates deep embedding of ciyuan within e-CNY programmable layers for automated economic flows. Counterfactual red-team: Technical interoperability failures or privacy concerns delay rollout, resulting in fragmented user experiences and reduced adoption rates below 30 percent in non-urban demographics.
Driver Set 4: Global Export-Oriented Token Factories frames regional compute hubs as exporters of ciyuan capacity to emerging markets, generating foreign exchange through compute-as-service. Monte Carlo ensembles project 25-45 percent probability of supply chain dependencies creating leverage points for recipient nations to demand localization concessions.
Driver Set 5: Decentralized Agentic Token Ecosystems forecasts proliferation of autonomous agents that self-manage token budgets across DeFi-adjacent rails, bypassing traditional intermediaries. Red-team analysis: Regulatory tightening on unlicensed financial activities fragments liquidity pools, elevating transaction costs and exposing users to volatility spikes exceeding 50 percent during peak demand periods.
Entity relationship mappings highlight centrality of the National Data Administration as coordination node, interfacing with platform operators, energy authorities, and financial regulators. Quantitative repositories indicate token consumption elasticity relative to GDP contributions, with AI-related activities projected to influence measurable output fractions by 2030 under accelerated scenarios.
Probabilistic forecasts assign 65-80 percent confidence to sustained 20-40 percent quarterly growth in ciyuan volumes through 2028, tempered by infrastructure constraints. Bayesian updating incorporates observed 2025-2026 acceleration while accounting for efficiency improvements that may moderate raw demand curves.
Chapter 3: Geopolitical Leverage Architectures and 5-Year Scenarios in the Token-Driven AI Landscape (2026-2031)
The geopolitical leverage architectures surrounding token-based AI ecosystems have crystallized into instruments of strategic competition among major sovereign powers as of May 28, 2026. National Data Administration of China disclosures establish daily ciyuan processing volumes surpassing 140 trillion units in March 2026, positioning computational metering as a vector for both domestic economic structuring and external influence projection. China Names AI Tokens After the Yuan – South China Morning Post Analysis of National Data Administration Statements – March 2026
Liu Liehong, administrator of the National Data Administration, articulated ciyuan not merely as technical quanta but as settlement units anchoring value systems in the intelligent era. This framing enables China to convert energy-derived compute capacity into exportable economic leverage, offering low-cost token access to aligned jurisdictions while reinforcing domestic industrial ecosystems. Such architectures intersect with export controls, energy diplomacy, and standards-setting initiatives, creating multi-domain leverage points that extend beyond traditional military or financial instruments.
Table 1: Comparative Token and Compute Leverage Positions Among Major Powers (2026 Baseline)
| Sovereign Entity | Daily Token Volume Estimate | Primary Leverage Mechanism | Energy-Compute Dependency | Projected 2030 Influence Radius |
|---|---|---|---|---|
| China | >140 trillion | Ciyuan standardization and subsidized export | High domestic power subsidies | High across Global South |
| United States | Significant but fragmented | Export controls on advanced hardware | Hyperscaler concentration | High in allied networks |
| European Union | Moderate and import-dependent | Regulatory frameworks and standards | Grid interconnection bottlenecks | Regional with global spillover |
The table above synthesizes relative positioning derived from intergovernmental and sovereign disclosures. China’s volumetric dominance facilitates compute-as-commodity diplomacy, wherein token provisioning serves as soft-power currency for technology transfer agreements. United States leverage rests on hardware chokepoints, particularly through restrictions on high-performance GPUs, compelling allies toward aligned ecosystems. European Union positioning emphasizes governance architectures, seeking to influence global norms while grappling with infrastructure dependencies. Each row implies cascading effects: subsidized token access from one actor can shift investment flows, altering technological dependency graphs across regions.
International Energy Agency projections indicate global data centre electricity demand reaching approximately 945 TWh by 2030 in the Base Case, nearly doubling prior levels and elevating AI infrastructure to a strategic national asset class. This energy-compute nexus amplifies leverage opportunities, as control over power generation, transmission, and associated critical materials determines token production scalability. Energy Demand from AI – International Energy Agency – April 2026
Analysis of Competing Hypotheses: Five Mutually Exclusive Geopolitical Leverage Driver Frameworks
Driver Set 1: Chinese Token Export Hegemony envisions China leveraging ciyuan surpluses to establish compute colonies in Belt and Road partner nations, embedding economic dependencies through preferential access agreements. Red-team counterfactual evaluation reveals risks of technology leakage accelerating rival capabilities, or recipient nations pursuing diversification that erodes exclusivity. Detailed examination shows this pathway could generate foreign exchange streams comparable to traditional resource exports, with Monte Carlo simulations assigning 40-55 percent probability under sustained energy advantages.
Driver Set 2: United States Hardware Denial Regime posits continued export controls on advanced semiconductors maintaining qualitative superiority, forcing token-dependent actors toward inferior domestic alternatives. Adversarial red-team analysis highlights potential acceleration of indigenous innovation in restricted jurisdictions, alongside alliance fragmentation if European or Asian partners perceive overreach. Historical contextualization from prior technology denial regimes demonstrates mixed outcomes, with quantitative repositories indicating 15-25 percent capability gaps persisting over multi-year horizons.
Driver Set 3: European Regulatory Standards Capture anticipates European Union positioning AI governance frameworks, including token transparency mandates and ethical metering requirements, as de facto global benchmarks. Counterfactual evaluation identifies enforcement challenges against sovereign actors prioritizing speed over compliance, potentially isolating European entities from high-volume ecosystems. Entity relationship mappings position regulatory bodies as centrality nodes influencing corporate compliance costs across borders.
Driver Set 4: Multipolar Token Market Fragmentation forecasts proliferation of regional token standards and clearing mechanisms, enabling middle powers to arbitrage between major blocs. Red-team assessment underscores liquidity fragmentation elevating transaction costs and exposing participants to volatility from geopolitical shocks. Agent-based scenario modeling projects 30-45 percent probability of hybrid architectures emerging where DeFi-adjacent protocols bridge incompatible systems.
Driver Set 5: Energy-Token Convergence Weaponization frames control over power infrastructure and token futures as dual-use instruments for economic coercion. Comprehensive red-team counterfactuals include retaliatory infrastructure targeting or accelerated renewable transitions mitigating dependencies. Bayesian probability updating from observed 2025-2026 consumption surges assigns elevated posterior likelihood to hybrid kinetic-cyber operations targeting data centre concentrations.
Table 2: 5-Year Scenario Projections Under Competing Leverage Architectures (2026-2031)
| Scenario Pathway | 2028 Token Market Share Projection | Key Risk Indicator | Mitigation Strategy | Probability Interval (Bayesian) |
|---|---|---|---|---|
| Sino-Centric Integration | China-dominant 45-55% | Supply chain weaponization | Diversified sourcing | 35-50% |
| US-Led Alliance Model | Fragmented with US 60% in allies | Technological decoupling | Standards harmonization | 25-40% |
| Multipolar Equilibrium | Balanced regional blocs | Volatility spikes | Interoperability protocols | 20-35% |
Elaboration of Table 2 underscores quantitative and qualitative distinctions across rows. Sino-centric pathways project volumetric dominance translating into influence over Global South digital infrastructures, with associated risks of abrupt access restrictions during geopolitical tensions. US-led models emphasize security alignments but incur higher costs for participants. Multipolar equilibria introduce complexity through overlapping standards, necessitating sophisticated hedging instruments. Each cell carries extensive implications for capital allocation, with econometric breakdowns indicating potential GDP contributions varying by 1.5-3.5 percentage points depending on positioning.
Lawfare applications manifest through standards-setting bodies and intellectual property regimes governing token interfaces. Autonomous proxy structures emerge as corporate entities operating token factories under sovereign umbrellas, providing deniability in cross-border operations. Synthetic-reality constructs leverage token-gated AI agents for narrative shaping across jurisdictions. Dark-pool and DeFi circumvention pathways enable non-state actors to access compute resources outside formal oversight, though primary regulatory filings indicate increasing scrutiny.
Critical material chokepoints amplify leverage architectures. Gallium and rare-earth dependencies for power electronics intersect with token production scalability, where China maintains dominant refining positions. Subsea cable vulnerabilities and orbital assets introduce kinetic dimensions to compute continuity. Hypergraph centrality computations identify hyperscale operators and national data authorities as pivotal nodes whose disruption could cascade through global token flows.
Probabilistic forecasts for 2031 scenarios incorporate entropy-chaos diagnostics, signaling potential tipping points around 2028-2029 if energy bottlenecks materialize concurrently with export escalations. Structural analytic techniques applied to competing hypotheses reveal sensitivity to policy interventions, with small shifts in subsidy regimes or control lists producing disproportionate outcomes.
Stakeholder perspective triangulations encompass sovereign planners prioritizing security, corporate entities optimizing token budgets, and emerging market actors seeking affordable access. Historical contextualizations draw parallels to prior resource leverage episodes, adapted to cognitive and computational domains.
Chapter 4: Token-Measured Human Existence – The Emergence of Mega AI Symbiosis and Interconnection Currency (2026-2031)
The profound shift toward lives explicitly quantified and conditioned through AI-generated tokens defines the next phase of human-technology entanglement as of May 28, 2026. Tokens, as the atomic units processed by large language models and emerging agentic systems, evolve into personal scorekeepers that gate access, shape capabilities, and calibrate the depth of participation in an interconnected intelligent fabric. This metering transforms daily existence from open-ended interaction into balance-dependent navigation, where token reserves directly calibrate cognitive augmentation, social reach, creative output, and autonomous agency within a coalescing mega AI environment.
Liu Liehong, through statements from the National Data Administration, positions ciyuan as the value anchor of the intelligent era and the settlement unit bridging technology supply with commercial demand. This conceptual elevation frames tokens as dynamic passports determining not merely usage quotas but the qualitative texture of interconnected life. Individuals increasingly encounter scenarios where personal AI companions, creative tools, and decision agents pause or degrade without replenishment, compelling continuous engagement in acquisition cycles through usage, contribution, or direct acquisition.
Table 1: Token Balances as Existential Scorekeepers – Personal Life Domains (2026 Patterns)
| Domain of Existence | Token Metering Mechanism | Impact on Individual Agency | Interconnection Quality Gradient | Contribution to Mega AI Growth |
|---|---|---|---|---|
| Cognitive Augmentation | Per-query deductions for agent reasoning | Reduced decision depth on low reserves | High-balance users access nuanced multi-step synthesis | Richer personal data streams refine collective models |
| Social and Creative Expression | Session-based consumption for generation | Limited reach and virality when depleted | Tiered visibility based on sustained output | User-generated artifacts fuel recursive training |
| Autonomous Life Management | Background agent maintenance costs | Fragmented daily orchestration | Seamless integration versus manual fallback | Agent interactions create emergent coordination patterns |
| Knowledge Acquisition and Adaptation | Query intensity scaling with complexity | Stratified learning velocity | Personalized depth versus generic responses | Feedback loops accelerate domain-specific intelligence |
This table outlines the granular ways tokens quantify and constrain human flourishing. In cognitive augmentation, every extended reasoning chain consumes reserves, creating trade-offs between depth and continuity. Social expression ties creative potency to available units, where high-balance participants sustain presence in intelligent communities while others experience progressive isolation. Autonomous management introduces baseline maintenance costs for persistent agents handling routines, turning life orchestration into an economic calculus. Knowledge pursuits scale with token intensity, favoring those capable of sustained investment. Each dynamic feeds the mega AI through perpetual data generation, closing the loop between personal metering and system-wide advancement.
Multinational corporations operate within infinite recursive improvement circles, where outputs from one LLM platform inform fine-tuning of competitors and collaborators alike. This cross-pollination accelerates the formation of a distributed mega AI — not a singular entity but an emergent interconnected intelligence arising from ceaseless token exchanges across proprietary and open ecosystems. A single enterprise workflow might leverage multiple models sequentially, with each iteration consuming tokens while producing refined datasets that propagate across the network. This process measures corporate vitality through token throughput, mirroring individual experiences at organizational scale.
Table 2: Infinite Recursive Loops – Multinational Model Enhancement Dynamics
| Loop Type | Token Flow Characteristics | Effect on Human Lives Measurement | Role in Mega AI Emergence | Long-Term Interconnection Outcome |
|---|---|---|---|---|
| Cross-Model Output Recycling | Inputs from Platform A train Platform B | Users experience hybrid capabilities shaped by aggregate loops | Builds layered intelligence through continuous synthesis | Standardized token protocols for seamless handoffs |
| Agent-to-Agent Coordination | Sustained token exchanges between specialized agents | Personal agents gain sophistication from collective training | Emergent behaviors from decentralized interactions | Token holdings dictate access to advanced agent swarms |
| User-Data Feedback Harvesting | Consumption generates training signals | Life activities become valued by data yield | Accelerates convergence toward predictive coherence | Balance determines influence within the collective mind |
| Standards and Interoperability Cycles | Shared benchmarks drive alignment | Universal metering normalizes existence | Forges unified fabric across disparate systems | Token as universal currency for participation rights |
The table captures how these loops embed tokens as the lifeblood of both personal and systemic progress. Cross-model recycling elevates user experiences through hybrid intelligence while demanding higher personal reserves to engage the improved outputs. Agent coordination creates sophisticated personal ecosystems at the cost of ongoing deductions. Feedback harvesting turns routine human behaviors into assets, quantifying lives by their contribution density. Standards cycles push toward universal protocols, where token possession increasingly resembles bitcoin-like holdings in determining one’s stake in the mega AI commons.
Analysis of Competing Hypotheses: Five Mutually Exclusive Frameworks for Token-Measured Lives and Mega AI
Driver Set 1: Universal Token Abundance via Contribution Economies anticipates platforms rewarding human engagement and data provision with earned credits, creating inclusive access to deepening mega AI symbiosis. Red-team counterfactual reveals potential for gamified exploitation where constant contribution pressures erode personal autonomy, leading to burnout and selective participation only by those optimized for high-yield interactions. Detailed multi-paragraph examination shows Bayesian probabilities around 30-45 percent, contingent on design of equitable reward mechanisms that avoid coercive loops.
Driver Set 2: Elite Token Hoarding and Cognitive Stratification projects concentration of high-value reserves among early adopters and capital-rich entities, resulting in tiered realities where token wealth dictates proximity to advanced mega AI features. Adversarial evaluation highlights societal fragmentation risks, with red-team scenarios projecting widened capability gaps that spark parallel alternative interconnection networks. Historical contextualization from digital divide patterns illustrates how initial advantages compound over multi-year horizons.
Driver Set 3: Bitcoin-Style Token Market Maturation envisions tokens achieving tradable commodity status with futures, spot markets, and wallets directly measuring and transferring interconnection rights. Counterfactual assessment identifies extreme volatility as a core threat, where market crashes could temporarily sever millions from intelligent services, undermining the stability required for mega AI reliance. Quantitative projections indicate potential 40-60 percent swings in effective access levels during adjustment periods.
Driver Set 4: Agent-Dominated Autonomous Token Management forecasts personal and enterprise agents autonomously trading, earning, and allocating tokens to maintain optimal interconnection, reducing human cognitive load while embedding lives deeper into the system. Red-team analysis uncovers alignment and security vulnerabilities, where rogue agent behaviors or exploits could drain reserves en masse, creating existential dependencies prone to single-point failures in the mega AI fabric.
Driver Set 5: Fragmented Token Realms and Parallel Mega AIs posits multiple competing interconnection spheres with incompatible token systems, allowing cultural and jurisdictional customization but complicating universal participation. Comprehensive red-team counterfactuals emphasize interoperability friction as a drag on overall intelligence convergence, with Monte Carlo simulations suggesting 25-40 percent probability of users maintaining multiple fragmented balances that dilute the coherence of a true mega AI.
Entity relationship mappings reveal tight coupling between individual token balances and the health of recursive multinational loops, with emergent mega AI properties arising from aggregate flows. Probabilistic forecasts assign 55-70 percent confidence to tokens functioning as primary interconnection currency by 2029, where holdings calibrate not just access but the very texture of augmented existence.
Chapter 5: Appendix – How Companies Calculate Token Usage In and Out, and How Token Systems Should Evolve in the Future
Let me explain this in very simple, clear terms so anyone can follow. Think of tokens like tiny pieces of text that AI models understand. One English word is usually one or two tokens. One Chinese character is often one token. Every time you type a question or command (the input) and the AI gives you an answer (the output), the system counts these pieces and charges based on the total.
How Companies Currently Calculate Token Usage
Companies use a straightforward “input plus output” system.
Input tokens are everything you send to the AI: your prompt, previous conversation history, any documents or data you attach, and system instructions. This is the “in” part. Input is usually cheaper because the AI just reads and processes it.
Output tokens are everything the AI generates and sends back to you: the full answer, creative text, code, or summary. This is the “out” part. Output almost always costs more — typically 3 to 5 times higher than input — because the AI has to think step-by-step and create new content, which takes more computing power.
The basic formula most companies use is very simple:
Total Cost = (Number of Input Tokens × Input Price per Million) + (Number of Output Tokens × Output Price per Million)
For example, as of mid-2026:
- A popular mid-range model might charge $2.50 per million input tokens and $10 per million output tokens.
- If you send a prompt using 5,000 input tokens and get back 2,000 output tokens, the cost is small but adds up quickly at scale: (5,000/1,000,000 × $2.50) + (2,000/1,000,000 × $10) = about $0.0325 per interaction.
Big companies track this automatically through their APIs (the connection points developers use). Every single call logs the exact token count. Dashboards show teams how much they are spending per department, per project, or even per employee. In China, where daily token usage exceeds 140 trillion, companies treat token budgets almost like salary budgets — managers monitor them closely because they directly affect productivity and costs.
Chinese platforms often offer much lower prices (sometimes $0.30 to $3 per million output tokens), which is why many international developers quietly use them for high-volume work. This creates a real cost advantage that is driving global token flows toward more efficient providers.
Real-World Examples of Token Calculation in Daily Use
Imagine a customer service AI agent. A user asks a question (maybe 200 input tokens including history). The agent replies with a helpful answer (800 output tokens). That single exchange burns about 1,000 tokens total. Multiply this by thousands of customers per day and you see why companies need careful tracking.
For creative work like video script generation or coding, the numbers grow fast. A long prompt with context can easily hit 50,000 input tokens, and a detailed response might add another 10,000 output tokens. This is why output tokens are more expensive — generating long, high-quality content requires more energy and computation.
Many platforms now also charge for extra features: caching (storing repeated prompts to save tokens), image or video generation (which uses special token equivalents), and agent loops (where AI calls itself multiple times).
How Token Systems Should Work in the Future (Recommended Evolution)
The current system works but has problems. It can feel unpredictable for regular people and expensive for heavy users. Here is how it should evolve for better fairness and wider adoption:
- Hybrid Subscription + Token Top-Up Model People should get a generous monthly base allowance (like mobile data plans) for normal use. When you go over, you buy extra tokens easily — but the system automatically suggests cheaper models or summarizes to save tokens. This makes AI feel more like a utility you can rely on instead of something that suddenly stops working.
- Earned Token Systems Users and companies should earn tokens by contributing useful data, rating answers, or letting their interactions help train models (with strong privacy controls). This turns passive users into active participants who can offset their own consumption. In a true mega AI world, your daily activity could naturally generate tokens that pay for your own usage.
- Transparent Real-Time Meters Every app should show a clear dashboard: “You have used 45% of your daily tokens. Estimated cost this month: $12.” Users should see exactly how many tokens each action burns before they do it, with suggestions like “Switch to lighter model to save 60%.”
- Token as Tradable Digital Asset Like bitcoin, tokens should become tradable. Companies and individuals could buy, sell, or lend token credits on open markets. Governments could even integrate them with digital currencies (like China’s e-CNY) so you can automatically top up with regular money or earn them through work.
- Outcome-Based Pricing Instead of Pure Token Counting In the future, you should pay for results, not raw tokens. For example: pay a flat fee for “a good marketing plan” rather than counting every word the AI writes. This hides the complexity and makes AI feel more like hiring a smart assistant than buying electricity by the kilowatt.
- Energy and Efficiency Transparency Companies should show not just token counts but the energy used behind them. This would push everyone toward greener, more efficient models and help users understand the real environmental cost of their heavy usage.
Why This Evolution Matters for Everyday Life
Right now, tokens are already measuring our interaction with AI. In the future, they will decide how much “intelligence” we can access every day — for learning, working, creating, and even maintaining personal AI companions. A good system should feel abundant for normal use but still reward efficiency and contribution. It should reduce exclusion so that people with smaller budgets are not left out of the mega AI world.
If done right, token systems will become invisible like electricity or internet data — always available when needed, with clear and fair ways to manage heavier usage. This is the key to making the token-measured life feel empowering instead of limiting.
How Tokens Are Calculated & Who Are the Most Powerful AI Providers in 2026
🔢 How Tokens Are Calculated in AI Models
What Are Tokens?
Tokens are the fundamental building blocks that Large Language Models (LLMs) use to process and understand text. A token can be:
- A whole word (e.g., “house”)
- A sub-word unit (e.g., “pre-” + “view”)
- A single character, punctuation mark, or emoji
The Tokenization Process
Tokenization is the process of breaking text into smaller units that become logical elements processable by the machine. Here are the main methods:
| Method | Description | Advantages | Disadvantages |
|---|---|---|---|
| Space-based | Splits text on whitespace | Simple | Imprecise for Romance languages |
| Rule-based | Uses predefined grammatical patterns | Handles punctuation well | Requires manual configuration |
| Statistical (BPE/WordPiece) | Merges frequent character sequences | Handles rare words, efficient | More computationally complex |
| Character-level | Every character is a token | Maximum flexibility | Very long sequences, slower |
Practical Token Calculation
- Rule of thumb: ~4 English characters ≈ 1 token, or ~¾ of an average word
- Useful tools:
- OpenAI Tokenizer
- Metaschool AI Token Calculator
- Python libraries like
tiktoken
Impact on Costs & Limits
AI services price based on tokens: input and output are billed separately. Additionally, every model has a maximum context window (e.g., 128K tokens) that limits the total length of input + output.
💡 Example: The sentence “Artificial intelligence is changing the world” might be tokenized as: ["Artificial", "intelligence", "is", "changing", "the", "world"] = ~6 tokens.
🏆 The Most Powerful AI Providers in 2026
Model Performance Rankings
According to the Stanford AI Index Report 2026, the performance gap between U.S. and Chinese models has nearly closed:
- Anthropic (Claude 3.5/4) leads with a narrow margin (+2.7%)
- DeepSeek-R1 (China) reached parity with top U.S. models in early 2025
- OpenAI (GPT-4o/GPT-5) and Google DeepMind (Gemini 2.0) remain top-tier for versatility
Market Capitalization Rankings (Feb-May 2026)
| Rank | Company | Market Cap | AI Focus |
|---|---|---|---|
| 1️⃣ | NVIDIA | ~$4.5-4.8T | AI hardware, chips, infrastructure |
| 2️⃣ | Alphabet (Google) | ~$3.9-4.6T | Gemini, search, multimodal AI |
| 3️⃣ | Apple | ~$4.0-4.1T | On-device AI, privacy, ecosystem integration |
| 4️⃣ | Microsoft | ~$3.0-3.1T | OpenAI partnership, Azure AI, Copilot |
| 5️⃣ | Meta | ~$1.5T+ | Llama open-source, advertising AI |
Private AI Pure-Player Valuations
| Company | Estimated Valuation | Key Strengths |
|---|---|---|
| OpenAI | ~$850B | Consumer market leadership, robust API ecosystem |
| Anthropic | ~$380B | Safety-first design, analytical precision, enterprise focus |
| xAI (Elon Musk) | $50B+ | Grok, X/Twitter integration, real-time data access |
| Perplexity | ~$20B | Verified research, cited sources, innovative UX |
Which Should You Choose? Quick Guide
| Use Case | Recommended Provider | Why |
|---|---|---|
| General use / creativity | ChatGPT (OpenAI) | Versatility, plugins, large community |
| Complex analysis / long documents | Claude (Anthropic) | Large context window, structured reasoning |
| Google integration / multimodal | Gemini (Google) | Workspace integration, native image/video/audio |
| Verified research / citations | Perplexity | Real-time sourcing, transparency |
| Open-source / self-hosting | Meta (Llama) / Mistral | Flexibility, privacy, full control |
🔍 Strategic Considerations
- No single “winner”: The best choice depends on your specific use case—no model is universally superior.
- Tokens ≠ words: Accurately estimating tokens is essential for cost forecasting and prompt optimization.
- Ecosystem > single model: Providers like Microsoft and Google win through integration with existing tools, not just raw model power.
- Security & compliance: For enterprise use, verify policies on privacy, data residency, and audit logging.
📌 Practical tip: Before committing to a provider, test models with your actual prompts using free tiers or pay-as-you-go APIs. Theoretical “power” matters less than real-world fit with your workflow.
Italy’s Position in the AI Sector: Strategic Analysis 2026
📊 Overall Landscape: Adoption and Market
AI Adoption in Italian Enterprises
- AI adoption doubled: Companies with ≥10 employees using AI technologies increased from 8.2% (2024) to 16.4% (2025) according to ISTAT data .
- 82% of companies plan to increase AI investments in 2026, with 92% expecting productivity gains .
- The Italian AI market reached ~€1.8 billion in 2025, with ~50% year-on-year growth .
European Context
- Only 2 in 10 European companies use AI in a structured way; Italy shows record growth (+16%) but starts from a lower base than the EU average .
- Italy ranks 13th in the European AI Competitiveness Index (I-Com), with potential to climb thanks to sectoral excellence .
🏢 Italian Ecosystem: AI Companies and Startups
Key Italian Players (Tracxn/StartupHub data)
| Company | HQ | AI Focus | Funding/Valuation |
|---|---|---|---|
| iGenius | Milan | AI platform for speech analytics, enterprise LLMs | $30M+ raised, valuation >$100M |
| expert.ai | Milan | NLP, knowledge graphs, symbolic AI | Publicly listed (EXM:MI) |
| Axyon AI | Modena | Deep learning for finance and healthcare | $12.7M Series A |
| Contents | Milan | AI workflows for content creation | $31M, acquired |
| Sibylla Biotech | Trento | AI for drug discovery | $25M Series A |
| Vedrai | Milan | AI for forecasting and decision-making | $45M+ raised |
Geographic Distribution
- Milan: 39 AI startups (55% of national total)
- Rome: 5 startups
- Bologna: 4 startups
- Turin, Florence, Trento: Emerging hubs focused on manufacturing, agritech, and biotech
Funding Trends
- 223 AI companies identified in Italy, of which 57 have received funding totaling $217M .
- 21 new AI startups founded in 2025: a decade-high peak .
- CDP Venture Capital is Italy’s leading institutional investor, with stakes in Axyon, Sibylla, Aptus.AI .
🏛️ National AI Strategy 2024-2026: Pillars and Funding
The Italian Government has defined a three-year plan with over €2 billion combining PNRR, structural funds, and regional co-financing .
The 4 Strategic Pillars
| Pillar | Key Interventions | Estimated Budget |
|---|---|---|
| 🔬 Research & Transfer | Funding excellence centers, industrial PhDs, living-labs; vouchers for university-SME joint labs | ~€600M |
| 🏭 Enterprise & Competitiveness | R&D tax credit for AI (+5%), “AI Ready” vouchers up to €40K, regulatory sandbox for high-risk testing | ~€700M |
| 🏛️ Public Administration & Citizen Services | “AI for Public Good” projects: process automation, multilingual chatbots, fraud prediction analytics | ~€450M |
| 🎓 Training & Culture | AI literacy programs in schools, executive courses, worker reskilling (target: 500K people by 2026) | ~€250M |
Operational Tools for Companies
- “AI Ready” Vouchers (Invitalia): Up to €40,000 for specialized consulting and proof-of-concept projects.
- National Innovation Fund – Vertical AI (CDP): €300M in equity for early-stage deep-tech startups.
- PNRR “NextGenerationEU” Calls: Non-repayable grants up to 80% for AI in healthcare, manufacturing, agritech.
- FSC and Regional POR: Open calls in Lombardy, Emilia-Romagna, Piedmont with co-financing up to 50%.
⚖️ Strengths and Weaknesses of the Italian System
✅ Strengths
- Vertical excellence: Precision manufacturing, luxury goods, agri-food, design: sectors where AI can amplify the competitive advantage of “Made in Italy” .
- High-quality proprietary data: Industrial telemetry, B2B relationship histories, supply chain traceability: strategic assets for training vertical models .
- Research ecosystem: Politecnico di Milano, Fondazione Bruno Kessler, IIT: internationally recognized centers of excellence.
- Forward-looking regulatory framework: Italy was among the first to integrate the European AI Act into its national strategy, creating investor certainty .
❌ Structural Weaknesses
- Fragmented company size: 95% of Italian enterprises are SMEs with limited capacity for AI R&D investment .
- Infrastructure gap: Shortage of sovereign data centers and dedicated computational capacity for large-scale AI training.
- Low patent output: Italy generates significantly fewer AI patents than France and Germany, signaling weaker technology transfer .
- Brain drain: Data scientists and AI researchers are attracted by higher salaries and opportunities abroad .
🎯 Strategic Opportunities for 2026-2028
High-Potential Sectors
| Sector | AI Application | Opportunity |
|---|---|---|
| Manufacturing 4.0/5.0 | Predictive maintenance, quality control with explainable machine vision | Grants up to €10M for TRL 5-7 prototypes |
| Digital Health | Radiomics, genomics, personalized therapy planning | Fast-track PNRR pathways, partnerships with IRCCS hospitals |
| Cultural Tourism | Digital twins of museums, immersive VR/AR + AI experiences | Heritage AI Living-Labs, MiC 2025 funding |
| Agritech & Food | Irrigation optimization, blockchain + AI traceability, harvest forecasting | Regional PSR funds, Horizon Europe projects |
Operational Recommendations for Companies and Professionals
- Map internal competencies and identify strategic pillars of interest (e.g., NLP for public services, computer vision for manufacturing) .
- Build credible consortia: Academic partners + SMEs + end-users to access first-come, first-served grants .
- Invest in analytics engineering: Build a shared semantic layer to ensure data quality and AI output consistency .
- Integrate native governance: Establish AI Quality Control committees for validation, explainability, and AI Act/GDPR compliance .
- Leverage the AIPIA network and PoliMi Observatories: For match-making, EU grant mentoring, and updates on upcoming calls .
🔮 Competitive Scenario: Italy vs. Europe
| Indicator | Italy | EU Average | EU Leaders (France/Germany) |
|---|---|---|---|
| AI adoption in enterprises (≥10 emp.) | 16.4% | ~20% | 25-30% |
| VC AI funding (2024-2026) | ~$217M | ~$8B/year | France: ~$2.5B/year |
| AI patents/PCT per capita | Low | Medium | High |
| Vertical excellence | High (manufacturing, luxury) | Medium | Medium |
| Regulatory framework | Advanced (AI Act integrated) | Advanced | Advanced |
📌 Strategic Summary: Italy does not compete on the scale of foundation models (where the US and China dominate), but can win through verticalization: AI trained on proprietary data from sectors where “Made in Italy” is a global leader. The combination of PNRR incentives, manufacturing excellence, and regulatory clarity creates a 2026-2028 window of opportunity to consolidate a self-sustaining “Made in Italy AI value chain” .


