


 Extract (6-MSITC) in Healthy Older Adults")
: An In-Depth Exploration into its Thermogenic Role and Social Significance")


Water and energy are closely linked, as current electricity generation methods often require water, and extracting water typically consumes energy.
This connection between water and energy, also known as the “water-energy nexus,” has been the focus of several scientific studies.
Among other things, achieving water and energy security worldwide entails finding sustainable ways of connecting research related to the water demand of power plants with mitigation strategies for energy-based water use.
Ultimately, studies that jointly investigate these two important factors could pave the way toward new solutions that ensure a more sustainable use of both water and energy.
With this in mind, a team of researchers at LUT University in Finland has recently investigated water use in thermal power plants, trying to project future scenarios for water use reduction in light of the ongoing shift toward a greener economy.
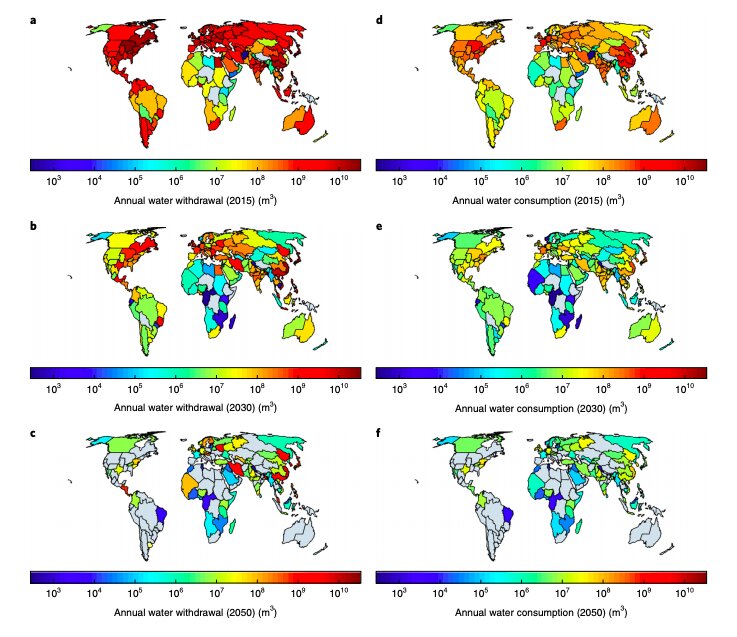
In their study, featured in Nature Energy, they assessed the water footprint of a large number of thermal power plants worldwide and estimated the current water demand for power production at four different levels: globally, regionally, by country and by river.
“We linked a total of 13,863 thermal power plants with a total active capacity of 4,182 GW worldwide, which corresponds to 95.8 percent of the global thermal power plant fleet, to water bodies using the method of geographic information system (GIS) analysis, then estimated the water footprint of each of them,” Alena Lohrmann, first author of the study, told Tech Xplore.
Recent research has suggested that a radical shift toward renewable energy is both technically and economically feasible.
Nonetheless, whether this shift will actually take place or at what pace it will unfold is still somewhat unclear.
Essentially, Lohrmann and her colleagues wanted to carry out realistic estimations for the development of water demand that could provide valuable and reliable insight about possible future water use reduction scenarios.
To achieve this, the researchers first identified the cooling technology employed at individual power plants. Subsequently, they carried out an in-depth analysis to determine seawater and freshwater demand of global thermal power plants.
The data used in their analyses was taken mainly from the GlobalData dataset, which contains information about several thousands of thermal power plants worldwide.
To overcome the data limitations of the dataset, the cooling technology of each power plant was identified using satellite imagery.
“Our study also presents an impact analysis for 354 major rivers globally carried out in a high temporal and spatial resolution,” Lohrmann said.
“This river analysis is of high relevance since thermal power plants mainly affect local aquatic ecosystems due to thermal pollution and increased water discharge.”
After estimating the global water demand, the researchers created a ‘best policies scenario’ (BPS) model using a modeling tool developed at LUT University, called LUT Energy System Transition model. Using this tool, they successfully identified the most affordable scenario for shifting toward 100 percent renewable electricity by 2050, thus meeting global sustainability targets.
“Our study provides the assessment of the potential water use reduction in global thermal power plants from 2015 (base year) to 2050,” Christian Breyer, head of the team who carried out the study.
“We showed that the transition toward a 100 percent renewable electricity system might reduce global water consumption of thermal power plants by 97.7 percent.”
The study carried out by Lohrmann, Breyer and their colleagues offers an interesting new perspective on how industries and governments worldwide could encourage a lower water use in power generation.
In addition to highlighting the feasibility of moving toward significantly more sustainable solutions, their work identifies a cost-effective strategy that could help to tackle the issue of water depletion associated with the use of water to create electrical energy.
Water and energy systems are inextricably interdependent. The water sector is a major consumer of energy for purposes such as water treatment, pumping and desalination. Similarly, water is essential for cooling power plants, electricity generation and bio-fuel production, as well as in the extraction, mining, processing, refining and disposal of fossil-fuel residues. 44% of total global water withdrawals are used for energy production, a dominant share of which is cooling water in thermoelectric electricity generation (Collins et al., 2009).
Energy and water are both limited resources that are essential for the fundamental services, including food production, required by a rapidly growing global population that is projected to reach 9.7 billion in 2050 (United Nations, 2017).
As a result, it is increasingly critical to manage the nexus between energy and water properly (Kurian, 2017) in the broader context of dependent socio-economic sectors, including the wider water–energy–food nexus (Griggs et al., 2013; Howells and Rogner, 2014; United Nations General Assembly, 2015).
Moreover, proper water-energy management is especially crucial in light of the fact that electricity and fuel production relies on an estimated 90% of non-sustainable water sources (WWAP, 2014), as well as the increasing demands for water, energy and food driven by, among others, the growth in population and economies (Hoekstra et al., 2012).
Over the last decade or so, analyzing issues within or related to the water–energy nexus has become increasingly important for both the scientific and policy-making communities (Dai et al., 2018; Miralles-Wilhelm, 2016).
Likewise, the capacity to assess water and energy interlinkages at an increasingly higher resolution has also improved accordingly.
Analyses of the water–energy nexus span a broad range of spatial levels, from the local (e.g. plant or city) (Chen and Chen, 2016) to the regional or national (Kibaroglu and Gürsoy, 2015; Mayor et al., 2015). Meanwhile temporalities range from multi-decadal (including climate change) (Mekonnen et al., 2016; Voisin et al., 2013) down to days or hours (or even lower) for operational applications (Castronuovo and Lopes, 2004).
A comprehensive review of methods and tools for macro-assessments of the water–energy nexus has recently been carried out by (Dai et al., 2018). From this analysis it is evident that, while a wide range of new methods and frameworks for comprehensively assessing interactions between water, energy and other elements have been developed, in general the availability of tools for nexus analyses that are at the same time integrative and multi-level is still poor (Daher and Mohtar, 2015; Howells et al., 2013).
Instead, methodologies used for analyzing the water–energy nexus tend to be characterized by specific levels and data requirements (Liu et al., 2017), ranging from purely qualitative assessments to highly data-intensive model-based approaches (Granit et al., 2013). The review also found that none of the studies and methods considered provide a ‘singular framework’ for performing nexus studies.
The challenges of data availability at relevant spatio-temporal levels for analyzing the water–energy nexus, for example, on water use by energy systems and vice versa, is well documented (Chini and Stillwell, 2017; IRENA, 2015; Larsen et al., 2016).
While in general water and energy systems can be considered to be well-monitored and managed (developing countries excluded), the availability of integrated data sets covering both domains is often severely limited at the relevant levels of aggregation in relation to nexus calculations, that is, beyond the site-specific level.
Further, such data may be incomplete and inconsistent due, for example, to differences in the inherent conditions for the collection of data on water use by the energy sector between countries and regions, which can constrain the applicability and comparability of estimated water uses. For example, records from the US, while otherwise of good quality, have significant gaps concerning water-intensive energy technologies like nuclear (Macknick et al., 2012).
Conversely, dependencies between water and energy systems, that is, water consumption or withdrawals related to specific energy technologies, may be expressed in terms of representative volumes of water use per unit (e.g. L/MWh) of electricity or fuel produced (Basheer and Elagib, 2018; Gleick, 1994; Inhaber, 2004; Macknick et al., 2012).
This approach introduces a significant source of uncertainty arising from the (lack of) accuracy, but it also enables quantitative nexus calculations to be made at different levels and is frequently used by integrated assessment models.
In light of the poor data on water usage within the energy sector, as highlighted above, this paper addresses the extent to which reported estimates of water usage in electricity production provide an accurate ‘bridge’ when modelling the interdependencies between water and energy systems.
Thus, many initiatives, like the Platform for Regional Integrated Modelling and Analysis (PRIMA) (Kraucunas et al., 2015), as well as the ETSAP-TIAM community (Føyn et al., 2011), aim at developing flexible multi-scale tools for analyzing the water–energy nexus in order to satisfy users’ increasing demands by linking existing model components with new ones that use such an approach.
In this context, the present study may be seen as an attempt to identify and validate a suitable set of parameters.
To estimate water usage, multiple literature estimates of water withdrawal and consumption rates for electricity production technologies are collected in conjunction with the distribution of individual power plants and their corresponding technologies in order to calculate the country-level EU28 yearly water usages for 1980–2015, followed by a validation against reported numbers (Eurostat, 2018).
The analysis is relevant because it highlights the best possible estimates of water usage within electricity production at coarser scales using freely available sources, albeit at coarse spatio-temporal resolutions (country/yearly).
Thus, despite a certain resemblance between estimates and reported values, the paper also aims to show that the currently available data on energy-sector water usage is very inadequate, not least, in their detail and availability.
Despite the current focus on providing open-access environmental data of increasing quality, data on the water–energy nexus are still limited in their availability. One aim of this paper is therefore to convey this information to users mainly in the academic community but also to politicians in light of the current tendency towards more open and available data.
Results
In the following the results of reconstructing levels of the withdrawal and consumption of freshwater from the energy sector in EU28 are compared with reported withdrawal data from Eurostat (Eurostat, 2018).
As discussed above power plants and their associated energy production (in TWh) in Europe, based on the available EU28 level information for the period from 1980 to 2015, are initially characterized, followed by estimates of corresponding water usages using the median, minimum and maximum factors from Fig. 1, Fig. 2 (EW1980–2015 and EC1980–2015).
For 2015, for which more detailed information is available, an improved country-level analysis is carried out (EW2015 and EC2015).
Fig. 1, Fig. 2 depict all the 896 median, min and max data points on electricity production water withdrawal and consumption which have been extracted in literature as a basis for this study (although a few are not visible within the selected Y-axis limits). See also Appendix A Median water withdrawals. Table form of median values in, Appendix B Median water consumption. Table form of median values in.
A total of 56 technologies are listed based on eleven energy sources (gas is seperated between non-CCGT and CCGT for better visual overview).
The span in levels from literature varies depending on energy source and technology but there is a tendency for the dominant combinations such as coal, gas and nuclear using tower and once-through cooling (see also Fig. 3, Fig. 4) to have more consistent estimates. A tendency for the withdrawal estimates to be more similar than the corresponding consumption estimates is also seen.
A reasonable level of agreement between RW and EW is seen (Fig. 3) using the median factors at the aggregated spatio-temporal levels used here. It is evident that conventional energy sources such as nuclear, coal and gas, which require excessive amounts of cooling water, clearly dominate the picture, whereas renewable (and less water-intensive) energy sources are essentially negligible.
Results based on the more detailed country-level plant data from 2015 (indicated by a star), on the other hand, seems to slightly underestimate actual water use by the total European energy system. Furthermore, it is evident that the span between the minimum and maximum estimates is substantial (Fig. 3; insert).

Fig. 4. Main figure: estimated freshwater consumption (EC1980–2015) per energy source and the sum of estimated freshwater consumption per country (EC2015) (arrow). Energy sources correspond to legend in Fig. 3. Insert: EC1980–2015 calculated based on minimum and maximum water usage levels for each energy source and cooling technology.
In the case of EC (Fig. 4), select renewables such as geothermal and biomass are found to play a significant role here compared to RW/EW, and EC2015 is estimated at a higher level than EC1980–2015. As seen in the insert (Fig. 4), a large span is seen between the maximum and minimum values As compared to Fig. 3, in this case it is difficult to assert the validity of the median estimates since no figures are reported for validation in the literature.
Fig. 5 summarizes analysis step ‘d’ above by providing an overview of the estimated divison of cooling technologies within each energy source (sources with negligible water use are omitted) and the corresponding water source, that is, freshwater or saline water, for EU28.
Despite a higher total level, the generation of electricity from nuclear sources (830 TWh) shows lower water-consumption figures than electricity generation from coal sources (791 TWh).
This is related to the division of energy sources in between countries and their access to cooling water. For example, Germany produces a large share of its electricity based on coal as an energy source in inland locations. From the figure it is also clear that renewable technologies employ negligable amounts of water, though this omits biofuel production or evapotranspiration from hydropower reservoirs.

Fig. 6 compares country-level estimated withdrawals (EW2015, top right) and estimated consumption levels (EC2015, bottom right) respectively with the reported values (RW2015, top left) based on the more detailed country-level analysis for 2015.
From RW2015 it is clear that energy systems in Central Europe, in particular in France and Germany, are particularly water-intensive with regard to total volumes of water compared to the rest of EU28.
This pattern is less significant when correcting for the electricity produced (insert, top left), where instead Belgium, Bulgaria, Estonia, Finland, Hungary and the Netherlands stand out. Furthermore, it is seen that the estimated water withdrawals for Europe generate country-level ‘patterns’ that resemble those of RW (see also Fig. 7).
In general, RW is found to exceed RW2015 for most countries (bottom left) with some notable exceptions like Germany, Lithuania and the United Kingdom, although the latter’s deviation is likely to be related to low absolute withdrawal levels due a high degree of seawater cooling. Slovenia also stands out (approx 100% overestimate).
This is likely to be related to the single nuclear plant in Slovenia, which uses approximately 74% of all national cooling water according to the calculations (EW). Therefore the RW/EW difference may be related to differences between the median values, given the conditions of this single plant. In Finland, most of the larger electricity plants are located along the coastline while still having a freshwater use (RW) of approximately 5000 M m3.
While most biomass plants in Finland are located inland, adding to the country’s freshwater use, a high relative difference of approximately 50% is still seen.
For Italy, little attention has been given to investigating the reasons for the large spread between RW and EW, since the latest RW reporting dates from 1980, rendering any attempts at validation futile (the 1980 level is used throughout the period).


Fig. 7 shows the water usage results for EW2015 (top panel) and EC2015 (bottom panel) for each country using the median, minimum and maximum levels. For EW2015, the results are shown in conjunction with RW2015 to enable their validation by country. Assuming this to be a first-order estimate of the ‘true’ associated uncertainty, the estimates (EC2015) approximate well to the corresponding reported values (RW2015), and all estimates are within the illustrated range associated with the country-level estimates except in the case of Malta, where information on local energy sources is lacking.
More information: Alena Lohrmann et al. Global scenarios for significant water use reduction in thermal power plants based on cooling water demand estimation using satellite imagery, Nature Energy (2019). DOI: 10.1038/s41560-019-0501-4


