


 Extract (6-MSITC) in Healthy Older Adults")
: An In-Depth Exploration into its Thermogenic Role and Social Significance")


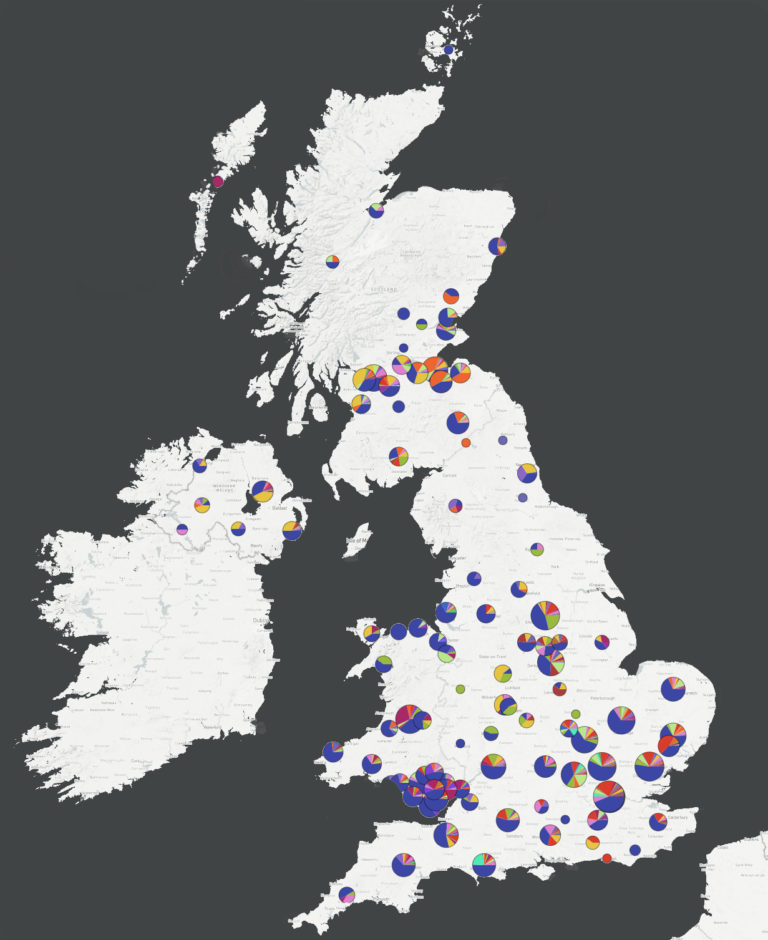
The data reports, published by the COVID-19 Genomics UK Consortium (COG-UK), show the value in mapping COVID-19 lineages across the UK to understand how the virus is spreading at national, regional and local levels
Approximately 40 lineages of the SARS-CoV-2 virus have been recorded circulating in the UK, some of which have already gone extinct while others thrive.
Previously, the different lineages of the single strain of the virus entered the UK through multiple importations from around the globe, including European countries such as Spain, Italy and France.
Now, fewer international lineages remain in the UK and new cases of COVID-19 arise from local spread rather than importation from other countries. The data reports§, published by the COVID-19 Genomics UK Consortium (COG-UK), show the value in mapping COVID-19 lineages across the UK to understand how the virus is spreading at national, regional and local levels.
As of 22 May, more than 20,000 viral genomes from positive COVID-19 tests have been sequenced in the UK, which is the largest number of COVID-19 genomes sequenced by any single country affected by the pandemic.
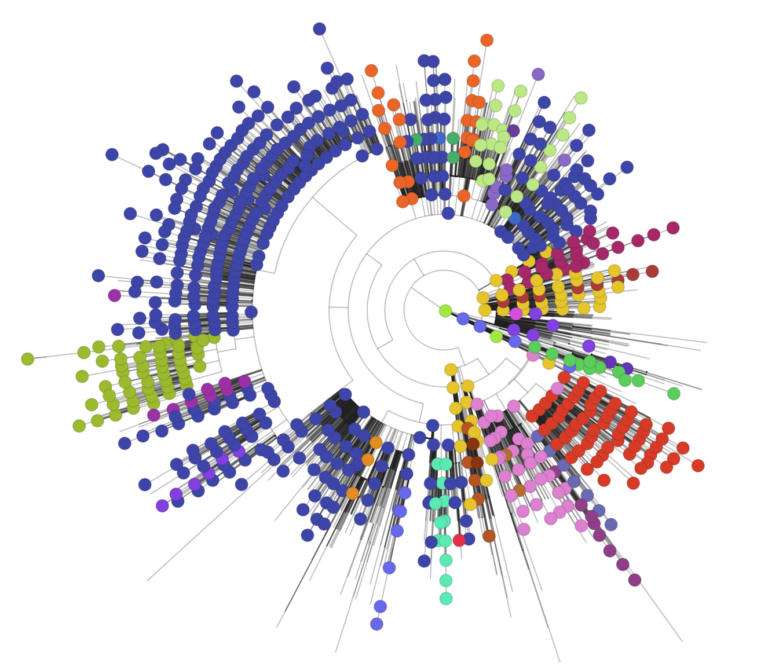
These genome sequences are being generated and utilised by researchers within COG-UK to identify different lineages* of the virus circulating in the UK. Despite recent reports, this volume of sequencing confirms the all COVID-19 cases in the UK share a recent common ancestor from China; all cases are closely related.
The lineages identified highlight small changes to the virus that enable monitoring and tracking over time, but do not signal the emergence of new strains at this point in the outbreak.
These data will aid the UK government in understanding patterns of spread in the UK to help focus different interventions in particular areas of the UK to control the spread of the virus and ultimately save lives.
The COVID-19 Genomics UK Consortium (COG-UK) – comprised of the NHS, Public Health Agencies and numerous academic and research institutions – is delivering large scale, rapid sequencing of the SARS-CoV-2 virus from positive COVID-19 samples and sharing intelligence with hospitals, regional NHS centres and the Government.
The latest COG-UK data reports show large numbers of independent introductions of the virus into the UK from around the world, resulting in approximately 40 COVID-19 lineages that are currently, or have been, circulating in the UK.
However, recent data suggest new COVID-19 cases in the UK are arising from local spread rather than people travelling to the UK from other countries.
A dynamic lineage assignment method, developed within the consortium, enables monitoring of SARS-Cov2 dynamics over time within the UK, with data mapped and delivered openly through an interactive web application*.
The data generated through COG-UK will be used to provide virus status reports, including estimates for the reproduction number, at the level of cities or local authorities.
“By analysing and comparing the different lineages of the SARS-CoV-2 virus that causes COVID-19 we can see how the virus is spreading through the UK, and determine whether new cases are arising from local spread versus importation from other countries. By ongoing mapping of lineages in space and time we can better understand and react to the changing dynamics of the pandemic.”
Professor David Aanensen,
Director of the Centre for Genomic Pathogen Surveillance at the University of Oxford Big Data Institute
“Since starting this project in late March, this consortium has sequenced more than 20,000 viral genomes from positive COVID-19 samples. Undertaking a project of this scale is made possible by an amazing network of collaborators and our staff who have applied their world-class expertise in genomics and surveillance of infectious diseases to tackle COVID-19.”
Dr Cordelia Langford,
Director of Scientific Operations at the Wellcome Sanger Institute
“This virus is one of the biggest threats our nation has faced in recent times and crucial to helping us fight it is understand how it is spreading. Harnessing innovative genome technologies will help us tease apart the complex picture of coronavirus spread in the UK, and rapidly evaluate ways to reduce the impact of this disease on our society.”
Professor Sharon Peacock,
Director of the COVID-19 Genomics UK Consortium (COG-UK)
Identity of SARS-CoV-2 to other closely related species
Human SARS-CoV-2 genomes have a within sequence identity of 99.98% (Table 1); and are much more identical to bat coronavirus than to pangolin coronavirus, although the values vary substantially depending on the specimen, 93.44%–96.17% (Table 1). When compared to pangolin coronavirus, the range of genome identities drops to 85.24%–92.35%.
Between 1,699 and 3,727 substitution variants separate the pangolin coronavirus genomes from the SARS-CoV-2 reference sequence, and this range drops to 1,105 to 1,369 (Table 1) when compared to bat coronavirus.
The bat #412976 coronavirus genome is conflictive because it has an unusual amount of mutational differences with respect to the SARS-CoV-2 reference and has an abnormally low sequence identity with human coronavirus (76.87%), comparable to pangolin coronavirus. This genome is problematic in the sequence alignment and should be avoided in future comparative analyses.
Inter- and intra-specific phylogeny and the root of SARS-CoV-2
An inter-specific Maximum Likelihood (ML) tree was built using pangolin, SARS, and bat coronavirus genomes as outgroups to investigate their phylogenetic relationships with SARS-CoV-2 (Supplementary material).
The tree depicts the SARS coronavirus genome occupying the most external branch. Next, all the pan genomes cluster separately from bat and human coronavirus, which also group separately. In line with its very low identity with SARS-CoV-2, bat- 412976 behaves as an outlier in the tree.
Overall, the clustering pattern in the tree is in very good agreement with sequence identity values (Table 1).
We next focused our attention on the root for all existing SARS-CoV-2 genomes, assuming the bat coronavirus as its closest coronavirus relative. We built a new ML tree including all SARS-CoV-2 genomes sequenced up to 29 February 2020 (n = 621); almost all of them are of Asian origin and this group should contain the Most Recent Common Ancestor (MRCA), as it is evident from phylogenetics and epidemiology that the origin of the pandemic is in China and more particularly within haplogroup B (see below and Supplementary Material). The ML tree unequivocally reveals that the root of SARS-CoV-2 is located in the basal B1 haplogroup (B1 genomes that do not belong to derived B1 sub-clades; Figure 1), and therefore points to B1 as the clade at the origin of the pandemic.
SARS-CoV-2 mutation rate, as inferred from the ML tree, is 5.42´10-4 (Bootstrap 2.5% – 75% confidence interval: 4.29´10-4–8.02´10-4) according to an uncorrelated relaxed-clock method; a slightly higher mutation rate of 6.05´10-4 (Bootstrap 2.5% – 75% confidence interval: 4.46´10-4–8.22´10-4) was obtained assuming and strick-clock model.
According to a relaxed-clock model mutation rate the TMRCA for all SARS-CoV-2 genomes dates to 12th November 2019 (Bootstrap 2.5% – 75% confidence interval: 7th August 2019 to 8 December 2019), fully matching epidemiological dates; estimates using an strick clock mutation rate varied very little: 7th November 2019 (Bootstrap 2.5% – 75% confidence interval: 18 August 2019 to 2 December 2019).
The most parsimonious tree (fully developed in Supplementary Material Figure S4; see also skeleton in Figure a) shows that the two very stable transitions C8782T and T28144C (3 and 1 total occurrences in the phylogeny, respectively) separate SARS-CoV-2 variation into two main clades, A and B, both originating in China.
Sub-haplogroups emerging from these main clades are mainly supported by single mutations, most of them being very solid along the phylogeny (Table S1), and therefore granting the robustness of the different clades. It is notable that the structure of the branches in the parsimonious tree fully agrees with the skeleton shown in the ML tree.
Haplogroup B (19.65% of the genomes in the database; n = 664) is present in all continents; being more prevalent in North America (46.35%), South America (25.93%) and Asia (22.33%), and having the lowest frequencies in Africa (8.33%) and Europe (3.74%) (see frequency interpolated maps in Supplementary Material). B1 is separated from B by a single transition (C18060T) and it is by far the most numerous B subclade (n = 424; 63.86% of all B).
The main proportion of B1 lineages worldwide is present in North America (n = 365; 86.04% of all existing B1 genomes). Most of the B1 genomes belong to the subclade B1a1 (B1a[A17857G]>B1a1[C1774T]); this contains at least 11 minor sub-clades, each defined by characteristic single mutations. In consonance with the root of SARS-CoV-2 being within B, we observed that basal haplogroup B is more prevalent in Asia (70%) than in anywhere else, and it is the only region containing genomes belonging to all first level B-subclades (B1, B2, B3, etc; perhaps with the exception of the minor clade B9).
It is noticeable however that, within B, the fourth level sub-clade B1a1 is the most frequent haplogroup in the database (399/664; 60.09%) and it appears mainly in North America (accounting for 357 [333 in USA] out of the 399 B1a1 counts in the database; 89.47%), while it is absent in Asia; Figure 2.
In Europe, the main B sub-clade is B3a (61.02%), which is particularly prevalent in Spain, one of the main European epicenters of COVID-19. It is most likely that most of these B3a representatives arrived in South America from Spain (where it represents 71.43% of all B genomes) given the high connectively between the two regions; Figure 2. The high B3 frequency observed in Spain marks a notable difference with respect to other European countries; 32 out of the 37 (86.49%) B3 genomes in Europe are located in Spain.
Haplogroup A (n = 2,715), with complementary frequencies to B, is the predominant clade all over the world (Figure 2), although with heterogeneous distributions (Supplementary Material). It reaches its highest frequencies in Europe (97.1%) and Africa (93.1%), is relatively high in Asia (76.3%) and Oceania (77.4%), and it has the lowest frequencies in South America (68.2%) and North America (53.1%).
By far, the most frequent sub-clade of haplogroup A is A2a (n = 1,849; 68.10% of all A genomes), which is the main representative of the non-Asian outbreak, followed by A1a (n = 287; 10.57%). Even though A2a is mostly present in Europe (n = 1,199; 64.85% of all A2a sequences), and North America (n = 370; 20.01%), it most likely originated in Asia (Supplementary Material).
A3 is mainly found in Asia, and especially in the Middle East (81.25%); its sub-clade A3a is also highly prevalent in the same region (31.94%) but shows even higher frequency in Oceania (44.44%). Other minor clades are found in more restricted areas; for instance, A4a (n = 39; 1.44% of A) is only found in Wales (Europe), while A5, A7 and A9b appear only in Asia.
Phylogeographic information allows reconstructing dynamics of (sub)haplogroups worldwide (Figure 2). The main clades emerged in Asia (mainly in China), while some minor ones appeared outside Asia (next section; Supplementary Material).
The number of sequences belonging to clade A and its main sub-clades increased exponentially during the outbreak occurring outside Asia at the end of February 2020, while the frequency of haplogroup B genomes increased more slowly at that time (Supplementary Material).
Nucleotide diversity is almost homogeneous in all the different geographical regions for the main haplogroups; however, haplotype diversity (HD) values vary more substantially among haplogroups, probably indicating the weight of sequence founders in this index (see next section on super-spreaders); Supplementary Material.
Super-spreaders and founder effect
It is remarkable that a few haplotypes are disproportionally represented in continental regions or in particular countries (Supplementary Material; Figure S10), appearing abruptly in a few days’ period. This pattern is compatible with super-spreader hosts arriving to certain geographic locations and giving rise to severe founder effects (Figure 3A).
Haplotypes #H1, #H2, #H3, and #H4 (ID’s as in Table S8) are the most frequently repeated ones. H1 (n = 163; haplogroup A2a4), represents one of the main haplotypes responsible for the introduction or the pandemic in Europe (104/163; 63.80%), with particular frequency in the UK (35/163; 21.47%) and Belgium (23/163; 14.11%); it is also prevalent in North America (with a one week delay; 15/163 13.50%), and Australia (18/163; 11.04%). H2 (n = 133; A2a2a) occurs also in Europe at high frequency (75/133; 56.39%; 34 times in Iceland) and in North America (48/133; 35.82%; mostly in USA with 45 occurrences). H3 (n = 132; B1a1) appears at remarkably high frequency and almost exclusively in USA (126/132; 95.45%; B1a1). H4 (n = 78;
A) corresponds to the reference sequence (GenBank acc. nº MN908947.3) and it reaches the highest frequency in Asia (60/78; 76.92%), particularly in China (49/78; 62.82%); the frequency of H4 increased in two pulses, one coinciding with its first appearance in China at the end of December 2019, and the next coinciding with the large Asian outbreak in mid-February 2020; later, H4 moved to other non-Asian locations, e.g. USA (10/78; 12.82%).
There are additional examples of SARS-CoV-2 super-spreader hosts (Table S8) appearing in restricted geographical areas. For instance, H8 (n = 33; A3) appears at high frequency in Japan (28/33; 84.85%). In Iceland, founder haplotypes represent a large proportion of all existing haplotypes on the island
e.g. H7 exists only in Iceland (n = 37), and together with H2 (n = 34 in Iceland) and other four haplotypes, makes up 39.18% of all the haplotypes in this country. In USA, H3 occurs 126 times, and H2 45 times; together with other five haplotypes, they make up 31.75% of all genomes in this country.
In the UK, eight haplotypes make-up 28.95% of the total haplotypes. H9 (n = 26; B3a) and H14 (n = 22; A2a5) are probably the main haplotypes responsible for the Spanish outbreak; H9 (21/26 in Spain; 80.77%) is particularly interesting because it belongs to haplogroup B3a, while almost all European haplotypes belong to haplogroup A (Supplementary Material; Figure S9); H14 appears 9 times in Spain (9/22; 40.91%).
Common haplotypes are frequently shared between neighboring countries, an observation mirroring the easy spread of the virus over short geographic distances; for instance, H33 (n = 9; of which 7 are in Portugal and 2 in Spain) or H45 (n = 7; of which 4 are in Portugal and 1 in Spain).
Evolution of effective population size of SARS-CoV-2
Extended Bayesian Skyline Plot (EBPS) analysis undertaken on genomes sampled until the end of February (see Supplementary Material) reflects with great precision the main COVID-19 epidemiological episodes. If we consider the estimated TMRCA for SARS-CoV-2 to 12th November 2019 and allow 14-24 days of disease incubation (until approximately the 6th of December), this leaves a period of two or three weeks of silent local transmission of the virus until the first case is reported in Wuham on 30th December 2019.
From this moment, Ne begins to slightly increase for a couple of weeks (Figure 3B), followed by exponential growth from 20th January 2020, coinciding with the Asian outbreak. The peak is reached on 30th January 2020, matching the Asian lockdown. Consequently, Ne drops remarkably for the next couple of weeks, but starts to grow progressively again from 12th February 2020, coinciding with the beginning of the non-Asian outbreak.
By overlapping COVID-19 incidence (officially reported cases per day worldwide; https://ourworldindata.org) with the EBPS plot, we observed comparable shape distributions, but with a remarkable 14–15 days’ delay in reported cases per day worldwide with respect to the EBPS distribution (Figure 3B).
Legend to the Figures
Figure 1. Inter-specific ML tree indicating the root of all existing SARS-CoV-2 genomes.
Figure 2. Map showing the worldwide spread of the main SARS-CoV-2 clades. Circle areas are not proportional to frequencies, and the arrows indicate just an approximate reconstruction of the phylo-dynamics of SARS-CoV-2 for the beginning of the Asian outbreak to the non-Asian spread of the pathogen based on meta-data (indicating the sampling origin and dates) and the classification of genomes into haplogroups according to the phylogeny in Supplementary Material Figure S4.
Figure 3. (A) Simplified SARS-CoV-2 phylogeny (see Supplementary Material Figure S4 for the complete tree) illustrating the main branches and the main outbreaks occurring in Asia and outside Asia. The tree also shows the sub- clades that were mainly founded by a few super-spreaders. (B) EBPS based on genomes sampled from the beginning of the pandemic until the end of February 2020 (n=621). The orange distribution shows the real number of cases per day as recorded in https://ourworldindata.org for the same time period (we disregarded the abnormal peak occurring on 13th February 2020, since more than 15,000 new cases were reported in China in just one day, most likely representing not confirmed cases); and (C) Timeline of the main events occurring during the pandemic, and indicating the MRCA of all SARS-CoV-2 genomes; the dotted area is a schematic representation of the real diversity values reported in Supplementary Material Figure S2. Divergence dates between SARS-CoV-2 and bat sarbecovirus reservoir and between bat and pangolin coronavirus were taken from (7).
Table 1. Inter-specific comparisons of sequence identities between different species, including pangolin (Manis javanica) and bat (Rhinolophus affinis) against the HQ SARS-CoV-2 dataset. Comparisons involved 3,478 SARS-CoV- 2 genomes against the coronaviruses indicated in the table. ID refers to identity number in GISAID (GS; omitting the prefix “EPI-ISL-“) and GenBank (GB). NC_004718.3 corresponds to the reference SARS Coronavirus genome (14). The genome #402131 corresponds to RaTG13 that has been used in the literature as bat coronavirus reference. GISAID 414518 and 420923 correspond to coronavirus analyzed from a dog and a tiger (Panthera tigris jacksoni) that where infected by human SARS-CoV-2. Abbreviations are as follows: Time: refers to the collection year of the specimen. Dif: Mutational differences of the coronavirus indicated when compared to the SARS-CoV-2 references sequence (MN908947.3). Id: average identity of the HQ SARS-CoV-2 against the corresponding coronavirus in the table. SD: standard deviation of Dif values. Max and Min: maximum and minimum identities shown by a SARS-CoV-2 genome with the other coronaviruses. “N” means ambiguity.


COG-UK data reports for weeks 2 (1 April) and 3 (9 April) are available here: https://www.cogconsortium.uk/news/
References
- P. Forster, L. Forster, C. Renfrew, M. Forster, Phylogenetic network analysis of SARS-CoV-2 genomes. Proc Natl Acad Sci U S A, (2020).
- Z. Shen et al., Genomic diversity of SARS-CoV-2 in Coronavirus Disease 2019 patients. Clin Infect Dis, (2020).
- K. G. Andersen, A. Rambaut, W. I. Lipkin, E. C. Holmes, R. F. Garry, The proximal origin of SARS-CoV-2. Nat Med 26, 450-452 (2020).
- X. Li et al., Evolutionary history, potential intermediate animal host, and cross-species analyses of SARS-CoV-2. Journal of medical virology, (2020).
- Y. Shu, J. McCauley, GISAID: Global initiative on sharing all influenza data – from vision to reality. Euro Surveill 22, (2017).
- C. Ceraolo, F. M. Giorgi, Genomic variance of the 2019-nCoV coronavirus. Journal of medical virology 92, 522-528 (2020).
- M. F. Boni et al., Evolutionary origins of the SARS‐CoV‐2 sarbecovirus lineage responsible for the COVID-19 pandemic. bioRxiv doi: https://doi.org/10.1101/2020.03.30.015008, (2020).
- B. Hu et al., Discovery of a rich gene pool of bat SARS-related coronaviruses provides new insights into the origin of SARS coronavirus. PLoS pathogens 13, e1006698 (2017).
- W. J. Guan et al., Clinical Characteristics of Coronavirus Disease 2019 in China. N Engl J Med, (2020).
- L. A. Holland et al., An 81 nucleotide deletion in SARS-CoV-2 ORF7a identified from sentinel surveillance in Arizona (Jan-Mar 2020). Journal of virology, (2020).
- R. A. Stein, Super-spreaders in infectious diseases. International journal of infectious diseases : IJID : official publication of the International Society for Infectious Diseases 15, e510-513 (2011).
- G. Wong et al., MERS, SARS, and Ebola: The Role of Super-Spreaders in Infectious Disease. Cell Host Microbe 18, 398-401 (2015).
- S. Y. Lau et al., Attenuated SARS-CoV-2 variants with deletions at the S1/S2 junction. Emerging microbes & infections 9, 837-842 (2020).
- M. A. Marra et al., The Genome sequence of the SARS-associated coronavirus. Science 300, 1399-1404 (2003).


[…] Genomics UK Consortium show the value in mapping COVID-19 lineages across… […]
[…] Genomics UK Consortium show the value in mapping COVID-19 lineages across… […]