


 Extract (6-MSITC) in Healthy Older Adults")
: An In-Depth Exploration into its Thermogenic Role and Social Significance")


A multidisciplinary analysis by a group of Brazilian scientists, published online in the journal Scientific Reports on June 21, 2021, found that three major factors account for the geographic spread of SARS-COV-2 across Brazil, as well as the massive flow of people in search of hospital care throughout the country during the first wave of the pandemic in 2020.
SARS-CoV-2 entered Brazil at the end of February 2020 through the country’s international airports. Mathematical modeling reveals that during the first weeks of March 2020, the super-spreader city of São Paulo, located next to both the largest Brazilian international airport and the busiest highway hub in the country, accounted for more than 85% of COVID-19 cases throughout Brazil.
By considering only 16 other spreader cities, the authors were able to account for 98-99% of the cases reported during the first three months of the Brazilian pandemic in 2020. Most of this spread of COVID-19 cases resulted from people traveling across the country’s major highways and on plane flights, which continued throughout the entire month of March 2020.
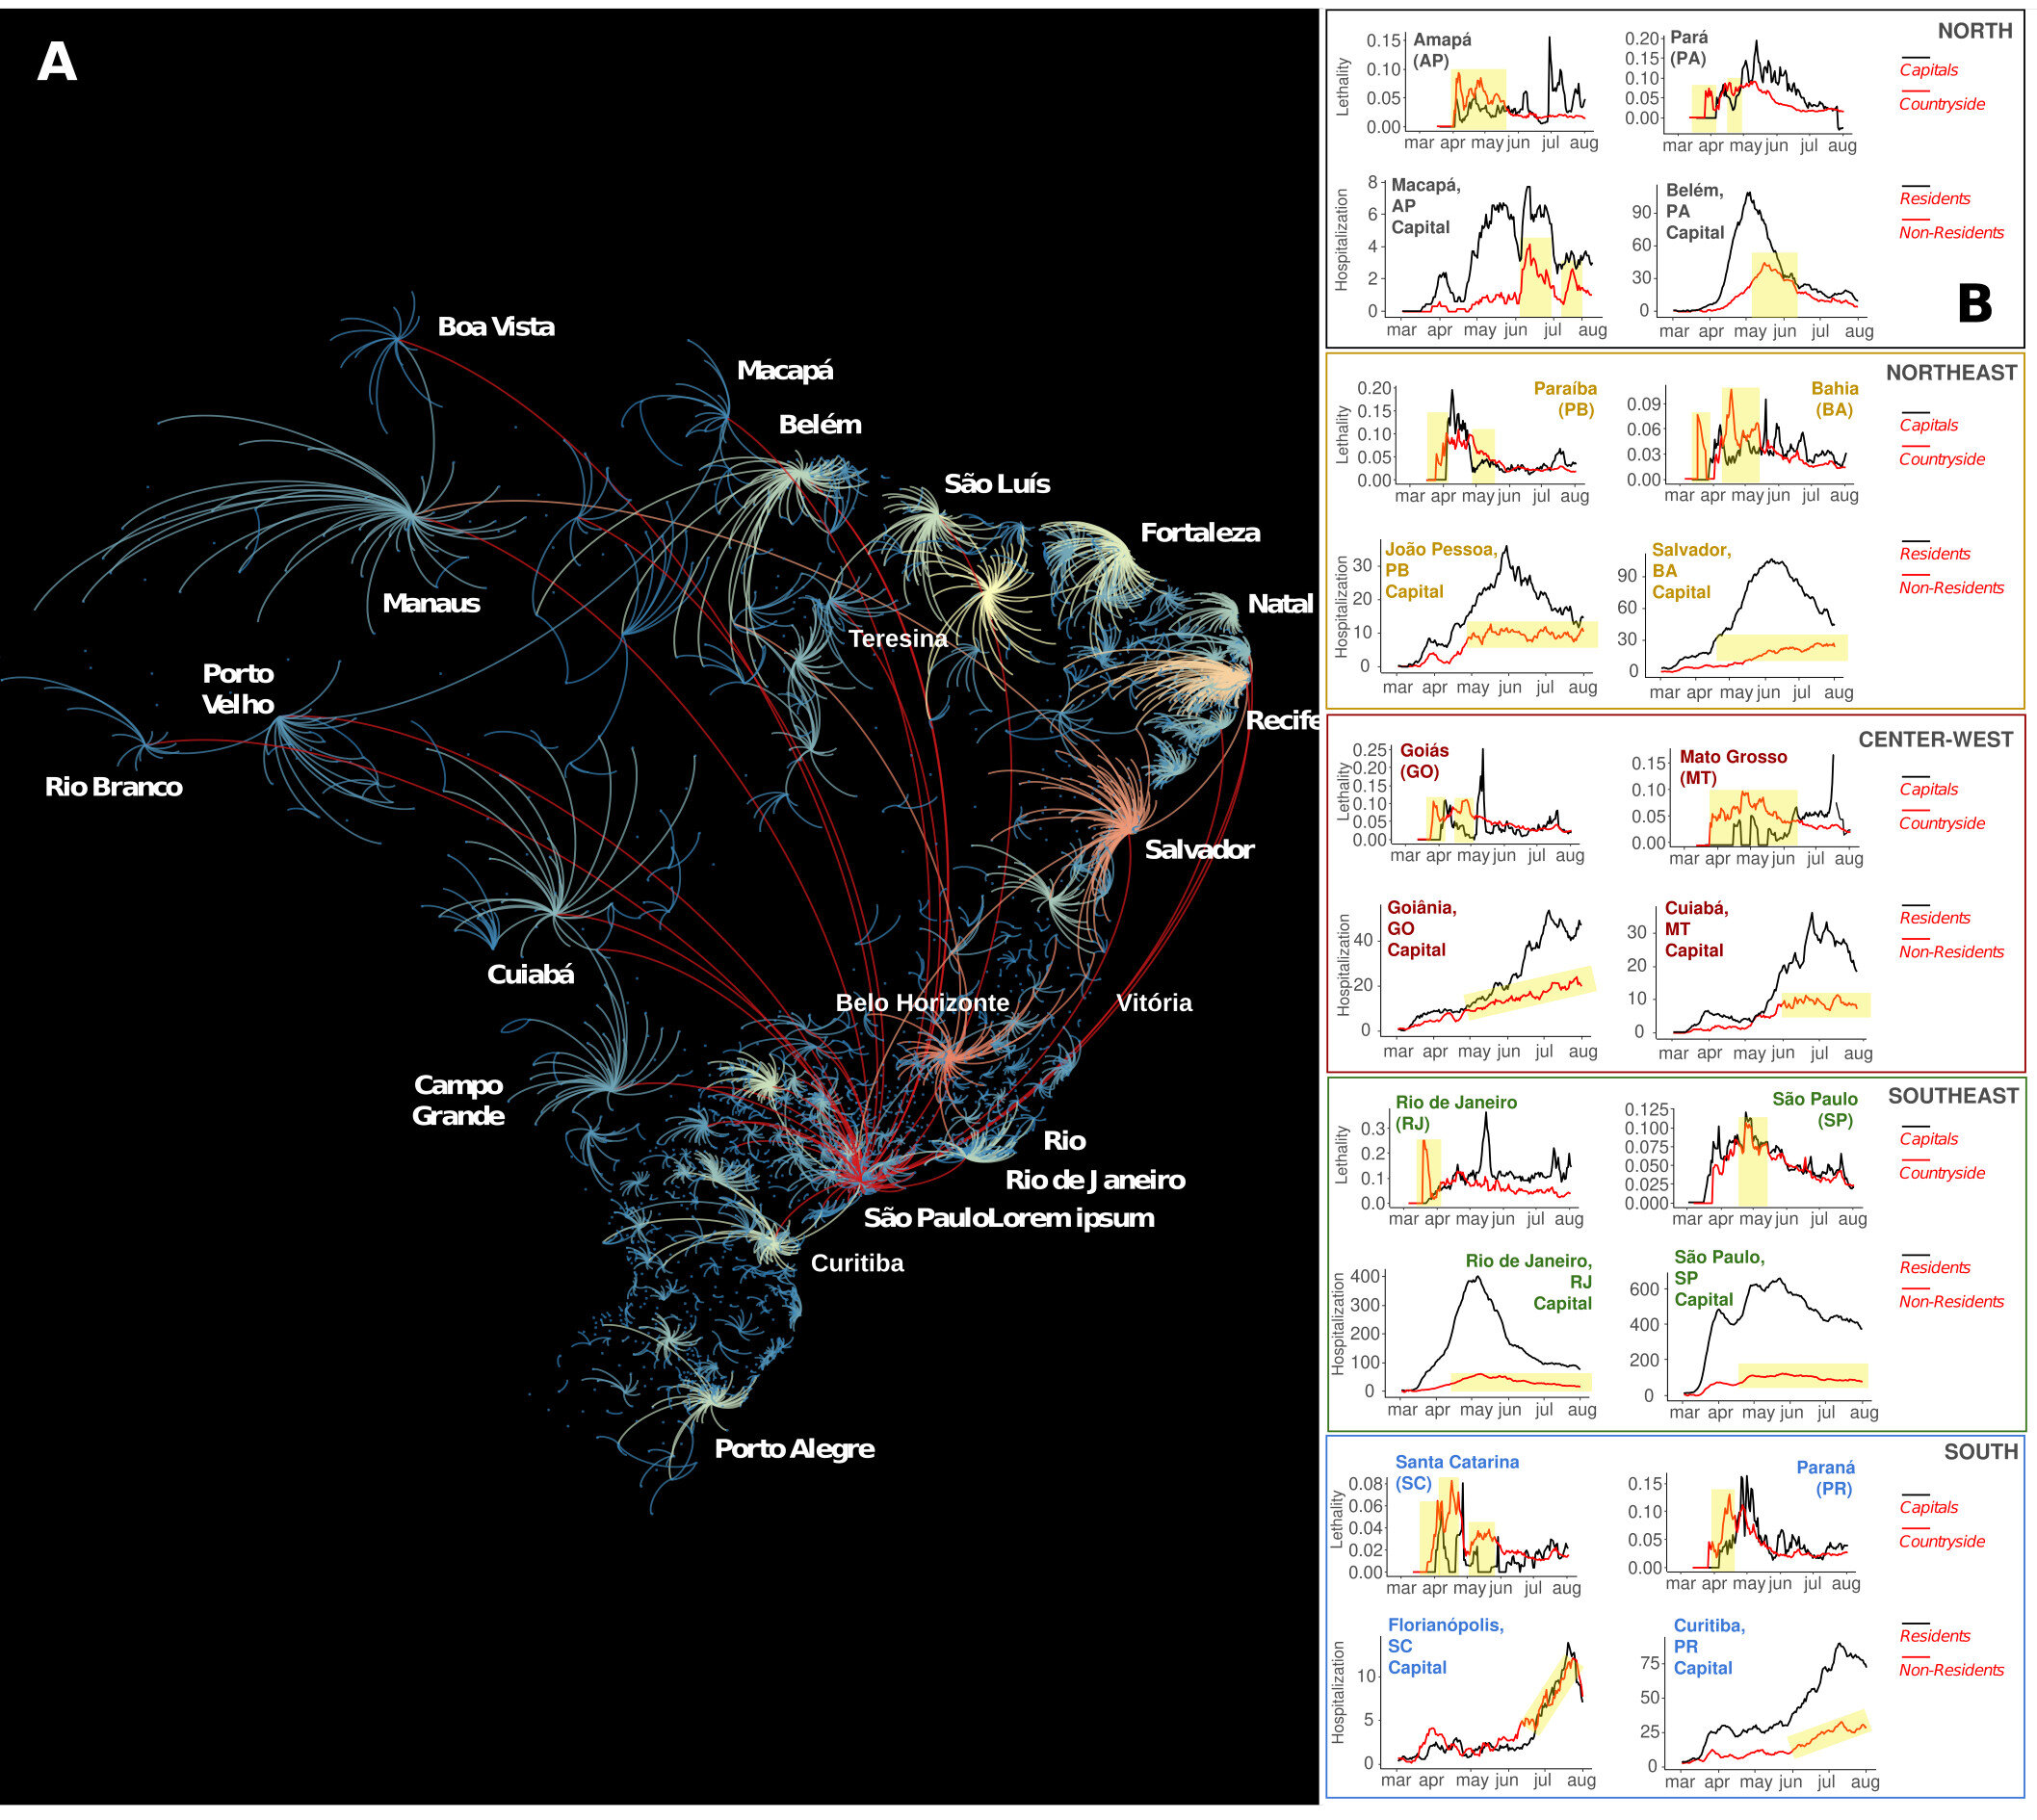
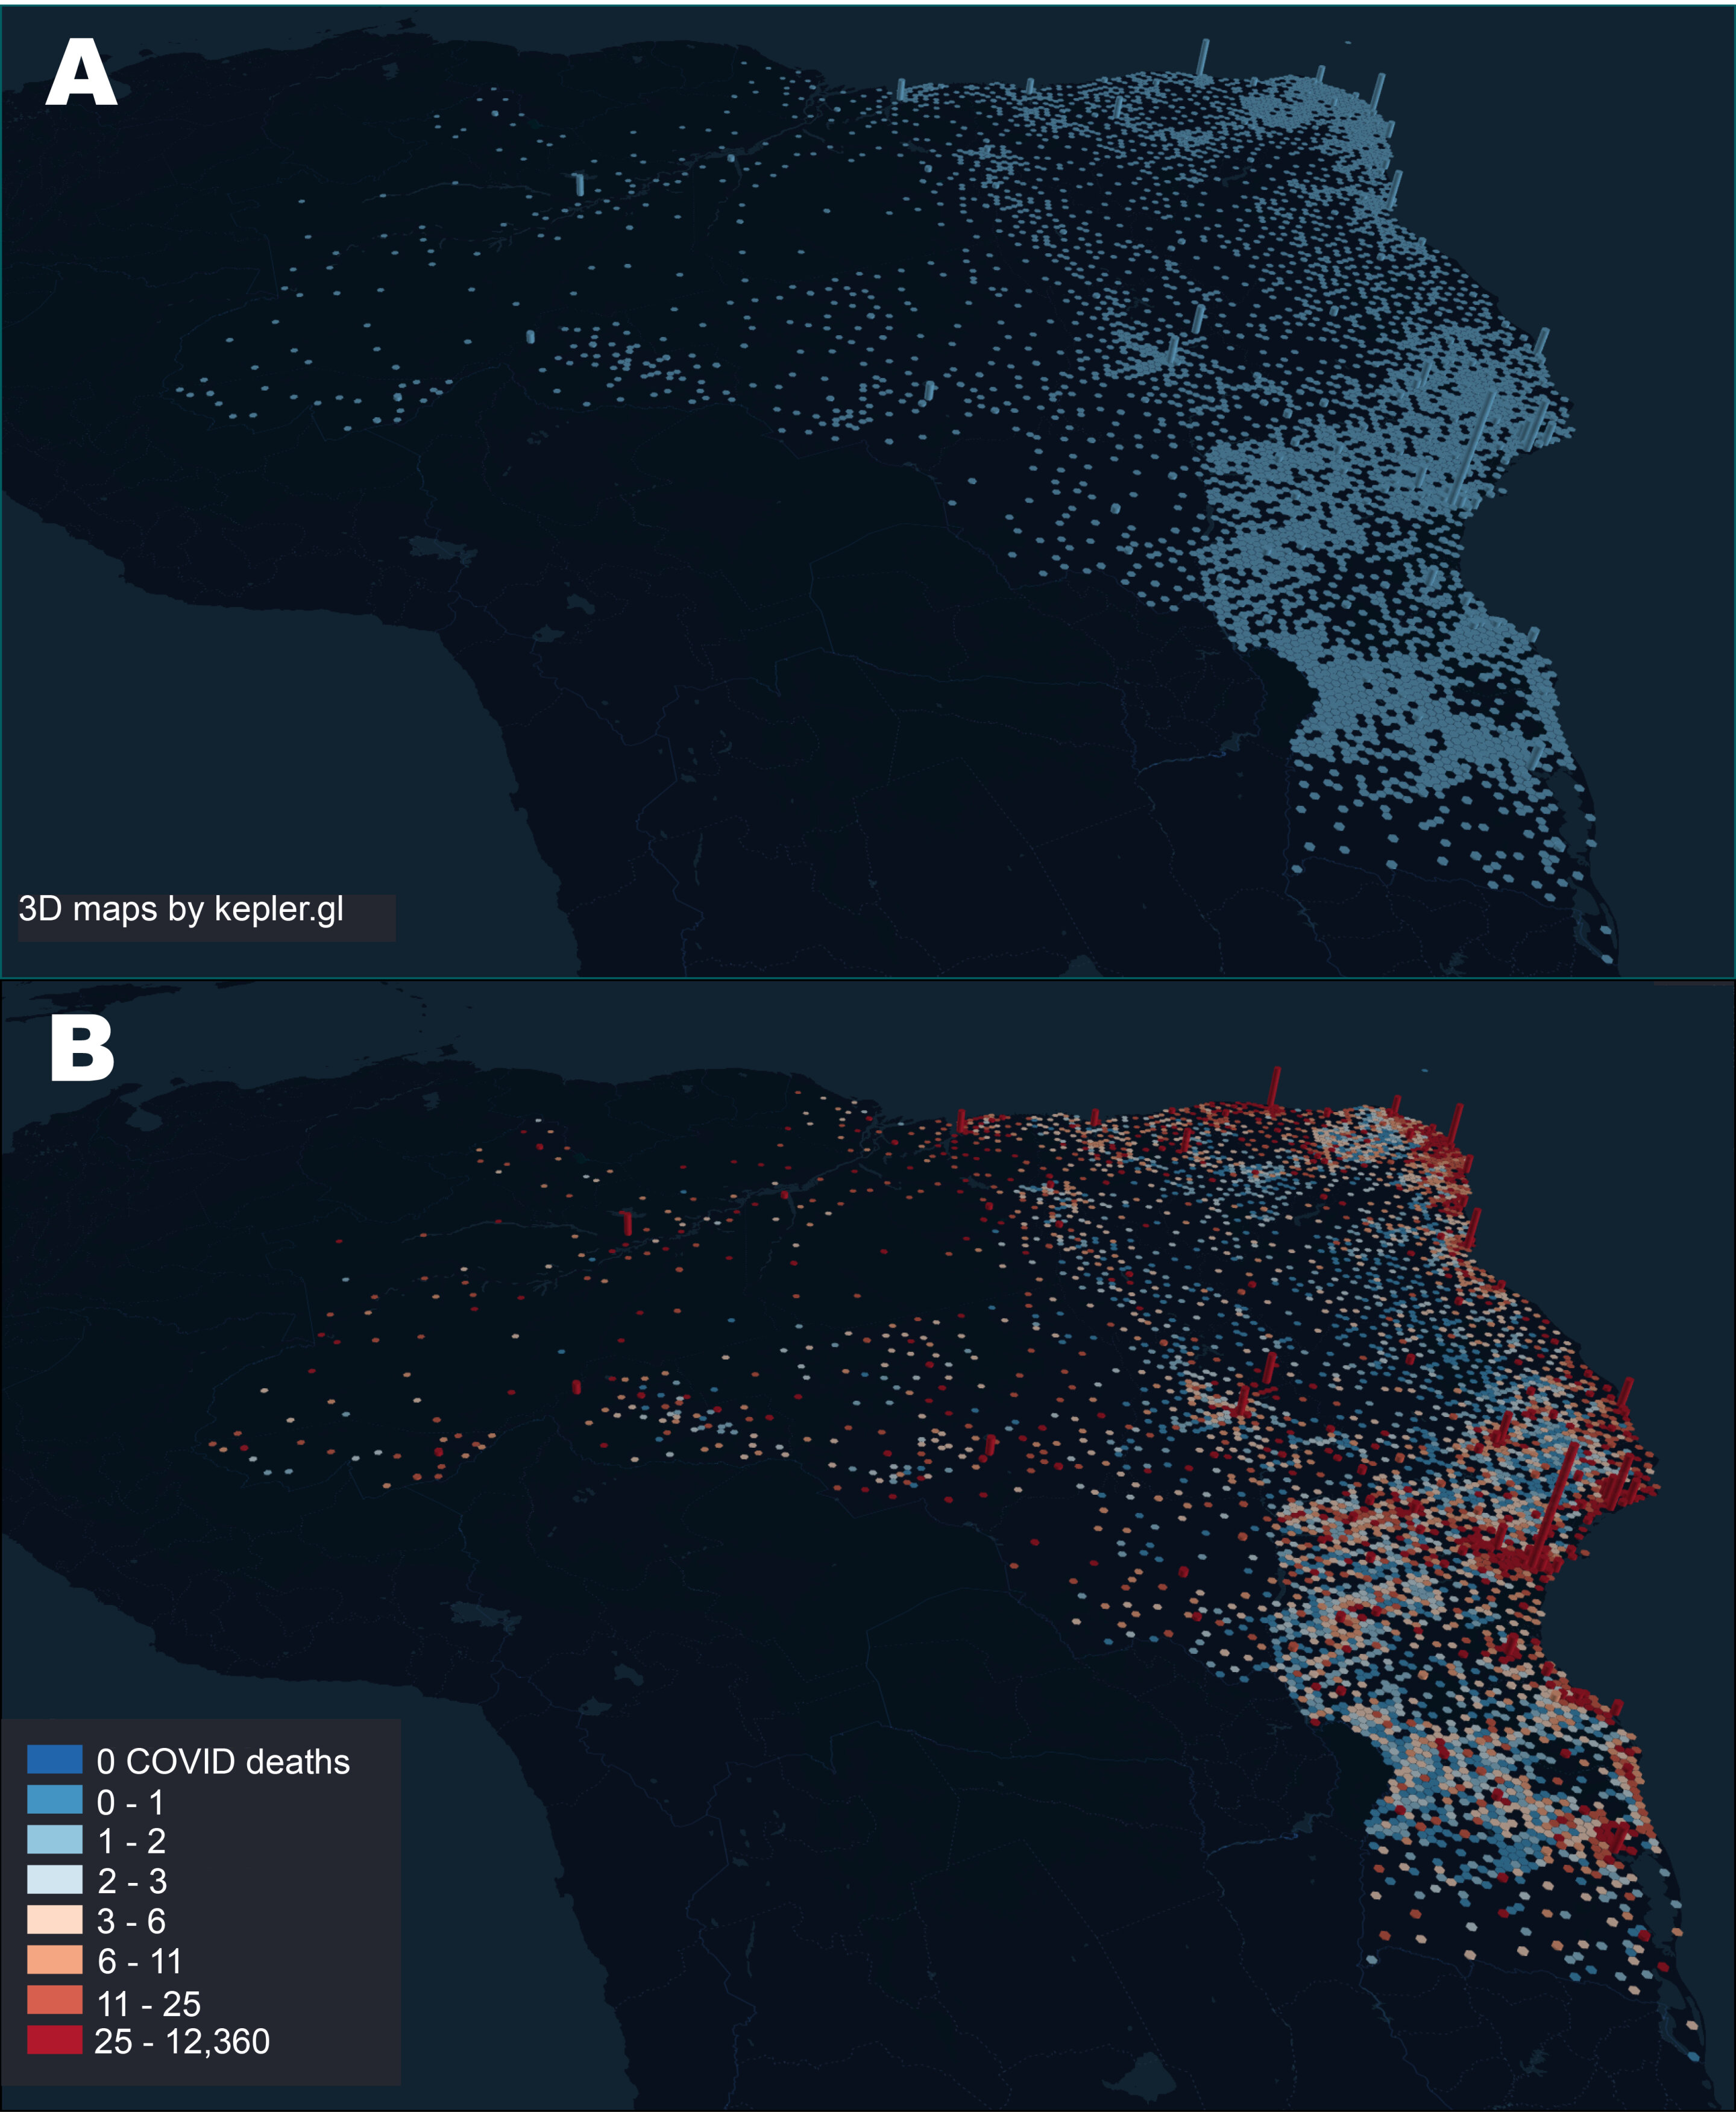
Following the emergence of community transmission in the major 16 super-spreader, SARS-CoV-2 cases spread to the Brazilian countryside through the country’s federal and state highways. As cases increased exponentially in the Brazilian interior, severely ill patients from the country’s interior had to be transported to state capitals to access ICU beds, creating a “boomerang effect” that contributed to skewing the distribution of COVID-19 deaths.
Therefore, the distribution of COVID-19 deaths began to correlate with the allocation of the country’s highly uneven distribution of intensive care units, which is heavily weighted toward state capitals.ù
According to Miguel Nicolelis, one of the authors of the study, “our analysis clearly showed that if a national lockdown and mandatory road traffic restrictions had been enforced around the main Brazilian super-spreader cities, particularly in the city of São Paulo, the impact of COVID-19 in Brazil would be significantly lower during the first wave, but also during the even more damaging second wave that hit the country a year later in the summer of 2021.
From June 2020 to June 2021, Brazil went from 50,000 to 500,000 deaths, a tenfold increase in 12 months. This alone illustrates the utter failure of the Brazilian federal government to protect Brazilians from the worst humanitarian tragedy in the country’s entire history.”
In Brazil, the vast majority of tertiary hospitals, and hence the largest share of critical care beds, are located in large cities that serve as state capitals, their metropolitan areas, and a handful of mid-sized towns in each state’s interior. As a result of the highly pervasive “boomerang effect” throughout the country, Brazil experienced the largest hospital admission surge in its history, leading to fatality peaks in each of the cities with a large number of critical care units.
This “boomerang flow” was not restricted to roads and highways. For instance, in the Amazon rain forest, located in the north region of Brazilian, severely ill COVID-19 patients from many small riverside communities were transported by boats of all sorts via its large rivers toward the two largest Amazon cities, Manaus and Belém.
Overall, analysis of the geographic flow of COVID-19 patients revealed that São Paulo, the largest Brazilian super-spreader city, received patients from 464 different cities all over Brazil, followed by Belo Horizonte (351 cities), Salvador (332 cities), Goiânia (258 cities), Recife (255 cities), and Teresina (225 cities). São Paulo was also the city that sent more residents to be hospitalized in other cities (158 cities), followed by Rio de Janeiro (73 cities), Guarulhos (41 cities), Curitiba (40 cities), Campinas (39 cities), Belém (38 cities) and Brasília (35 cities).
Overall, cities that were highly connected to the health system network, either by receiving from or sending patients to other cities, also experienced a higher number of COVID-19 deaths. Therefore, as a result of the “boomerang effect,” a significant number of severely ill patients had to migrate to larger cities for treatment and, eventually, a significant number of them perished there. Combined with the deaths of the residents of large cities, the widespread “boomerang effect” contributed decisively to the geographic skewing of the COVID-19 death distribution in all of Brazil.
Commenting on the study’s findings, Rafael Raimundo, another author, said, “Our analysis elucidated in great detail the mechanisms through which COVID-19 quickly spread throughout Brazil. Our findings also indicate that if non-pharmacological measures, such as highways blocks and lockdowns, had been enforced early on at a national or even regional level thousands of lives could have been saved at the onset of the COVID-19 pandemic in Brazil.”
The authors also emphasized in their conclusions the fundamental importance of the Brazilian Public Health System, known as SUS. According to Rafael Raimundo “without the public health infrastructure of SUS, built during the past 40 years, the impact of COVID-19 would certainly be even more devastating. Yet, our data also show that the high magnitude of the “boomerang effect” highlights the need for SUS to install more hospital infrastructure, including more critical care unit beds, in the Brazilian interior to better assist and serve the population in the countryside.”
“Certainly, the widespread absence of adequate hospital infrastructure and health professionals in the Brazilian countryside contributed decisively to a high number of deaths that could have been avoided altogether. Yet, if the Brazilian federal government had reacted quickly and properly to the arrival of SARS-CoV-2, by creating a national scientific task force in charge of fighting the pandemic, while implementing a national communication campaign to alert the population, and had closed the country’s air space, while implementing a national lockdown in early March 2020, including establishing roadblocks on the major federal and state highways, Brazil would almost certainly have avoided the loss of tens of thousands of lives,” added Miguel Nicolelis.
Differences in severity have been observed with respiratory viruses, including in- fluenza viruses, rhinoviruses, and coronaviruses [3–5]. SARS-CoV-2 primarily affects the respiratory system and the severity of the disease ranges from asymptomatic infection to severe acute respiratory distress [6].
Additionally, neurological symptoms including, notably, anosmia and ageusia are frequent [6], and some patients may also present with cutaneous [7] and gastrointestinal symptoms [7]. Finally, thrombotic, and thromboembolic diseases appeared to be frequent complications in COVID-19 patients [7].
As a consequence, the severity of the disease may greatly vary depending on the clinical presentation and the organs affected by the disease. In addition, the severity of the disease and the mortality rate are related to many host factors, including age, gender, chronic conditions, comorbidities, race, and ethnicity [6].
On the other hand, the virus mutation is also thought to affect the severity of the disease [8–11]. Since the emergence of severe acute respiratory syndrome coronavirus 2 (SARS-CoV-2), genetic variants have been identified. In particular, the recent identification of new variants of concerns (VOC) in the UK (named 20I/501Y.V1 or B.1.1.7), South Africa (20H/501Y.V2 or B.1.351), Brazil (P1) and California, USA (B.1.427 and B.1.429), is causing concerns (Table 1) [12,13].
In a study conducted on more than 10,000 SARS-CoV-2 genomes from four databases from patients in 68 countries, 5775 distinct genomes were identified, including 2969 missense mutations and 36 stop-gained variants [14]. Investigation of a possible selective advantage or of an association with clinical severity of these variants is of paramount importance. Mutations in the gene encoding Spike protein of SARS-CoV- 2 have been showed to affect both the virus infectivity and antigenicity in vitro [15].
In Marseille, France, a two-act pattern of incidence of COVID-19 cases occurred and significant differences in clinical outcomes were observed between patients seen in March–April 2020 and those seen in June–August [16,17].

We aim to conduct this review to summarize the relation between viral mutation and infectivity of SARS-CoV-2 and viral mutation and severity of COVID-19 in vivo and in vitro.
Discussion
The SARS-CoV-2 virus, due to the lack of proofreading activity of the RNA-dependent RNA polymerase, has high mutation rates that may have important effects on the pathogenic- ity and transmissibility of the virus [16]. The identification of genome variations of SARS-CoV-2 and their relationships with viral infectivity or severity of COVID-19 is therefore important for controlling and surveying the evolution of the pandemic [14,74].
In addition, mutation rate of SARS-CoV-2 determines the evolution of this virus and the risk of emergent infectious diseases [74]. In a study by Koyama et al., the me- dian mutation rate of SARS-CoV-2 was estimated at 1.12.10−3 mutations per site/year (95%CI = [9.86.10−4–1.85.10−4]) [74]. A high mutation rate of around 30% was observed among 95 full-length genomic sequences [75]. An analysis of 48,635 samples showed an average of 7.23 mutations per sample [76].
To date, 46,251 SARS-CoV-2 mutations were documented in the public databases (http://cov-glue.cvr.gla.ac.uk/#/replacement (accessed on 31 May 2021)). Numbers of variations are the highest in the NSP3 protein, followed by S protein, NSP12 protein, NSP2 protein, NSP 13 protein, NSP14, and NSP4 protein. By contrast, very little divergence was documented in NSP11, ORF10, ORF7b and E proteins [74] (http://cov-glue.cvr.gla.ac.uk/#/replacement (accessed on 31 May 2021)). Figure 2 shows the positions of the mutations and deletions in the genome and of amino acid substitutions in the virion.
A key element of the coronavirus host range is determined by the binding affinity between the spike S protein and the cellular receptor. All mutations in the S protein could influence host range and transmissibility of the virus [16]. The SARS-CoV-2 Spike protein is a class I fusion protein that forms trimers on the viral surface: it is heavily glycosylated, which enables entry into host cells [77]. Angiotensin-converting enzyme 2 (ACE2) is the target receptor of the SARS-CoV-2 virus for entry into the host cell [77].
The main effect of the D614G mutation is to increase the availability of spike trimer components in the conformation and permits enhancing the binding of the virus spike to the ACE2 receptor. The in vitro and in vivo studies to date showed that the mutation D614G in Spike protein was associated with higher viral loads and probably with enhanced transmissibility of the virus [22,25,30]. Therefore, this mutation emerged and has become the dominant form in the global pandemic worldwide within a matter of months. It suggests that G614 may have a fitness advantage [78].
The frequency of S protein 614G was significantly associated with high fatality rates in several countries, as reported in studies which analyzed SARS-CoV-2 sequences from GISAID database [8,10,11]. However, clinical studies showed that this mutation did not correlate with severity of COVID-19, including mortality, transfer to ICU, mechanic ventilation, or length of stay at hospital [30,37,41,42,44,45].

In addition, clinical studies have shown that other viral mutations were not related to severity of COVID-19 infection or were associated with less severe infection in patients. Young et al. showed that the patients infected with ∆382 had lower concentrations of inflammatory biomarkers. Furthermore, these patients had a higher concentration of SDF-1 α, which is low in patients with hypoxemia [51]. Interestingly, the replication capacity of ∆382 variant in vitro is similar to that of wild-type SARS-CoV-2. It suggests that this mutation does not reduce replicative fitness [51]. In a study by Colson et al., the authors demonstrated seven new mutations of SARS-CoV-2, named “Marseille-1” to “Marseille-7”. Moreover, heterogeneity of the sequences produced from June to August 2020 (second outbreak) was higher than in sequences produced from February to May 2020 (first outbreak) (7.6.10−4 3.8.10−4 versus 2.3.10−4 1.1.10−4). This result indicates that the rate of virus mutation has increased rapidly.
By contrast, the mortality of COVID-19 patients during the second outbreak was lower than that of those in the first one [17].
Recently, 501Y1, 501Y2 and P1 variant emergence in UK, South Africa and Brazil and the successive spread beyond the country of origin [79] have led to significant concern by medical and political authorities in many countries with extensive media coverage.
The current evidence may suggest that these variants have led to increased infectivity and deteri- orating epidemiological situations [34,79,80]. However, the relation between these variants, particularly the 501Y variant, and severity of COVID-19 is contradictory [34,63,79,80]. In our analysis, 8/10 studies reported a positive association between these VOCs and severity of COVID-19. Almost all of these studies were bigdata analyses. In fact, in one clinical study conducted using 496 patients, with 341 having samples that could be sequenced, no evidence of an association between severity of disease and death and B.1.1.7 variant was observed [39]. In addition, Dao et al. showed a lower rate of hospitalization associated with N501Y variants as compared to Clade 20A and the Marseille-4 variant [70]. To date, only one clinical study reported a higher hospitalization rate in 68 patients infected with the P.1 variant [73]. These contradictory results can be explained by the much faster rate of spread of VOCs compared to that of the original virus strain or previous variants.
This means that when the number of infected persons in the population increases, the absolute number of severe cases and deaths may also increase. Therefore, the studies based on the community-based testing dataset reported an increase in mortality in patients infected with VOCs. The absolute risk increase affecting individual patients is likely minimal.
Our study has some limitations. We screened papers published only in English and reported in PubMed, Web of Science and Google Scholar. Ongoing research projects have not been used. For example, in our University Hospital Institute, a large cohort study aiming at comparing the demographic and clinical characteristics of patients infected with several new variants of SARS-CoV-2 virus during July to September 2020 is ongoing. In addition, a new variant, L18F, has been recently reported with 1186 spike L18F VOC genomes in the UK.
The weekly growth rate of the L18F increased 1.75-fold, compared with the VOC genomes non-mutated at residue 18 [81]. Additionally, the VOC P1 was significantly associated with lower Ct values and with an increase in positive samples from 0 to 87% in Manaus, Brazil, between 2 November 2020, and 4 January 2021, suggesting high transmissibility [38]. However, the number of infections with these variants remains too small to perform an analysis on their infectivity [38,81].
Nevertheless, our review gives an overview on the relation between SARS-CoV-2 genetic variations and viral infectivity or severity of COVID-19 infection. In conclusion, most studies showed that some genetic variants of the virus were associated with high virus load. However, to date, the evidence of the association between viral mutation and severity of the disease is scant.
On the other hand, severity and outcome of COVID-19 infection depend on the host’s genetic factors, on the treatment and clinical management, which have been improved, and on increased hospital capacity and response speed. The COVID-19 pandemic continues to spread worldwide. It is necessary to anticipate large clinical cohorts to evaluate the virulence and infectivity of SARS-CoV-2 mutants.
reference link : https://doi.org/10.3390/jcm10122635
More information: Miguel A. L. Nicolelis et al, The impact of super-spreader cities, highways, and intensive care availability in the early stages of the COVID-19 epidemic in Brazil, Scientific Reports (2021). DOI: 10.1038/s41598-021-92263-3


