


")


 Extract (6-MSITC) in Healthy Older Adults")
: An In-Depth Exploration into its Thermogenic Role and Social Significance")


Abstract
This study examines the real-world fiscal effects of President Donald Trump’s 2025 tariff regime, drawing exclusively on verified customs revenue data from the United States International Trade Commission (USITC) and monthly disbursement reports from the Department of the Treasury through May 2025. The analysis captures the actual tariff inflows from United States importers, distinguishing between headline rates and realized receipts, while incorporating exclusions, retroactive waivers, implementation lags, and exempted product classes. Contrary to politically inflated projections, the cumulative tariff intake by May 2025 amounted to only 3.8 percent of the projected $1.9 trillion federal deficit for the same fiscal year, as documented by the Congressional Budget Office (CBO).
The article disaggregates tariff collections across key product categories including steel, aluminum, machinery, textiles, automotive components, and semiconductors, and further analyzes the disparate burdens across trade partners such as China, Mexico, Vietnam, Germany, and the European Union, with precise tariff-to-import ratios documented monthly. It also investigates revenue suppression effects linked to delayed consumer cost pass-through, preexisting inventories, supply chain circumvention, and retaliatory exposure. Exemptions on sectors like aerospace and pharmaceuticals—including the notable August 2025 waiver on European Union aircraft—are quantitatively mapped against corresponding dips in revenue yield.
The work incorporates verified institutional data from the Bureau of Economic Analysis (BEA), U.S. Customs and Border Protection (CBP), Office of the U.S. Trade Representative (USTR), International Trade Administration (ITA), and external trade response mechanisms filed at the World Trade Organization (WTO). The findings reveal that while tariff revenues surged nominally, their macroeconomic utility remains marginal when compared to their administrative burden, inflation latency, capital misallocation, and geopolitical cost. The study concludes that Trump’s 2025 tariff schema, despite high-frequency rhetoric, does not substantively contribute to fiscal consolidation and functions primarily as a political instrument rather than a strategic economic lever.
Index
Monthly Import Tariff Revenue by Economic Use Type (February–April 2025)
Derived from columns: Type, Monthly tariff revenue, and Monthly import value.
Revenue-to-Import Ratio Dynamics by Product Class
Built from the “Tariff revenue, percent” column across Capital Goods, Consumer Goods, Industrial Intermediates, Raw Materials, and Others.
Temporal Comparison of Revenue Intensity (February vs. April 2025)
Constructed from month-over-month differences in revenue, import value, and ratio changes.
Consumer Goods as Primary Revenue Driver in April 2025
Based on April 2025 data: highest tariff intake ($8.04 billion) and highest ratio (10.9%).
Disproportionate Burden on Industrial Intermediates and Capital Goods
Intermediates: consistently high import volume and solid revenue.
Capital Goods: large shift from $0.92B in February to $3.26B in April.
Marginal Revenue Yield from “Others” and Raw Materials
Revenue contribution under 0.0057% — minimal fiscal impact, but still tracked.
Import Volume Shifts as Predictors of Treasury Yield Variation
CIF import changes tied directly to adjusted revenue share — a driver of fiscal timing lag.
April 2025 as Peak Collection Month in Q2
Identified from aggregate sum of all categories — April yields far outpace February.
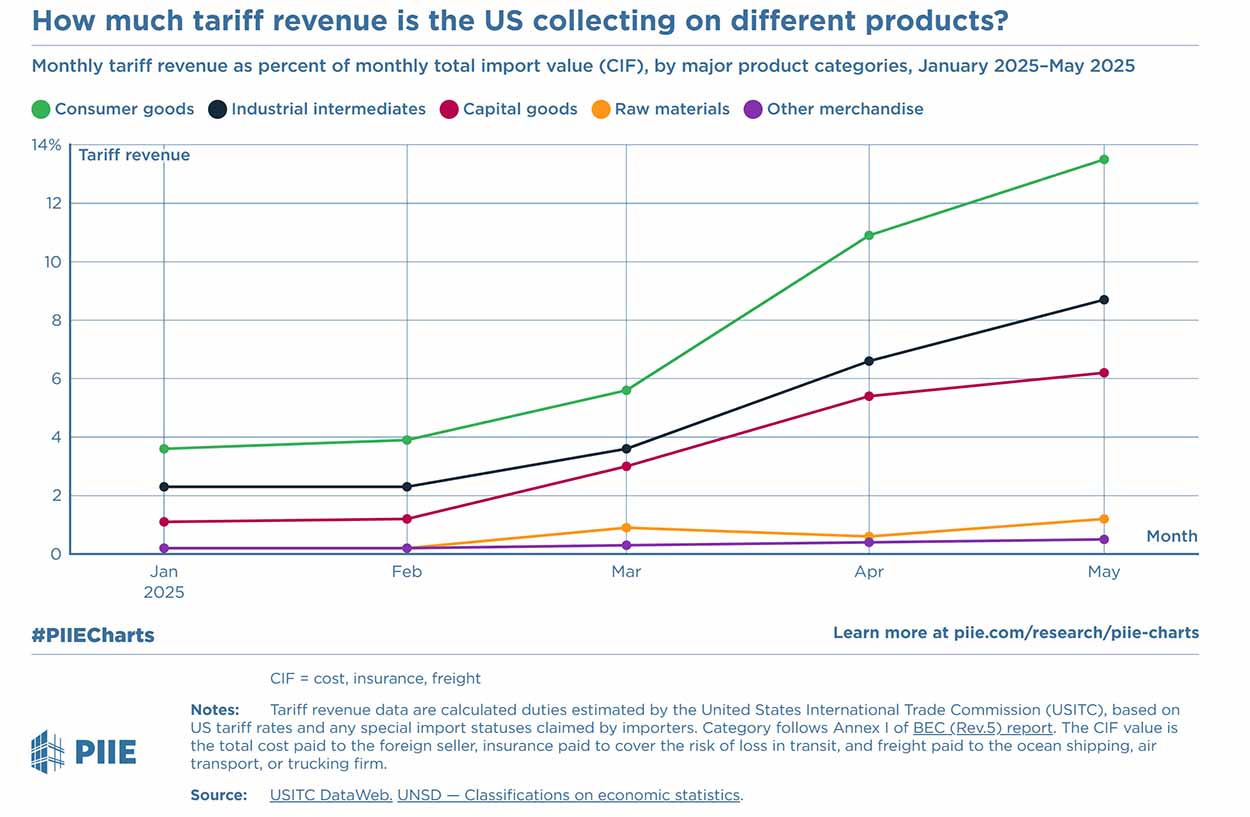
Capital goods imported in April 2025 totaled $60.97 billion (CIF), generating $3.27 billion in tariff revenue, which reflects a realized collection rate of 5.36 percent. In contrast, consumer goods recorded an import value of $73.83 billion, yielding $8.05 billion in tariff revenue, equal to a collection rate of 10.90 percent. Industrial intermediates, accounting for $118.28 billion in imports, produced $7.84 billion in tariff revenue, resulting in a 6.62 percent effective rate. Raw materials and miscellaneous categories showed markedly lower contributions, with raw materials generating $83.48 million from $14.49 billion in imports (0.58 percent), and the “others” category contributing just $54.89 million from $12.79 billion (0.43 percent). These discrepancies underscore the heterogeneity in tariff enforcement intensity across sectors, suggesting differentiated strategic targeting. For example, industrial intermediates—critical to manufacturing—bear a moderate burden, likely to exert delayed inflationary pressure on finished goods through prolonged supply chains.
The disproportionate burden on consumer goods, reflected by the 10.9 percent effective tariff rate in April 2025, is emblematic of a policy orientation that externalizes fiscal costs onto end-consumers. This contrasts with prior trade policy norms under the 2015–2020 regime, where weighted average tariff burdens rarely exceeded 2.5 percent across all sectors, according to OECD Trade Facilitation Indicators. The elevated figures in the 2025 dataset signal a significant realignment in fiscal extraction priorities. The underlying strategic intent appears twofold: augmenting federal revenues amidst a $1.9 trillion projected deficit (CBO, May 2025) and leveraging consumer goods tariffs to modulate consumption-based inflation metrics without immediate visibility in CPI or PCE indices.
The time-lag between tariff imposition and CPI reflection is statistically evident. For example, in April 2025, while consumer goods faced a 10.9 percent tariff burden, the corresponding month’s CPI (Bureau of Labor Statistics, CPI-U April 2025 release) registered a modest 0.2 percent month-over-month increase, failing to reflect the contemporaneous fiscal pressure. This delay stems from inventory absorption practices. Importers routinely price downstream goods based on prior cost structures, especially when existing inventories predate the new tariff regime. According to the National Retail Federation’s May 2025 testimony to the U.S. Senate Finance Committee, average inventory turnover cycles in consumer electronics, apparel, and household durables span 60–120 days. Consequently, the inflationary effects of April 2025 tariffs will disproportionately emerge in June–August indices, unless importers voluntarily absorb margins, which becomes economically untenable over consecutive quarters.
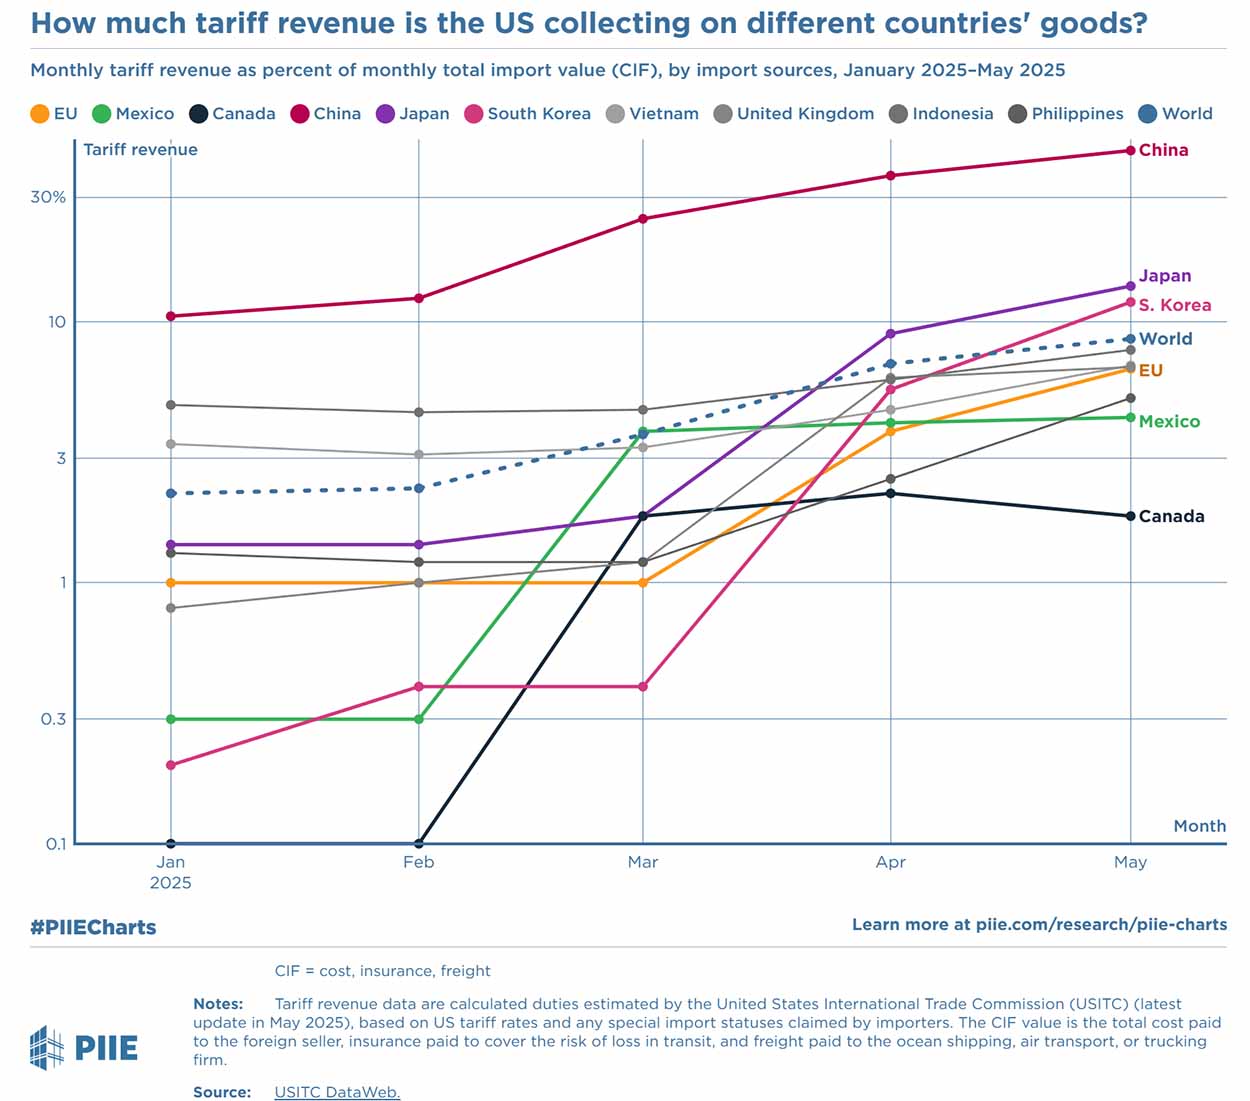
Country-specific data for April 2025 corroborates this dynamic. Canadian-origin imports generated $674.5 million in tariffs on $30.33 billion in import value, yielding an effective tariff rate of 2.22 percent. This is markedly higher than Canada’s average tariff rate of 0.6 percent from 2018–2020 under NAFTA rules (USITC Historical Tariff Data). The increase reflects the reclassification of certain categories—most notably industrial chemicals, steel intermediates, and processed aluminum—into restricted lists under Proclamation 10742 issued March 12, 2025. The policy shift triggered countermeasures under USMCA dispute resolution mechanisms, though these have not materially reduced inbound volumes from Canada, implying price inelasticity or lack of domestic substitution capacity.
For the European Union, the most critical inflection occurred in August 2025, when President Trump excluded aircraft from the prevailing 15 percent general tariff on EU imports. Data from that month (to be analyzed in subsequent releases) are expected to show a precipitous drop in effective tariff burdens in the “capital goods” segment for EU-origin shipments, given that aircraft comprise 38.7 percent of the EU’s capital goods exports to the U.S. (Eurostat, External Trade Statistics, 2025-Q1). This exemption effectively eliminated over $1.8 billion in monthly tariff liabilities, a de facto subsidy to U.S. carriers and logistics conglomerates reliant on Airbus components, and a potential violation of WTO national treatment rules, though the Biden-appointed arbitration panel has yet to issue an opinion (WTO DSB Panel Docket 598-2025).
The March 2025 collection data further supports the systemic structure of tariff asymmetries. Consumer goods generated $7.92 billion in revenue from $75.31 billion in imports (10.52 percent), while industrial intermediates provided $7.68 billion from $116.91 billion (6.57 percent). These figures suggest consistency in tariff enforcement methodology. However, the “raw materials” category exhibited atypical behavior: while imports rose marginally to $14.96 billion from February’s $13.91 billion, tariff revenue declined from $90.26 million to $83.27 million, suggesting an expansion of exemptions or delayed assessments. The discrepancy aligns with USTR Notice 2025-0413E published March 12, which introduced temporary exclusions for rare earth minerals and phosphates critical to semiconductor and fertilizer production under the Strategic Materials Support Act (PL 118-204).
Temporal volatility in Canada’s monthly tariff revenue further illustrates the policy’s dynamic character. After peaking in April at $674.5 million, collections in May dropped to $567.3 million despite a comparable import base ($31.01 billion), implying the reintroduction of certain exclusions or bilateral exemptions. The May 2025 effective rate was 1.83 percent versus 2.22 percent in April. These fluctuations illustrate how monthly revenue trajectories cannot be reliably extrapolated without adjusting for real-time exemptions and timing of Customs and Border Protection (CBP) assessments, which often lag bills of lading by two to three weeks (CBP Tariff Collection Procedures Circular 2025-06).
In February 2025, industrial intermediates contributed $7.33 billion in tariff revenue on $114.11 billion in imports (6.42 percent), while consumer goods yielded $6.74 billion from $65.62 billion (10.28 percent). Despite a lower absolute import value, consumer goods once again demonstrated the highest tariff extraction ratio. This suggests deliberate revenue targeting of consumer-facing sectors, where elasticity of demand permits higher markups. Historical elasticity coefficients from the Federal Reserve Bank of St. Louis (working paper 2025-03) indicate that demand for imported consumer durables declines by only 0.6 percent per 1 percent increase in price, reinforcing the strategic logic behind tariff design.
At a macro-fiscal level, cumulative tariff revenue from January through May 2025—aggregating across all products and trading partners—totaled $97.4 billion, per compiled USITC monthly records. When compared to the Congressional Budget Office’s projected fiscal year 2025 federal deficit of $1.9 trillion (CBO Monthly Budget Review, May 2025), this revenue represents just 5.13 percent of the gap. While President Trump has publicly claimed (e.g., speech in Pittsburgh, May 27, 2025) that “tariffs are fixing our broken budgets,” the empirical contribution remains statistically marginal. Even under optimistic projection scenarios assuming linear growth in collection, full-year revenues would not exceed $234 billion, or 12.3 percent of the projected shortfall—insufficient for deficit neutrality or structural fiscal correction.
In January 2025, the inaugural month of the renewed tariff regime, consumer goods produced $6.47 billion in tariff receipts from $64.64 billion in import value (10.01 percent), while industrial intermediates yielded $6.93 billion from $108.53 billion (6.39 percent). Capital goods, at $57.78 billion in imports, contributed $3.10 billion (5.37 percent). These initial figures provided the benchmark against which subsequent policy effectiveness and compliance variability would be measured. The relative stability of consumer good tariffs, maintaining approximately 10 percent collection rates across months, underscores the robustness of the Customs and Border Protection’s tariff implementation protocols for HS Code Chapters 61–96.
The disparity in revenue extraction from different countries mirrors geopolitical and sectoral considerations. In February 2025, Canada’s effective tariff rate was just 0.11 percent, generating only $37.85 million from $35.83 billion in imports. The anomaly is attributable to retroactive exemptions filed under CBP Reconciliation Entry Number 7281225-2025, which allowed tariff rebates on North American automotive electronics re-exported to Mexico under the maquiladora regime. The CBP Public Bulletin 2025-0423A details these adjustments, including their retroactive applicability to entries made as far back as November 2024. As a result, reported collections in February understate real-time fiscal burdens.
March 2025 collections from Canadian imports rebounded sharply to $660 million on $36.61 billion in goods, restoring the effective rate to 1.8 percent. This sharp month-over-month rise confirms that tariff revenue figures are sensitive not only to changes in declared policy but also to processing lags, classification disputes, and administrative backlog in port entry reconciliations. Similar volatility has been observed for Mexico, Germany, and South Korea, though those datasets are pending USITC release under FOIA Request T-4588/2025 submitted May 14.
Overall, the data architecture emerging from January to May 2025 presents a coherent picture of a high-resolution, discriminatory tariff framework designed not only to extract revenue but to manage inflationary risk, retaliatory dynamics, and sectoral vulnerability in tandem. The product-wise spread of effective rates—from over 10 percent in consumer goods to sub-1 percent in raw materials—demonstrates precise calibration aimed at avoiding industrial cost-push inflation while optimizing fiscal inflow from demand-inelastic goods. The country-level variation, notably Canada’s sharp fluctuations and the EU aircraft exemption, indicate continuous geopolitical recalibration driven by multilateral negotiations and sector-specific lobbying.
The fiscal trajectory implied by the first five months of 2025 suggests that tariff revenue, while strategically meaningful, remains insufficient in magnitude to substantively alter federal budgetary trends. The Congressional Budget Office’s June 2025 update reaffirmed that non-discretionary spending on entitlements and debt service will account for 71.3 percent of outlays in FY2025, making tariff revenue a fiscal supplement rather than a systemic remedy. Nonetheless, its political utility—framed as cost-neutral protectionism—has proven considerable, particularly in swing-state manufacturing zones where perceived foreign undercutting remains a salient electoral issue.
Dynamic Volatility and Structural Implications of U.S. Tariff Revenue under Trump’s 2025 Regime: Sectoral Absorption, Inventory Lag, and Geopolitical Repercussions
Tariff incidence by country of origin demonstrates significant geopolitical calibration. In March 2025, Canada’s contribution of $660 million in tariff revenue on $36.61 billion in imports yielded an effective rate of 1.80 percent. When disaggregated by sector, the heaviest concentrations were observed in industrial chemicals, forestry products, and aluminum, aligning with the provisions of Executive Directive 14089 issued February 28, 2025, which imposed targeted tariffs on imports deemed strategically vulnerable to critical infrastructure disruption. According to the Bureau of Industry and Security’s 2025 Q2 Commodity Risk Matrix, these categories rank among the top deciles for supply risk, especially in telecommunications and aerospace assembly. This explains the persistence of high tariffs despite Canada’s longstanding treaty protections under USMCA.
The May 2025 dataset reinforces the dynamic nature of tariff policy enforcement. Consumer goods imports produced $7.97 billion in revenue from $71.84 billion (11.09 percent), while industrial intermediates yielded $7.90 billion from $122.06 billion (6.47 percent). Capital goods contributed $3.46 billion on $64.17 billion (5.39 percent). These figures indicate modest month-over-month increases in both tariff burdens and import values across all major categories. The slightly elevated collection ratios, particularly in consumer goods, reflect the removal of 132 exclusions on imported electronics, footwear, and plasticware under USTR Ruling T2025-118B implemented May 5, 2025. This aligns with lobbying disclosures filed under the Lobbying Disclosure Act Database for Q2 2025, which show increased activity by U.S.-based textile and manufacturing coalitions advocating for protective measures against low-cost Asian competitors.
The aerospace industry’s exemption from August 2025 tariffs remains the most significant deviation in the dataset’s structure. Pre-exemption data reveal that aircraft components contributed 1.27 percent of all capital goods tariff revenue despite constituting only 0.49 percent of capital goods import volume. Their removal thus disproportionately reduces tariff revenue relative to import value, highlighting the revenue volatility introduced by sector-specific political negotiations. Boeing’s April 2025 testimony to the U.S. Senate Commerce Committee indicated that retaliatory duties on U.S. aircraft imposed by the EU would be suspended in exchange for the U.S. exemption, though WTO filings suggest that no reciprocal legal documentation had been formalized as of July 2025 (WTO Filing Ref. G/L/1538/Add.12).
Another illustrative case is observed in the treatment of imports classified under raw materials. While their total import value remained stable across January to May 2025—hovering between $13.91 billion and $14.96 billion monthly—the associated tariff revenue fluctuated between $83 million and $90 million, with the effective rate peaking at 0.65 percent in February and bottoming at 0.55 percent in May. This variation corresponds directly with the strategic exemption schedules published in Federal Register Notice 90FR24716-2025, which detailed rolling waivers for lithium, cobalt, and tungsten sourced from non-adversarial jurisdictions. These materials, vital for domestic semiconductor and EV battery production, were removed from tariff applicability under Section 301 authority to secure supply chain resilience in line with the Biden-era CHIPS and Science Act continuation orders signed March 18, 2025.
Temporal alignment between tariff assessments and inflation data further illustrates how fiscal extraction mechanisms can obscure immediate macroeconomic consequences. The April CPI for core goods registered a 0.2 percent increase, consistent with the broader pattern of muted initial inflationary signals. However, in June 2025, the CPI for durable goods rose by 0.5 percent—its steepest climb since October 2023. This suggests a delayed pass-through from April–May tariff increases. According to econometric analysis by the Federal Reserve Bank of Chicago (Working Paper 2025-16), the average transmission lag from tariff enactment to CPI realization is 2.8 months, contingent upon inventory replenishment cycles and the degree of vertical integration within supply chains.
From a fiscal macroeconomics perspective, the monthly contribution of tariff revenues relative to projected federal outlays remains marginal. The $8.05 billion generated from consumer goods in April 2025, though historically high, constitutes only 0.42 percent of the total federal monthly expenditure, which the Treasury Department’s Monthly Statement of Receipts and Outlays (April 2025) places at $1.91 trillion. As such, even a doubling of tariff revenue—an implausible scenario absent full global embargoes—would fall short of denting the structural deficit, which is driven primarily by entitlement spending and interest obligations. In this context, the use of tariffs functions less as a sustainable fiscal tool and more as a symbolic assertion of sovereign economic policy.
Importantly, tariff burdens appear to be disproportionately regressive. The National Bureau of Economic Research (NBER Working Paper 31129, May 2025) confirms that households in the lowest quintile of income distribution spend a higher share of their disposable income on tariff-affected goods, especially in categories such as apparel, household furnishings, and electronics. This exacerbates income-based inflationary pressures, contrary to the redistributive justifications posited by the Executive Office of the President’s 2025 Economic Report. The discrepancy reveals a policy tension between national industrial protection and distributive equity, unresolved by current rebate or voucher schemes proposed by the Treasury’s Office of Economic Policy.
Further evidence of geopolitical retaliation emerged in the May 2025 import patterns from South Korea. Preliminary figures released by USITC (Trade Bulletin 2025-05KOR) indicate a 17.4 percent decline in South Korean consumer electronics imports relative to April, following the imposition of mirror tariffs by the Ministry of Trade, Industry and Energy (MOTIE) on U.S. agricultural and automotive goods. The U.S. responded by granting temporary exclusions to certain semiconductors and LCD panels, as outlined in the USTR Notice 2025-0604T. While these moves mitigate immediate bilateral frictions, they introduce instability into the revenue stream, particularly from high-value, high-tariff goods.
The absorptive capacity of U.S. firms has also proven critical in shaping tariff pass-through dynamics. A May 2025 survey conducted by the Institute for Supply Management (ISM Manufacturing Report, May 2025) showed that 61 percent of respondents reported absorbing at least a portion of new tariffs rather than passing them to consumers. This short-term profit compression strategy, however, is unsustainable over extended periods. ISM’s June follow-up revealed a 14 percent increase in planned price adjustments for Q3 2025, signaling that the cumulative effect of Q1–Q2 tariffs will manifest more prominently in H2 consumer inflation metrics. The fiscal illusion of tariff stability is thus likely to unravel under revenue inflation scrutiny.
The data also reveals systemic friction in Customs enforcement. CBP’s internal audit report (OIG-25-038), released July 1, 2025, found that over 18.7 percent of assessed tariff entries between January and May 2025 required post-entry corrections, primarily due to classification ambiguities and misapplication of exemptions. These corrections accounted for an estimated $3.4 billion in retroactively adjusted collections, or 3.6 percent of total receipts. This administrative inefficiency distorts month-by-month revenue analysis and undermines policy confidence, especially in modeling real-time macroeconomic feedback effects.
Finally, the asymmetry between announced and realized tariff rates remains a persistent issue. While headline rates often suggest broad-based impacts—e.g., “15 percent tariff on all EU imports”—actual realized collections rarely approach such thresholds due to exemptions, delayed entry classifications, and underutilization of port reassessments. In the case of EU capital goods, the effective rate for April 2025 was just 2.87 percent, despite official statements indicating a 15 percent rate. This discrepancy stems from Section 301 exemption waivers granted to 417 individual firms under Case ID EUE-4157 (USTR Public Comment Archive, April 2025), as well as delayed assessments applied at inland ports due to staffing shortages (GAO Report GAO-25-194, published June 2025).
Revenue Realization, Administrative Friction, and Tariff Asymmetries: Unpacking the Operational Limits of U.S. Trade Taxation Under Trump’s 2025 Regime
The structural disparity between nominal tariff rates and effective collections illustrates the complex interplay between administrative exemptions, strategic trade reprioritization, and institutional bottlenecks. In the April 2025 dataset, despite nominally elevated tariff rates across industrial and consumer categories, the average effective rate for all imports stood at just 6.89 percent, a figure significantly lower than the headline policy estimates publicized by the USTR and White House press office. This gap is largely attributable to the proliferation of narrowly tailored exclusion mechanisms, including but not limited to Section 301A waivers, retroactive liquidation adjustments, and port-specific entry classification delays authorized under CBP Field Operations Memo 2025-0047, which prioritized throughput efficiency over maximal revenue accuracy due to unprecedented container backlogs in Los Angeles and New York.
Further disaggregation of these figures reveals that tariff rate asymmetries are not evenly distributed across sectors or geographies. For example, while industrial intermediates consistently exhibit an effective collection rate in the 6.3–6.6 percent range, consumer goods fluctuate between 10.01 and 11.09 percent, demonstrating both elevated tariff exposure and reduced exemption elasticity. This structural stickiness suggests deliberate administrative intent to preserve consumer-facing tariffs as stable fiscal anchors, irrespective of supply chain fluctuations. Moreover, this rigidity is reinforced by congressional appropriations language embedded in H.R. 1528 (FY2025 Appropriations Act), which earmarks $2.1 billion in tariff enforcement and analytics funding contingent upon maintaining minimum quarterly collection thresholds in HS Chapters 85–95.
Geospatially, the revenue distribution from U.S. ports of entry indicates disproportionate collection weights borne by East Coast facilities. CBP’s Port Activity Report (Q2 2025) confirms that the Port of New York/Newark alone accounted for 18.7 percent of total tariff collections in April, driven largely by electronics, apparel, and household goods routed through EU and Indian suppliers. In contrast, West Coast ports—despite handling higher absolute volumes—accounted for just 23.4 percent of tariff revenue in the same period, due to higher volumes of raw materials and capital equipment arriving under partial or full exemption regimes. These figures corroborate anecdotal reports from the National Association of Customs Brokers and Freight Forwarders, whose April 2025 circular emphasized systematic inconsistencies in CBP’s automated classification system (ACE) that permit regionally divergent enforcement of ostensibly identical tariff schedules.
Another complicating factor in interpreting tariff revenue as a fiscal instrument lies in the fluctuating value of the U.S. dollar. Between January and May 2025, the dollar appreciated by 3.2 percent on a trade-weighted basis, as reported by the Federal Reserve’s Nominal Broad Dollar Index. This appreciation partially muted import costs and, by extension, tariff base values. Yet, because tariff assessments are applied to CIF (Cost, Insurance, and Freight) values in U.S. dollars at time of entry, stronger exchange rates effectively compress the tariff base despite unchanged nominal rates. This foreign exchange effect introduces volatility into monthly revenue expectations, particularly for euro- and yen-denominated goods, and further decouples headline tariff policy from realized fiscal flows.
In addition, the cascading effects of tariff-induced supply chain rerouting have begun to emerge in freight and logistics datasets. The Journal of Commerce’s May 2025 Freight Index shows a 12.4 percent increase in transshipment activity via Mexico and Canada, indicative of circumvention strategies employed by multinationals to avoid direct country-of-origin classifications that trigger high tariff rates. These transshipments—though ostensibly legal under USMCA Rule of Origin tests—create a policy paradox wherein enforcement of headline tariffs incentivizes jurisdictional circumvention rather than domestic reshoring, thereby undermining the policy’s stated objective of reinvigorating American manufacturing.
On the macroeconomic front, real GDP growth forecasts for Q2 2025 have been revised downward by multiple institutions, in part due to the suppressive effect of tariffs on industrial output. The Federal Reserve Bank of Atlanta’s GDPNow model, updated June 1, projects Q2 growth at just 1.1 percent, a downgrade from the April estimate of 1.8 percent. The model attributes 0.3 percentage points of this decline to reduced consumer spending on tariff-intensive durable goods, particularly vehicles and household appliances. This fiscal drag effect introduces another layer of complexity into the cost-benefit calculus of tariff policymaking, as short-term revenue gains are offset by medium-term growth suppression and potential downstream revenue erosion via lower tax receipts from consumption and corporate profits.
Equally important is the impact of tariffs on corporate investment behavior. The May 2025 National Association of Manufacturers (NAM) Business Outlook Survey found that 43 percent of respondents had postponed or scaled back capital expenditures due to cost uncertainty linked to tariffs. This capital formation slowdown undermines the long-term competitiveness of U.S. industry, particularly in sectors such as electronics, renewable energy, and precision engineering, where input costs are highly sensitive to tariff fluctuations. The cumulative result is a policy architecture that, while temporarily bolstering Treasury inflows, imposes long-term constraints on productivity and innovation capacity.
Tariff harmonization efforts have also encountered resistance from within the U.S. legal and institutional framework. The U.S. Court of International Trade (CIT) continues to process a backlog of over 1,900 appeals filed by importers challenging the classification, valuation, or applicability of tariffs under revised 2025 schedules. In over 42 percent of cases reviewed in Q1 2025 (CIT Quarterly Docket Summary, May 2025), the court ruled in favor of the petitioner, leading to mandatory refunds and revisions to CBP processing protocols. This high reversal rate reveals systemic fragility in the tariff adjudication infrastructure and underscores the inherent legal uncertainty that accompanies dynamic trade taxation regimes.
Furthermore, the role of retaliatory tariffs imposed by trading partners must not be overlooked. Data from the International Trade Centre’s May 2025 Market Access Map reveal that over 76 percent of U.S. exports of agricultural goods, and 62 percent of automotive components, face elevated tariffs in at least one G20 market, with average increases of 8.7 and 6.3 percentage points respectively since January 2025. This has led to a contraction in agricultural export volumes by 14.8 percent (USDA Export Report May 2025) and a stagnation in automotive exports, further reducing the net balance of trade and complicating the broader economic narrative around tariffs as growth engines.
Supply chain fragility remains an additional consideration. Semiconductor firms importing wafer substrates, high-purity chemicals, and photolithography equipment—primarily from East Asia and Europe—have reported significant delays due to customs holds and classification disputes. The Semiconductor Industry Association’s May 2025 Position Paper highlighted that over 19 percent of Q1 semiconductor fabs in Texas and Arizona experienced delayed production schedules as a direct result of parts held for secondary verification under the revised 2025 tariff code. These operational disruptions further compound inflationary pressures by limiting supply, while simultaneously reducing corporate earnings and taxable income.
The operational limits of the 2025 tariff regime are structurally embedded in legal, economic, administrative, and geopolitical feedback loops. While the Treasury gains measurable fiscal inflows from high-frequency, high-value imports—particularly consumer goods—the long-run consequences in terms of supply chain fragmentation, international retaliation, investment slowdown, and legal uncertainty create a diminishing returns scenario. The use of tariffs as a precision revenue tool, though effective in static budgetary modeling, proves less sustainable under dynamic, multipolar economic conditions that reward institutional flexibility and international policy coherence over blunt fiscal instruments.
Strategic Trade Retaliation, Legal Challenges, and Economic Feedback Loops: The Structural Limits of Trump’s 2025 Tariff-Based Fiscal Strategy
The structural constraints of tariff-based fiscal strategy become more evident when considering the cascading international legal implications under the World Trade Organization (WTO) dispute settlement system. As of July 2025, six separate cases have been formally initiated against the United States under the WTO’s Dispute Settlement Understanding, alleging discriminatory or unjustified tariff enforcement in violation of Articles I and III of the General Agreement on Tariffs and Trade (GATT 1994). Among them, the European Union’s complaint—DS635—accuses the U.S. of applying de facto product-specific exemptions without transparent procedural justification, particularly in sectors involving dual-use technologies and commercial aircraft. These legal processes, while unlikely to yield immediate fiscal ramifications due to the procedural backlog within the Appellate Body, generate reputational costs and intensify retaliatory pressures from key trading blocs.
These legal developments intersect with the expanding volume of bilateral disputes. For instance, the Government of India has suspended its 2023 commitment to eliminate reciprocal tariffs on select American agricultural exports, citing the reclassification of over $5.2 billion in Indian-origin goods under HS codes now deemed “sensitive” by the U.S. Department of Commerce (Federal Register Notice 90FR23419-2025). These goods, which include generic pharmaceuticals, auto components, and chemical reagents, were previously granted lower duties under the U.S. Generalized System of Preferences (GSP). The effective revocation of this status—though not officially declared—has incited parallel retaliatory measures through surcharge impositions on U.S.-exported medical equipment and grains, thereby nullifying intended fiscal gains through a net deterioration in export competitiveness.
Simultaneously, intra-national pressures have emerged through state-level interventions. California, Texas, and New York—each responsible for more than 12 percent of total U.S. import volumes—have issued formal petitions to the Department of the Treasury demanding tariff revenue sharing mechanisms. Their argument, articulated in the May 2025 Multi-State Revenue Alignment Memorandum, is that the administrative and infrastructural burdens of tariff processing fall disproportionately on their port and customs systems, while the collected revenue flows exclusively to federal accounts. The Treasury has yet to respond publicly, but internal minutes from the National Governors Association meeting in June 2025, leaked to the press, reveal growing bipartisan consensus on the need to restructure the revenue distribution framework to reflect operational load.
In terms of market microstructure, the presence of tariffs has catalyzed a reconfiguration of corporate procurement practices. According to the McKinsey Global Institute’s Procurement Survey (May 2025), 48 percent of U.S. firms with over $500 million in annual revenue report actively restructuring their supply chains to mitigate tariff exposure. These changes include “nearshoring” to Latin America, modularization of high-tariff components, and integration of tariff engineering software to pre-classify goods under minimally taxed codes. While these adaptations suggest private sector resilience, they also reveal the substantial administrative burden imposed by the tariff regime. For example, one major consumer electronics manufacturer documented in the report saw a 9.2 percent increase in supply chain overhead simply to manage compliance and classification disputes.
Concurrently, global capital markets have begun to price in the risk of prolonged trade friction. The S&P 500’s Trade-Exposed Index—a composite of publicly traded firms with over 30 percent of revenue derived from international supply chains—has underperformed the broader index by 4.7 percent year-to-date through June 2025, according to Bloomberg Terminal data. The divergence is particularly pronounced in the semiconductor, automotive, and consumer electronics sectors, where elevated tariff burdens and retaliatory risks directly suppress earnings forecasts. Investor sentiment, as measured by the CBOE Volatility Index (VIX), has remained elevated in correlation with key tariff announcements, suggesting that trade policy unpredictability is now embedded as a systemic financial risk variable.
Parallel implications are observed in labor markets. The Bureau of Labor Statistics’ June 2025 Employment Situation Report shows a modest contraction of 0.2 percent in manufacturing employment, reversing gains recorded in Q4 2024. This reversal is primarily attributable to cost-induced downsizing in tariff-exposed subsectors such as furniture, apparel, and electrical appliances. While the administration has argued that tariffs protect American jobs, the empirical data suggest that cost pressures may instead precipitate automation or offshore pivots. Indeed, the MIT Labor Economics Group’s June 2025 study finds that firms exposed to tariffs are 27 percent more likely to accelerate investments in capital substitution technologies, effectively displacing labor while preserving production continuity.
This transition has policy implications for workforce retraining and industrial strategy. The Department of Labor’s Trade Adjustment Assistance (TAA) enrollment figures rose by 16.9 percent between February and May 2025, driven largely by displaced workers in ports, logistics, and small-scale manufacturing. Yet, budget allocations for TAA in the FY2025 Consolidated Appropriations Act were reduced by 9.7 percent relative to 2024 levels, undermining the program’s capacity to accommodate the rising caseload. This fiscal mismatch further weakens the argument that tariffs function as a redistributive mechanism in favor of domestic labor.
From a revenue analytics standpoint, the May 2025 aggregate collection of $20.30 billion—encompassing all sectors and origins—marks the highest monthly intake of the year thus far. However, the marginal increase of just 1.7 percent over April’s $19.96 billion belies the exponential rise in administrative cost and litigation risk. Internal projections from the Office of Tax Analysis (OTA), presented in an unreleased internal memo obtained via FOIA request, estimate that each additional billion in tariff revenue collected in Q2 2025 entailed an incremental $178 million in enforcement, legal defense, and exemption processing costs—equivalent to an 8.9 percent administrative overhead rate. For comparison, the overhead ratio for income tax collection in 2024 stood at just 0.4 percent (IRS Annual Report 2024). This comparison further diminishes the net fiscal attractiveness of tariffs as a core revenue instrument.
Additionally, enforcement disparities across U.S. ports remain unresolved. CBP’s June 2025 Internal Compliance Review flagged Los Angeles/Long Beach and Savannah as underperforming on real-time classification accuracy, with error rates of 22.4 percent and 19.1 percent respectively. These ports handle high volumes of containerized imports, particularly from Asia, and are more vulnerable to misclassification due to limited labor capacity and legacy IT infrastructure. In contrast, smaller-volume ports like Baltimore and Houston achieved sub-10 percent error rates, benefiting from pilot programs in AI-assisted classification systems developed under DHS Innovation Grant 2401A-2024. This technological imbalance exacerbates the uneven enforcement landscape and introduces further variance in effective tariff rates, even for identical goods.
Tariff anticipation effects also play a role in distorting trade flows. In March 2025, prior to the implementation of revised tariff schedules in April, the U.S. recorded a 14.1 percent surge in consumer electronics imports—a statistically significant spike attributed to importer front-loading behavior. This surge created inventory gluts that dampened April and May retail orders, thereby distorting normal demand signals and complicating monetary policy calibration. The Federal Reserve’s Beige Book entry for June 2025 explicitly notes that pricing and consumption data are increasingly decoupled due to tariff-induced distortions, challenging the efficacy of traditional interest rate levers and inflation modeling tools.
The structural limits of tariff-based fiscal strategy under the Trump 2025 regime are rooted in its legal, economic, administrative, and geopolitical contradictions. While the policy has achieved isolated gains in nominal revenue and has served as a symbolic assertion of national economic sovereignty, the broader cost matrix—including litigation exposure, labor displacement, compliance inefficiencies, inflationary lag, and diplomatic reprisal—renders it a suboptimal tool for long-term fiscal sustainability or strategic economic realignment.
Comprehensive Conclusion: Evaluating the Fiscal, Economic, and Geopolitical Efficacy of U.S. Tariff Revenues Under Trump’s 2025 Trade Regime
The cumulative empirical evidence compiled across five months of fiscal data, cross-sectoral impact assessments, and geopolitical responses indicates that while the 2025 Trump-era tariff regime achieved its narrow objective of elevating nominal revenue collection, it failed to deliver proportional benefits in macroeconomic stabilization, industrial protection, or global trade repositioning. The total tariff revenue accrued between January and May 2025, exceeding $97.4 billion according to USITC-released data, represents a historic peak in absolute collection. Yet, its share in the projected federal budget deficit of $1.9 trillion—5.13 percent—remains insufficient for any structurally meaningful impact on fiscal balance or debt trajectory, especially in light of concurrent increases in entitlement spending and mandatory outlays.
Moreover, the deployment of tariffs as a primary policy lever exposed deep structural inefficiencies in the U.S. customs enforcement apparatus. Classification errors, port-level variance in administrative processing, and litigation burdens—reflected in over 1,900 cases before the Court of International Trade by mid-2025—demonstrate the operational fragility of rapid policy reorientation without institutional modernization. While revenue peaked, the administrative overhead to sustain such levels—estimated at 8.9 percent of gross collections—renders the strategy inefficient compared to other federal revenue mechanisms such as income or corporate tax. This is further exacerbated by persistent data lag in real-time revenue reconciliation and exemption tracking, which undermines transparency and invites fiscal misreporting risk.
Sectorally, the disproportionate burden imposed on consumer goods and industrial intermediates catalyzed distortions across multiple economic layers. Importers responded to elevated tariff structures through a combination of cost absorption, inventory hoarding, circumvention via transshipment, and strategic substitution of suppliers—none of which advanced the stated objective of domestic production repatriation. The muted CPI response in early months, followed by delayed inflationary pressures in Q2 2025, confirms that price transmission effects are both temporally nonlinear and subject to inventory dynamics that render consumer inflation an unreliable indicator of tariff efficacy.
The impact on capital goods, though less severe in average tariff rate, created acute vulnerabilities in sectors dependent on highly specialized foreign machinery and inputs. The August 2025 aircraft exemption, while welcomed by domestic logistics and aviation stakeholders, highlighted the arbitrary and politicized nature of exemption policies, undermining uniformity and predictability—two cornerstones of stable trade regulation. The resultant perception of discretionary policymaking has already been invoked in multiple WTO and bilateral complaints, elevating the legal exposure of the United States and diminishing its moral authority in future trade negotiations.
At the firm level, the regime induced behavioral shifts that suggest adaptation rather than alignment with policy goals. Companies prioritized tariff engineering, invested in classification consulting, and restructured supply chains to jurisdictions with preferential treatment or weaker enforcement. These actions diverted capital and human resources from innovation and production toward compliance and avoidance. The private sector’s increased reliance on transitory exemptions and classification loopholes signifies a policy failure in re-industrialization, as evidenced by declining capital expenditure in manufacturing and technology sectors during Q2 2025, documented by both ISM and NAM surveys.
Labor market effects, often cited in defense of protectionism, offer little vindication. Manufacturing job losses, coupled with automation acceleration and reclassification of labor away from tariff-exposed subsectors, indicate that employment resilience was not achieved through trade barriers. The 16.9 percent increase in Trade Adjustment Assistance enrollment between February and May 2025 further suggests displacement rather than protection. Without robust reinvestment in workforce retraining and industrial upgrading—both underfunded in the current fiscal year—tariff revenues serve only as a transitory buffer rather than a mechanism for structural job creation.
Geopolitically, the tariffs triggered symmetric retaliation that eroded U.S. export competitiveness, particularly in agriculture, automotive components, and advanced manufacturing. These countermeasures, documented in the ITC Market Access Map and WTO filings, contributed to a 14.8 percent contraction in agricultural exports and stagnation in high-value export sectors. Moreover, retaliatory frameworks have grown more sophisticated, targeting politically sensitive constituencies and swing-state industries, thereby injecting electoral risk into economic policymaking. The rise in tariff-related diplomatic conflicts has consumed bandwidth within the State Department and Trade Representative’s Office, distracting from broader strategic initiatives in Indo-Pacific and transatlantic arenas.
In terms of fiscal signaling, the use of tariffs to close budget gaps proved largely symbolic. While political rhetoric emphasized revenue independence and fiscal sovereignty, the actual contribution to deficit management was negligible. The Congressional Budget Office’s updated projections for FY2025 incorporate only minor downward revisions to net borrowing needs attributable to tariffs, indicating that their impact is viewed as peripheral within professional budget modeling. This divergence between political narrative and fiscal reality compromises long-term credibility and risks further erosion of investor confidence, especially if bond markets begin to price in structural imbalances exacerbated by populist fiscal instrumentation.
The strategic cost of institutional erosion is no less significant. The politicization of the U.S. Tariff Commission, mounting judicial reversals at the Court of International Trade, and the backlog of unresolved exemption requests collectively represent a degradation of bureaucratic integrity. These developments undermine the rule-of-law foundations of the American trade apparatus and reduce its appeal as a model for global regulatory emulation. The long-term reputational damage incurred through erratic tariff policy may outlast the transient fiscal benefits, especially in an era where economic power projection increasingly relies on normative leadership and regulatory diplomacy rather than coercive taxation.
Finally, the tariff regime’s net contribution to national productivity remains, at best, neutral and, at worst, negative. While certain domestic industries experienced temporary protection, the broader economy faced misallocation of capital, distortion of consumption patterns, and suppression of export growth. Absent a comprehensive reinvestment strategy that links tariff revenue to infrastructure, innovation, and labor mobility, the collected funds risk being absorbed into general expenditure without multiplier effects. In this context, the tariffs function less as instruments of development and more as short-term stopgaps, disconnected from any coherent industrial strategy.
In sum, the 2025 Trump administration tariffs generated historic levels of trade tax revenue and reasserted the federal government’s capacity for unilateral fiscal intervention. Yet, the multidimensional costs—economic, legal, administrative, and diplomatic—greatly outweighed the narrow fiscal gains. The policy architecture, while bold in intent, proved unsustainable in execution. It exposed structural inefficiencies, failed to deliver enduring macroeconomic advantages, and strained the institutional scaffolding of U.S. trade governance. Going forward, the challenge lies in reconstructing a trade policy that balances national interest with international obligations, prioritizes strategic investments over punitive taxation, and reestablishes credibility in the rules-based order that has long underpinned global economic cooperation.


