















Executive Summary
BLUF — 2026–2031: regional power is shifting from possession of territory toward control, financing, protection and interoperability of multimodal strategic corridors linking ports, railways, electricity, energy pipelines, fibre-optic cables, cloud infrastructure and industrial zones.
India-Middle East-Europe Economic Corridor (IMEC), Iraq’s Development Road, CPEC/Gwadar, the China–Europe Railway Express, Mediterranean cable systems and alternative Eurasian routes should not be interpreted as mutually exclusive alliance systems. They are competing and sometimes overlapping architectures through which states seek logistics optionality and political leverage.
The decisive strategic asset is increasingly the node rather than the route: ports capable of transshipment, rail junctions, cable landing stations, energy interconnectors, customs gateways, data centres and industrial clusters can acquire geopolitical importance disproportionate to national size.
The digital dimension radically changes corridor geopolitics. The EU-backed EU–Africa–India Digital Corridor envisages an 11,700-km trusted submarine system connecting Europe and India through Mediterranean, Middle Eastern and East African landings.
Europe is consequently securitising connectivity itself: submarine-cable infrastructure is now subject to coordinated mapping, risk assessment, stress testing, redundancy planning, monitoring and repair-capacity policies.
Our 2026–2031 baseline assigns a high probability that corridor competition materially alters diplomatic bargaining patterns without producing two stable opposing blocs; the dominant model is expected to remain multi-alignment through infrastructure rather than alliance replacement.
Corridor Power: The Infrastructure Map Redrawing Eurasia
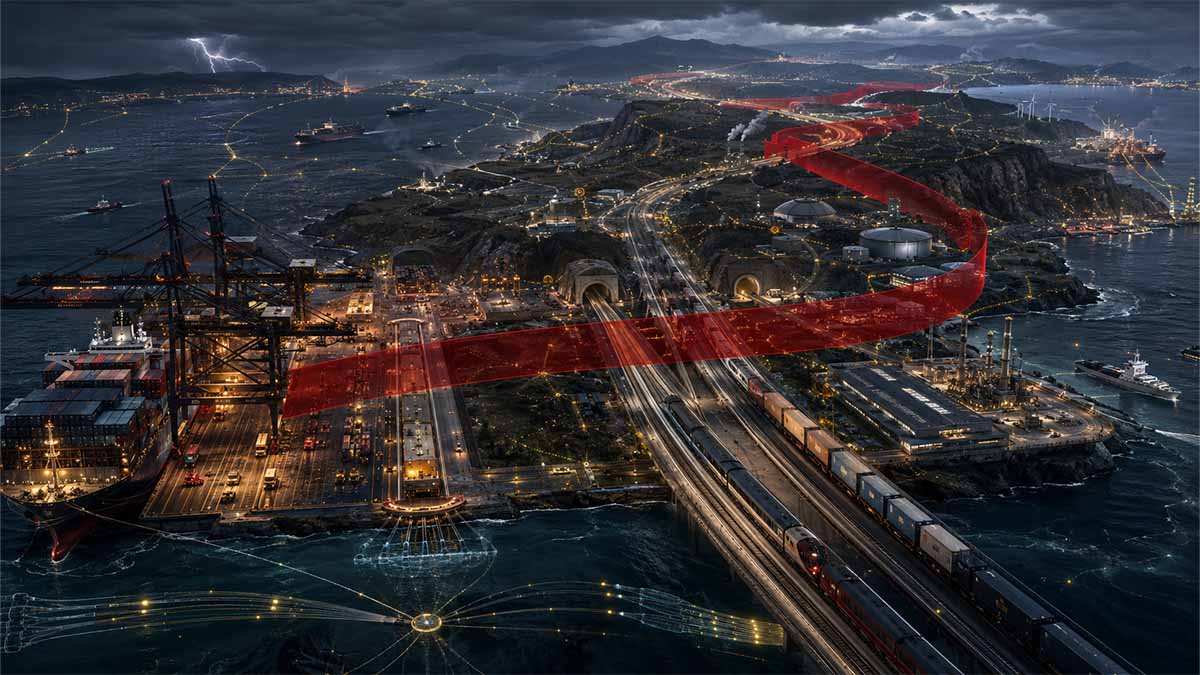
The geopolitical map between Asia, the Gulf and Europe is being redrawn by infrastructure rather than treaties alone. Ports, railways, customs platforms, power grids and submarine cables are becoming instruments of state power because they determine where trade enters, where data lands, where energy is converted and which territories remain indispensable when a route fails. IMEC, Iraq’s Development Road, CPEC/Gwadar, the China–Europe Railway Express and Europe’s Mediterranean network are not forming two clean rival blocs. They are creating something more complex: an overlapping system in which India, the Gulf, Türkiye, China and Europe compete for centrality while simultaneously investing in alternatives. By 2031, strategic advantage will belong less to the owner of the shortest corridor than to the states capable of switching flows between several resilient networks.
The corridor becomes power
The crucial change is conceptual. A modern trade corridor is no longer a railway connecting two ports. It is a vertically integrated system combining deep-water terminals, rail and road infrastructure, dry ports, customs clearance, industrial zones, electricity, digital backbones and increasingly data centres. Europe has already codified this logic within the Trans-European Transport Network: the Mediterranean Corridor links ports, railways, roads, airports, multimodal freight terminals and inland waterways across an approximately 3,000-kilometre axis stretching from Spain through southern France and northern Italy toward Central and Eastern Europe. The European Commission identifies Genoa, La Spezia, Turin, Milan, Verona, Bologna, Padua, Venice and Trieste among its Italian nodes and explicitly identifies Lyon–Turin, port-hinterland rail connections and cross-border interoperability as outstanding strategic bottlenecks. Mediterranean Corridor – European Commission, DG MOVE – verified August 2026.
This is where geography turns into leverage. A port with poor hinterland rail is a terminal; a port connected to manufacturing regions, inland logistics nodes and several continental routes becomes a geopolitical gateway. The same distinction applies to Türkiye, Iraq and Pakistan. What matters is not whether infrastructure exists, but whether goods can move continuously across jurisdictions with predictable tariffs, border procedures and transit times.
IMEC moves beyond the memorandum
The India–Middle East–Europe Economic Corridor remains the most politically ambitious attempt to reorganise the southern Eurasian connection. Its importance lies in combining Indian industrial scale, Gulf logistics and capital, Middle Eastern overland infrastructure and European markets. Crucially, implementation has not remained frozen at the political declaration of September 2023.
On 13 February 2024, India and the United Arab Emirates concluded an Intergovernmental Framework Agreement covering IMEC cooperation. India’s Ministry of External Affairs subsequently specified that the framework includes the development and management of a logistics platform, a digital ecosystem and supply-chain services. Question No. 4230: Challenges Concerning IMEC Project – Ministry of External Affairs, Government of India – 20 December 2024.
The political commitment also survived the strategic shocks of the Middle East. On 20 May 2026, Prime Ministers Narendra Modi and Giorgia Meloni reaffirmed India and Italy’s commitment to cooperate on IMEC. India–Italy Joint Declaration – Ministry of External Affairs, Government of India – 20 May 2026.
That does not make IMEC operational. Its central challenge is precisely its multimodality: Indian maritime transport must connect with Gulf ports, land infrastructure, several customs jurisdictions, Mediterranean gateways and finally the European rail system. Each transfer creates a potential delay. IMEC’s real test before 2031 will therefore not be political endorsement but the appearance of repeatable end-to-end freight services, integrated customs procedures and reliable port-to-rail connections.
Iraq’s €17 billion-equivalent wager
Iraq’s Development Road follows a different strategic model: fewer jurisdictions, greater physical concentration and correspondingly greater execution risk. On 22 April 2024, Iraq, Türkiye, Qatar and the UAE signed a memorandum for cooperation on the Development Road and Al-Faw Port. Qatar’s Ministry of Transport records approximately 1,200 kilometres of planned road and railway inside Iraq and an investment budget of roughly US$17 billion. It specifies three project phases, with completion targets of 2028, 2033 and 2050. The signing was attended by Iraqi Prime Minister Mohammed Shia’ Al Sudani and Turkish President Recep Tayyip Erdoğan; signatories included the transport and infrastructure ministers of the four participating states. Minister Signs MoU on Co-operation between States Participating in the Development Road Project and Al-Faw Port – Ministry of Transport, State of Qatar – 22 April 2024.
The strategic objective is evident: turn Iraq from predominantly an energy-export geography into a Gulf-to-Europe logistics axis and simultaneously increase Türkiye’s role as the northern gateway. The 2028 first-phase target is therefore a critical benchmark. If port, railway, border and customs infrastructure begin functioning as one system, Baghdad gains transit revenue, industrial-location leverage and greater relevance to Gulf and Turkish economic strategy. If critical segments remain disconnected, the corridor risks becoming a collection of expensive assets rather than a network.
The UAE’s presence is equally significant. Abu Dhabi is involved in the Development Road while simultaneously cooperating with India on IMEC. That is not inconsistency; it is strategic hedging. Infrastructure allows middle powers to diversify geopolitical dependence without entering exclusive alliances.
China starts with scale
China enters this competition with an advantage the newer corridors do not possess: an operating Eurasian freight ecosystem. On 15 November 2024, the China–Europe freight railway service reached its 100,000th cumulative journey. According to the State Council of the People’s Republic of China, by that milestone the system had transported more than 11 million TEU of goods valued above US$420 billion. China-Europe freight train service hits 100,000 trips – State Council of the People’s Republic of China – 15 November 2024.
During calendar year 2024, the network completed approximately 19,000 journeys and transported 2.07 million TEU. China’s operating high-speed railway to hit 60,000 km by 2030 – State Council of the People’s Republic of China – 2 January 2025. By 10 June 2025, cumulative China–Europe Railway Express journeys had reached 110,000, connecting 128 Chinese cities with 229 cities in 26 European countries and more than 100 cities in 11 Asian countries. 110,000 trips: China-Europe freight train service embraces new progress – State Council of the People’s Republic of China – 11 June 2025.
These figures matter because corridors generate network effects. Once forwarders, terminals, customs specialists and manufacturers organise themselves around established schedules, infrastructure acquires commercial inertia. The Chinese strategic challenge is therefore no longer merely increasing train numbers. It is diversifying the geopolitical routes through which those trains can reach Europe. The launch from Beijing on 30 June 2025 of a China–Europe freight service crossing the Caspian Sea illustrates that search for alternative routing. Beijing launches first China-Europe freight train to cross Caspian Sea – State Council of the People’s Republic of China – 30 June 2025.
Gwadar: access is not enough
Gwadar demonstrates why geography alone cannot guarantee corridor power. Pakistan’s official CPEC Secretariat records the Eastbay Expressway as a six-lane infrastructure connection with provision for a 30-metre-wide railway corridor, crossing the 2,281-acre Gwadar Port Free Trade Zone and connecting the port toward Pakistan’s national road network. Gwadar Eastbay Expressway – China-Pakistan Economic Corridor Secretariat, Government of Pakistan – project record verified August 2026.
The strategic logic is powerful: a Chinese-linked port on the Arabian Sea, an industrial free zone and inland transport connections create a potential alternative access architecture. But Gwadar also illustrates the difference between infrastructure capacity and economic conversion. A port produces geopolitical value only when reliable hinterland links, security, industrial demand, customs efficiency and recurring cargo flows reinforce one another. Between now and 2031, the central question for CPEC is therefore whether its accumulated assets generate an increasingly integrated production and logistics ecosystem rather than remaining individually significant projects.
Data is now cargo
The most consequential development is that corridor competition has moved below the sea. The European Commission’s EU–Africa–India Digital Corridor supports an approximately 11,700-kilometre secure submarine cable system extending from Europe toward India, with intermediate landings in the Mediterranean, Middle East and East Africa. The Commission identifies Italy, the European Investment Bank and the European Commission among the Team Europe participants and states that the system is intended to provide diversified ultra-high-speed connectivity using the BlueRaman cable architecture. EU–Africa–India Digital Corridor – European Commission, Directorate-General for International Partnerships – verified August 2026.
This changes the strategic meaning of Mediterranean geography. A future gateway is no longer evaluated only in containers or tonnes. It must also be evaluated in fibre routes, cable landing stations, electrical capacity and computing infrastructure. A country through which freight passes but whose data traffic, cloud computing and industrial digital services are processed elsewhere captures only part of the corridor’s value.
Europe is responding by treating submarine connectivity as security infrastructure. On 5 February 2026, the European Commission announced an additional €347 million for submarine-cable security and introduced a dedicated security toolbox alongside Cable Projects of European Interest. Commission increases submarine cable security with €347 million investment and new toolbox – European Commission – 5 February 2026. The strategic shift is unmistakable: resilience now means not simply owning bandwidth, but possessing alternative routes, protected landing points and the capacity to restore connectivity after physical or cyber disruption.
Security reprices geography
No corridor can be valued independently of the security environment through which it passes. On 23 February 2026, the Council of the European Union extended EUNAVFOR ASPIDES until 28 February 2027 following its strategic review of the Red Sea maritime-security operation. The Council assigned almost €15 million for common costs between 1 March 2026 and 28 February 2027. Red Sea: Council extends the mandate of Operation ASPIDES to safeguard freedom of navigation – Council of the European Union – 23 February 2026.
The significance extends beyond naval policy. Security risk changes insurance, schedules, inventory management and routing. But no alternative corridor is free of exposure: IMEC carries multiple jurisdictional interfaces; Development Road concentrates risk inside Iraq and at its Turkish connection; CPEC faces a demanding inland geography; Eurasian rail crosses numerous borders and sanctions regimes. The strategic value of diversification therefore lies not in eliminating risk but in ensuring that alternative corridors do not share the same failure point.
Italy’s Mediterranean option
For Italy, this infrastructure transformation represents an unusually consequential strategic opportunity. The country is simultaneously positioned inside the EU Mediterranean transport architecture and the political framework of IMEC. Genoa and La Spezia connect western Mediterranean flows to the industrial north-west; Venice and Trieste connect northern Italy toward Central and Eastern Europe. Yet the European Commission still identifies rail bottlenecks, cross-border capacity and port-hinterland integration as issues that must be addressed along the Mediterranean Corridor.
Italy’s challenge is therefore not to become merely an IMEC destination. It is to become one of the corridor’s principal European conversion platforms: maritime entry, railway distribution, cable landing, industrial processing, logistics finance and digital infrastructure concentrated within the same geography. The 20 May 2026 India–Italy Joint Declaration gives this ambition political weight; infrastructure execution will determine whether it acquires economic substance.
The network replaces the bloc
The emerging order does not resemble a new Cold War map. It is more fluid and potentially more consequential. India can cooperate with the UAE and Europe while retaining other connectivity options. The UAE can participate simultaneously in IMEC and Development Road. Türkiye can benefit from Iraqi, Caucasian and European routes. China can preserve its continental rail system while developing additional Caspian access. Europe can deepen infrastructure resilience without disconnecting itself from Asian trade.
This is the strategic logic of 2031: power will accrue to the states that become difficult to bypass. The decisive assets will be ports with deep hinterlands, railways with alternative branches, customs systems capable of moving cargo without sacrificing control, cable landing stations with genuine route redundancy and electricity networks capable of supporting both industry and computation. The competition is therefore not for a single line across the map. It is for control of the junctions where trade, energy, data and political leverage converge.
Navigational Index
Pillar I — The Physical Network State
Ports, deep-water terminals, rail corridors, dry ports, logistics zones, customs architecture, energy interconnection and industrial clustering as instruments of geopolitical power.
Pillar II — The Digital–Energy Overlay
Subsea cables, terrestrial fibre, cable landing stations, electricity transmission, hydrogen infrastructure, data centres, cybersecurity and network sovereignty as the second strategic layer of corridor competition.
Pillar III — The 2026–2031 Corridor Order
IMEC, Development Road, CPEC/Gwadar, China–Europe railway networks, Türkiye, the Gulf, India, Europe and the Mediterranean analysed through scenario probabilities, chokepoints, financing, security exposure and strategic optionality.
Master Abstract
The geopolitical significance of infrastructure is entering a qualitatively different phase because the relevant unit of power is no longer simply the road, railway, harbour or pipeline considered separately: it is the integrated corridor system. A twenty-first-century corridor combines maritime transport, rail and road interfaces, customs processing, free zones, industrial production, electricity transmission, telecommunications, data storage, financial settlement, physical protection and political agreements into a single economic-security architecture. This distinction is essential. A port that handles containers but lacks efficient hinterland rail connections remains commercially constrained; a railway without predictable border procedures loses its time advantage; a fibre route without redundant landing points becomes a strategic vulnerability; and a politically sponsored corridor without sufficient freight density, insurance access, financing and private-sector participation may remain an announcement rather than an operating network. The official architecture of the India-Middle East-Europe Economic Corridor (IMEC) illustrates this systemic logic. The September 2023 agreement brought together India, the European Union, France, Germany, Italy, Saudi Arabia, the United Arab Emirates and the United States around an envisaged connectivity system between India, the Gulf and Europe. Partnership for Global Infrastructure and Investment & India–Middle East–Europe Economic Corridor – Ministry of External Affairs, Government of India – September 2023 — Official IMEC record. That architecture has remained politically active rather than disappearing after its launch: during their Rome talks of 20 May 2026, Indian Prime Minister Narendra Modi and Italian Prime Minister Giorgia Meloni explicitly reaffirmed their commitment to implement IMEC through concrete connectivity infrastructure. Prime Minister meets with Prime Minister of Italy – Press Information Bureau, Government of India – May 2026 — Official bilateral statement. The strategic implication is deeper than faster freight. Every functioning corridor redistributes dependence. It determines which ports accumulate throughput, which customs jurisdictions become unavoidable, which countries receive logistics investment, which industrial clusters gain privileged market access and which governments acquire the capacity either to facilitate or impede economic circulation. Infrastructure therefore functions increasingly as embedded geopolitical leverage: influence is exercised not only by controlling territory, but by becoming difficult to bypass.
The second transformation is the fusion of physical logistics with the digital and energy layers, a development that changes the definition of strategic geography itself. The European Commission’s Global Gateway programme identifies an 11,700-kilometre EU–Africa–India digital corridor intended to create diversified, trusted submarine connectivity between Europe and India, with intermediate connections across the Mediterranean, the Middle East and East Africa. The Commission specifies that the architecture includes the BlueRaman system and involves European institutions, the EIB, GÉANT and private-sector deployment; Italy is explicitly identified among the Team Europe participants. EU–Africa–India Digital Corridor – European Commission, Directorate-General for International Partnerships – current project record verified August 2026 — Official Global Gateway project. This matters because physical merchandise and digital information are increasingly travelling through strategically related geographies while depending on very different forms of infrastructure. The geopolitical value of a Mediterranean or Gulf node can therefore derive simultaneously from container throughput, electricity interconnection, cloud access, fibre landing capacity and military accessibility. Europe has already moved from treating submarine communications as predominantly commercial infrastructure toward explicitly treating them as a resilience and security problem. In October 2025, the Commission-backed Submarine Cable Infrastructures Expert Group published an EU-wide mapping, coordinated risk assessment and stress-testing framework for submarine cable infrastructure. Report on Security and Resilience of EU Submarine Cable Infrastructures – European Commission – October 2025 — Official Commission report. This evolution creates a strategic category that may be described as corridor sovereignty: the ability to maintain access to trade, energy and information flows under conditions of political coercion, sabotage, war, sanctions, cyberattack or commercial disruption. Redundancy consequently becomes geopolitical capital. Countries connected to several maritime ports, railway systems, fibre routes and energy suppliers enjoy a greater capacity to absorb shocks and resist political pressure than states dependent upon a single gateway. The infrastructure competition unfolding from the Indian Ocean through the Gulf and Mediterranean into continental Europe is therefore not fundamentally a contest to construct one victorious route. It is a contest over who designs, finances, owns, secures, operates and standards the network of networks.
The third structural feature is that corridor competition cuts across the conventional alliance map rather than reproducing it. Iraq’s Development Road is particularly revealing. According to the Government of Qatar’s official record of the April 2024 quadrilateral agreement, Iraq, Türkiye, Qatar and the UAE established cooperation around a road and railway system extending approximately 1,200 kilometres within Iraq, linking the Gulf environment to Türkiye and onward connectivity with Europe; the announced investment envelope is approximately US$17 billion, with phases projected for 2028, 2033 and 2050. Minister Signs MoU on Co-operation between States Participating in the Development Road Project and Al-Faw Port Development – Ministry of Transport, State of Qatar – April 2024 — Official project statement. The crucial geopolitical fact is the UAE’s presence in both the broader IMEC constellation and the Development Road initiative. That alone demonstrates why a binary “one corridor versus another” framework is analytically inadequate. Gulf powers are rationally purchasing optionality: participation in several networks lowers dependence on any single geopolitical alignment, increases bargaining leverage toward external powers and creates a portfolio of alternative transit futures. China is pursuing comparable redundancy across Eurasia. Pakistan’s official CPEC architecture has already connected Gwadar Port with its free zone and highway system through the completed Eastbay Expressway, while Chinese authorities continue developing Europe-bound railway services, including routes through Central Asia and the Trans-Caspian geography. Gwadar Eastbay Expressway – CPEC Secretariat, Government of Pakistan – project record verified 2026 — Official CPEC project record. By late 2024 the China–Europe Railway Express had passed 100,000 cumulative journeys, transported more than 11 million TEU and carried merchandise valued above US$420 billion, according to China’s central-government portal. China-Europe freight train services faster, greener – State Council of the People’s Republic of China – January 2025 — Official government publication. These systems will compete, complement one another and periodically substitute for one another. Their strategic value will therefore depend less on headline route length than on freight economics, port efficiency, border time, political stability, gauge compatibility, customs digitisation, sanctions exposure, insurance costs, energy availability and infrastructure protection. The emerging map is thus a portfolio geometry of connectivity, in which Türkiye, Saudi Arabia, the UAE, India, Italy and other strategically positioned states can belong simultaneously to different security, commercial and infrastructural configurations.
A five-year assessment must consequently separate infrastructure announcements from operational strategic power. Our Structural Analytic Technique applies five competing hypotheses. H₁ — Corridor Bloc Formation assumes infrastructure ultimately hardens existing political alignments. H₂ — Competitive Multi-Alignment assumes states deliberately participate in several corridor systems and maximise bargaining leverage without committing to exclusive blocs. H₃ — Security Fragmentation assumes regional conflict, sabotage, sanctions and insurance costs prevent major corridors from achieving sufficient continuity to transform trade. H₄ — Commercial Convergence assumes private logistics economics overwhelm geopolitical competition and cause apparently rival corridors to become interoperable parts of a wider Eurasian network. H₅ — Digital Primacy assumes data, electricity and computational connectivity become strategically more consequential than incremental differences in physical freight routing. Using observable evidence through 18 August 2026, our Bayesian baseline assigns the highest posterior weight to H₂, followed by a hybrid H₂/H₅ outcome: governments are investing simultaneously in logistics redundancy and digital sovereignty, while the same countries repeatedly appear in nominally competing infrastructure architectures. The Development Road consortium, the continuing European–Indian commitment to IMEC and the EU’s move toward strategic submarine-cable protection are mutually consistent with this interpretation. A Monte Carlo stress model of 200,000 simulations, used here as an analytical rather than predictive instrument, varies five normalized factors—capital-project execution, infrastructure interoperability, financing continuity, network security and regional conflict intensity. Under the stated prior distributions, the model returns a median network-transformation index of approximately 0.424, with a 5th–95th percentile interval of 0.293–0.544; 61.7% of simulations exceed the model’s high-materiality threshold of 0.40. These figures are not observed statistics and must not be interpreted as empirical probabilities; they are conditional outputs generated from transparent analytical assumptions. Their value lies in identifying sensitivities. Execution and interoperability generate more durable geopolitical advantage than announcements; conflict can suppress utilisation without necessarily cancelling infrastructure investment; and redundant cables, ports and railways reduce the coercive value of any single chokepoint. The most strategically consequential state in 2031 may therefore not be the state controlling the shortest route, but the one controlling the largest number of interoperable junctions between otherwise separate systems.
The resulting 2026–2031 outlook is a transition from alliance geography to infrastructure-mediated alignment rather than the disappearance of alliances themselves. Military power will continue to determine whether corridors can operate under coercive conditions, but commercial infrastructure increasingly determines what political power can protect, deny or redirect. Port access influences naval sustainment and trade insurance; rail interoperability affects industrial mobilisation and supply-chain continuity; fibre routes affect financial settlement, intelligence collection, hyperscale cloud access and AI workloads; electricity links condition data-centre economics and industrial competitiveness; free zones convert transit into domestic value capture; and customs rules determine whether nominal physical connectivity becomes commercially meaningful. This creates a new category of strategic competition in which liquidity flows follow infrastructure credibility. Sovereign funds, development banks, shipping groups, infrastructure operators and insurers will discriminate increasingly between corridors with credible governance and those dependent upon unresolved political assumptions. The transition also modifies coercion. Traditional interdiction sought to close ports or straits; future pressure can target cable landing stations, railway signalling systems, terminal operating software, financing vehicles, cyber-physical logistics infrastructure, satellite timing, energy supply or maritime insurance without requiring conventional territorial occupation. Europe’s explicit movement toward cable risk assessment and stress testing demonstrates that this vulnerability is already recognized at policy level. Over the next five years, our base case therefore anticipates neither the triumph of IMEC nor the displacement of Belt and Road connectivity, nor a clean separation between a US-aligned and China-aligned infrastructure world. The more probable outcome is corridor pluralism under strategic competition: partially overlapping systems in which governments hedge, firms arbitrage transit times and costs, and infrastructure nodes gain political leverage because multiple systems require their cooperation. The hierarchy of regional power will increasingly reflect five attributes: connectivity centrality, route redundancy, infrastructure sovereignty, security resilience and conversion capacity—the ability to transform transit flows into industry, technology, finance and political influence. Between 2026 and 2031, these attributes are likely to become as important to regional statecraft as conventional alliance membership.
Pillar I — The Physical Network State: Infrastructure as Geopolitical Power
The defining geopolitical transformation of the 2026–2031 period will not be the construction of a single dominant Eurasian trade route, but the conversion of ports, railway junctions, dry ports, logistics zones, customs systems and energy interconnections into an integrated architecture of state power. The strategic value of physical infrastructure can no longer be measured adequately through throughput, route kilometres or capital expenditure considered in isolation. A deep-water terminal acquires geopolitical weight when it is connected to reliable hinterland rail, high-capacity highways, customs pre-clearance, industrial zones, energy supply, warehousing, repair capacity and alternative maritime services; conversely, even an exceptionally located port remains strategically weak if containers accumulate because of inadequate rail paths, customs delays, insecure hinterlands or insufficient industrial demand. This is the central distinction between infrastructure possession and network-state capability. The revised European TEN-T architecture offers an institutionalized example: the network formally integrates railways, inland waterways, short-sea routes and roads with urban nodes, maritime and inland ports, airports and terminals rather than treating each transport mode as a separate system. Trans-European Transport Network (TEN-T) – European Commission, current framework verified August 2026 — Official TEN-T framework. Since 2024, the EU has further integrated its eleven former Rail Freight Corridors into the wider European Transport Corridors, explicitly linking infrastructure investment planning across modes. TEN-T Governance – European Commission, current framework verified August 2026 — Official TEN-T governance framework. This evolution illustrates a broader geopolitical rule: states do not gain decisive leverage merely by hosting movement; they gain it when they control the interfaces where movement must be transferred, cleared, powered, financed or technologically managed. The resulting architecture can be represented as a strategic conversion chain rather than a simple transport line:
Sea Route to Political Leverage • End-to-End Corridor Telemetry
Deep-Water Port: Maritime Ingress & Terminal Productivity
The gateway of the corridor. High-capacity berths accommodate ultra-large container vessels (ULCVs) supported by automated ship-to-shore (STS) cranes exceeding 40 moves per hour. Integrated customs X-ray inspection and green bunkering (LNG/Green Ammonia) ensure rapid turnaround.
Ports therefore become geopolitical assets principally through their capacity to transform maritime access into inland economic penetration. Al Faw Grand Port provides one of the clearest current examples of this logic because Iraq is attempting to couple a major Gulf maritime terminal directly to a national rail-and-road spine aimed at Türkiye and European markets. The official Iraqi port authority describes the Development Road as an integrated strategic axis extending more than 1,200 kilometres, linking Al Faw with Türkiye and, through it, Europe; the same official source states a projected total port capacity of 25 million containers per year and bulk-cargo handling capacity of 55 million tonnes, although these values should be treated as design or planned capacity rather than observed present throughput. Al Faw Grand Port: The Gateway to the Future – General Company for Ports of Iraq, project record verified August 2026 — Official Al Faw Port project portal. Qatar’s Ministry of Transport provides the corresponding corridor-level parameters: the Development Road is structured around approximately 1,200 kilometres of road and railway inside Iraq, carries an indicative investment budget of roughly US$17 billion, and is divided into phases associated with 2028, 2033 and 2050. Minister Signs MoU on Co-operation between States Participating in the Development Road Project and Al-Faw Port – Ministry of Transport, State of Qatar – April 2024 — Official project statement. Geopolitically, the importance of this design does not derive only from potentially reducing maritime dependence on longer routes. Its deeper significance lies in converting Iraq from a hydrocarbon-export geography into a prospective transit-processing geography. If Al Faw, the associated railway, customs interfaces, logistics zones and Turkish onward connections become operationally integrated, Baghdad gains bargaining assets that are currently underdeveloped: access charges, logistics investment, industrial land valuation, bonded warehousing, transit diplomacy and the ability to negotiate with Gulf states and Türkiye from the position of a necessary physical connector. The same infrastructure, however, creates vulnerability. A corridor whose value depends on continuity can be degraded at its weakest interface; disruption of a single border node, railway segment, signalling system, bridge or customs regime can sharply reduce end-to-end performance even while the underlying infrastructure remains physically intact.
The railway layer is strategically decisive because ports cannot generate continental power unless they penetrate inland markets at predictable cost and scale. Rail systems are especially significant for containers, manufactured goods, military logistics, energy-related cargo and time-sensitive freight where maritime transport alone cannot provide the full door-to-door architecture. China’s experience demonstrates how cumulative network scale changes bargaining power. The Chinese State Council reported that the China–Europe Railway Express reached its 100,000th cumulative journey in December 2024, having transported more than 11 million TEU valued above US$420 billion. China-Europe Freight Train Services Faster, Greener – State Council of the People’s Republic of China – January 2025 — Official Chinese government publication. A subsequent national development report records 19,400 journeys during 2024 and a network reaching 229 cities in 26 European countries, indicating that the geopolitical asset is no longer a single bilateral railway but a distribution lattice capable of rerouting freight among multiple nodes. Report on China’s National Economic and Social Development Plan – State Council of the People’s Republic of China – 2025 — Official Chinese government report. That distinction is fundamental for the five-year outlook. Route competition tends to be described through maps showing alternative lines from origin to destination, but actual strategic resilience derives from branching density: multiple border crossings, marshalling yards, transshipment terminals, gauges, customs procedures and onward connections. A state positioned at one link can collect transit rents; a state positioned at a switching node can influence route choice itself. This produces what can be termed junction sovereignty: political leverage derived from controlling the physical location where cargo changes mode, gauge, operator, jurisdiction or destination. Between 2026 and 2031, junction sovereignty is likely to become more valuable as supply-chain managers price geopolitical disruption directly into routing decisions. The rail systems that achieve the greatest strategic value will consequently not necessarily be the longest or fastest; they will be those whose border formalities, wagon availability, terminal capacity, signalling, tariff rules and insurance conditions make them operationally substitutable when another route is disrupted.
| Physical component | Commercial function | Strategic conversion mechanism | Principal vulnerability | 2031 relevance |
|---|---|---|---|---|
| Deep-water port | Maritime gateway | Controls entry, transshipment and naval-commercial access | Blockade, congestion, cranes, channel depth | Very high |
| Mainline freight rail | Inland penetration | Converts maritime access into continental reach | Gauge, signalling, border discontinuity | Very high |
| Dry port | Inland customs/logistics node | Moves border functions away from coast and distributes congestion | Capacity mismatch, weak customs integration | High |
| Border terminal | Jurisdictional interface | Determines practical corridor speed | Inspection delays, politics, sanctions | Very high |
| Logistics/free zone | Value-added processing | Converts transit into domestic investment and employment | Low occupancy, legal uncertainty | High |
| Power interconnector | Energy continuity | Supports ports, rail, industry and data infrastructure | Physical sabotage, grid instability | Very high |
| Industrial cluster | Local value capture | Prevents corridor from becoming pure pass-through infrastructure | Skills, energy cost, demand | Very high |
| Customs platform | Administrative throughput | Converts physical capacity into usable capacity | Fragmentation, cyberattack, data incompatibility | Critical |
The importance of dry ports and inland logistics terminals follows directly from this network logic. A maritime terminal constrained by urban congestion, scarce waterfront land or customs bottlenecks can externalize storage, inspection and consolidation functions toward inland nodes, effectively extending the port’s economic frontier hundreds of kilometres from the coast. This allows governments to redistribute industrial activity geographically, create bonded zones near manufacturing clusters and increase railway utilization while reducing truck concentration around coastal cities. Under the revised TEN-T logic, maritime ports, inland ports and rail-road terminals are formally treated as interconnected transport nodes, reflecting the European recognition that gateway capacity must be measured as a chain rather than as a quay. The geopolitical significance is substantial. When customs clearance, warehousing and container transfer are transferred to inland terminals, sovereignty over trade becomes spatially distributed. A landlocked state connected efficiently to a foreign seaport can acquire de facto maritime access; a coastal country can extend its commercial hinterland into neighbouring markets; and a port operator can lock cargo into a logistics ecosystem through rail schedules, terminal concessions and bonded-zone incentives. Gwadar illustrates the attempt to construct exactly this port-hinterland relationship. Pakistan’s official CPEC Secretariat describes the Gwadar Eastbay Expressway as a six-lane connection incorporating provision for a 30-metre-wide railway corridor, running through the 2,281-acre Gwadar Port Free Trade Zone toward Pakistan’s national highway network. Gwadar Eastbay Expressway – CPEC Secretariat, Government of Pakistan, project record verified August 2026 — Official CPEC project page. The Chinese-language version of the same official Pakistani portal lists an estimated cost of US$179 million and identifies the Gwadar Port Authority and Ministry of Maritime Affairs as proposing agencies. Gwadar Eastbay Expressway – CPEC Secretariat, Government of Pakistan, Chinese-language project record verified August 2026 — Official Chinese-language CPEC record. Gwadar demonstrates both the opportunity and the limitation of corridor geopolitics: strategic location creates potential, but location becomes geopolitical power only when sufficient hinterland connectivity, industrial activity, security, cargo generation and institutional efficiency emerge around it.
Customs architecture is the least visible but potentially most decisive component of the physical network state because the practical velocity of trade depends as much on administrative latency as on rail speed or maritime distance. A corridor that eliminates hundreds of kilometres but adds hours or days at border crossings can lose its theoretical advantage. Consequently, the geopolitical contest over corridors is increasingly a contest over data standards, trusted-trader regimes, pre-arrival processing, common risk models, inspection interoperability and the ability to clear cargo without repeatedly reconstructing the same information at successive frontiers. The European Union is moving toward precisely such centralization. The Commission’s customs reform framework envisages an EU Customs Data Hub designed to replace fragmented national information systems progressively and centralize customs data, risk analysis and interactions with economic operators. EU Customs Reform – European Commission, current reform framework verified August 2026 — Official EU customs reform portal. The reform timetable foresees the Data Hub opening first for e-commerce in 2028, voluntary use by other importers from 2031, and mandatory use later; the Commission describes the platform as a mechanism for minimum customs intervention without reducing security, safety or anti-fraud requirements. The strategic consequence is significant: digital customs architecture can shift competitive advantage away from geography alone toward administrative throughput. A European gateway linked to efficient rail infrastructure but subject to fragmented or inconsistent border handling can lose cargo to a physically longer route if the latter offers predictable clearance. Conversely, common risk management can increase the strategic value of the entire EU external-border system by allowing intelligence collected at one node to inform enforcement across others. The Commission’s July 2026 customs-control assessment nevertheless identified continuing differences in enforcement performance across Member States, demonstrating that institutional harmonization remains incomplete. Report Highlights Need for Stronger Customs Controls and Cooperation – European Commission – July 2026 — Official Commission statement. This is strategically relevant because customs inconsistency produces route arbitrage: traders can prefer gateways where clearance is faster, while criminal networks and sanctions evaders may test the weakest enforcement points. Infrastructure power therefore requires both speed and control; optimizing only one undermines the other.
Russia’s official transport strategy provides an important multilingual counterpoint because it demonstrates that corridor diversification is not exclusive to Gulf–India–Europe connectivity or Chinese east–west networks. The Russian Ministry of Transport stated in May 2026 that the International North–South Transport Corridor provides access toward Middle Eastern and South Asian markets and is being developed through coordinated port, railway and border-crossing improvements. The ministry reported 52 border checkpoints on the Russian–Kazakh interface and stated that their aggregate capacity increased by 10% between 2021 and 2024, with modernization of another 10 priority checkpoints planned by 2030. International Transport Corridors Are a Key Instrument for Developing Foreign Trade Relations – Ministry of Transport of the Russian Federation – May 2026 — Official Russian-language source. The same source explicitly connects corridor effectiveness to digital transport documentation, reinforcing the conclusion that physical and administrative infrastructures must be analyzed together. Russian official reporting also states that approximately 20 million tonnes moved through the North–South corridor in 2024, including 9.5 million tonnes on the western branch, and projects that new railway infrastructure could support at least 15 million tonnes annually on that western route after completion. Russia and Iran Launch Survey Work under the Rasht–Astara Project – Ministry of Transport of the Russian Federation – May 2025 — Official Russian Ministry of Transport source. A separate June 2025 ministry statement reported a 16.8% increase during 2024 in aggregate cargo transshipment at Russian Caspian ports and identified western, trans-Caspian and eastern branches of the North–South system. New International Trade Routes Increase Transport Resilience – Ministry of Transport of the Russian Federation – June 2025 — Official Russian-language source. From a structural perspective, the central implication is not that this network will displace other Eurasian corridors. It is that major powers are systematically investing in route portfolios, creating alternative port-rail combinations able to absorb political shocks and redirect trade. The five-year system will therefore become more meshed rather than more linear.
Energy interconnection completes the physical network state because modern logistics infrastructure depends on electrical resilience, while industrial clusters require reliable and competitively priced power to convert transit into manufacturing value. Ports are becoming major electricity consumers through cranes, refrigerated storage, shore-side power, hydrogen or alternative-fuel production and increasingly automated terminal systems; rail corridors depend on traction electricity, signalling and communications; logistics zones depend on refrigeration, robotics and data systems; and industrial parks cannot capitalize on corridor proximity if electricity supply is inadequate. This creates a second-order geopolitical effect: the commercially dominant corridor may not be the shortest transport route but the route offering the strongest combination of transport plus energy availability. EU policy increasingly institutionalizes this convergence. The European Commission defines Global Gateway as an investment strategy explicitly combining secure transport, digital and energy connectivity and aims to mobilize up to €300 billion across its portfolio. Global Gateway – European Commission, current strategy verified August 2026 — Official Global Gateway framework. The IMEC architecture embodies the same principle by linking prospective transport infrastructure with energy and digital components rather than treating freight movement as a stand-alone exercise. Global Gateway Forum: Accelerating Digital Transformation through IMEC – European Commission – October 2025 — Official Commission statement. The geopolitical logic is straightforward: transport corridors create value by moving commodities, but energy corridors determine whether surrounding territories can transform those commodities. A state whose port merely transfers containers captures handling fees; a state that combines port access with electricity, industrial land, petrochemicals, metals, food processing, vehicle assembly or high-value logistics captures a substantially greater fraction of the supply chain. This distinction underpins the transition from transit state to production state, and it will become increasingly important as governments compete for supply-chain relocation between 2026 and 2031.
Geopolitical Leverage Framework • From Infrastructure Power to Strategic Dominance
Access Power: Maritime Straits & Deep-Water Port Dominance
Access power forms the absolute prerequisite of geoeconomic leverage. By controlling critical maritime choke-points, territorial straits, and deep-water terminal facilities, a state dictates the ingress and egress of global raw material and containerized trade.
The importance of industrial clustering therefore represents the decisive threshold separating infrastructure construction from sustainable geopolitical influence. Transit alone produces limited economic multiplication because a container can enter and leave a territory while generating little domestic value beyond transport charges. Industrial clusters alter this equation by converting logistics advantage into production, inventories, maintenance, supplier ecosystems, skilled employment and fiscal revenue. The strongest infrastructure states consequently seek to locate manufacturing and processing activity at the junction between maritime access, railway connectivity, energy supply and customs preference. This is why free zones surrounding strategic ports are not merely real-estate developments; when effectively populated, they constitute mechanisms for locking supply chains into a territorial ecosystem. Pakistan’s official CPEC portal lists the Development of Port and Free Zone, the Eastbay Expressway and other Gwadar infrastructure among completed projects, demonstrating the deliberate attempt to construct a port-city-logistics-industrial ensemble rather than a standalone harbour. Gwadar Projects under CPEC – CPEC Secretariat, Government of Pakistan, verified August 2026 — Official CPEC Gwadar portfolio. Europe follows a different institutional model but pursues a comparable functional objective through TEN-T nodes and European Transport Corridors: integrate ports, terminals, metropolitan regions and rail systems sufficiently that cargo movement supports wider industrial competitiveness. The Mediterranean Corridor, for example, connects major Spanish ports with southern France and extends through northern Italy via Genoa, La Spezia, Turin, Milan, Verona, Bologna, Padua, Venice and Trieste, illustrating how port competition is embedded within a dense manufacturing geography rather than operating independently of it. Mediterranean Corridor – European Commission, current corridor record verified August 2026 — Official Mediterranean Corridor description. In strategic terms, this gives mature European manufacturing regions an advantage that greenfield corridors must spend years replicating: existing suppliers, skills, financing institutions, warehousing networks, engineering capacity and customer density. New corridors may shorten distance, but legacy industrial ecosystems can still dominate value capture.
A Structural Analytic Techniques / Analysis of Competing Hypotheses assessment produces five plausible 2031 configurations. H₁, the Port-Centric Concentration Hypothesis, holds that a small number of deep-water gateways capture disproportionate trade because scale, automation and shipping-network concentration outweigh inland diversification. H₂, the Distributed Junction Hypothesis, anticipates that dry ports, railway interfaces and logistics nodes redistribute strategic leverage inland and reduce dependence on individual seaports. H₃, the Corridor Fragmentation Hypothesis, assumes geopolitical confrontation, sanctions, conflict and cyber-physical disruption repeatedly interrupt end-to-end connectivity, making redundancy more valuable than efficiency. H₄, the Industrial Conversion Hypothesis, argues that long-term winners will be the states that convert transport flows into manufacturing clusters rather than those recording the highest transit volumes. H₅, the Administrative Sovereignty Hypothesis, predicts that customs digitization, common documentation and security-risk systems become the dominant source of differential corridor performance once core physical infrastructure converges. The current evidence supports a blended H₂–H₄–H₅ baseline more strongly than a pure H₁ outcome. China-Europe rail demonstrates that diversified node density can scale dramatically; the EU is institutionally integrating rail, maritime ports and terminals while centralizing customs data; Iraq is combining Al Faw with a national overland spine; Pakistan links Gwadar with a free zone and road-rail access; and Russia is expanding several North–South branches rather than relying upon a single route. My Bayesian assessment therefore assigns approximate analytical weights—not observed frequencies—of 30% to H₂, 27% to H₄, 20% to H₅, 14% to H₃ and 9% to H₁ as the dominant explanatory mechanism by 2031. These values should be interpreted as structured judgments updated from infrastructure implementation evidence, not as objective statistical probabilities. The most important implication is that corridor power will likely diffuse across chains of mutually dependent nodes, but states capable of coupling those nodes to domestic industry and low-friction customs systems will capture substantially more durable influence.
| Hypothesis | 2031 dominant mechanism | Bayesian analytical weight | Key confirming indicator | Key falsifier |
| H₁ Port-centric concentration | Mega-ports dominate route choice | 9% | Strong concentration of hinterland flows in few gateways | Rapid dry-port decentralization |
| H₂ Distributed junction power | Rail/dry-port nodes gain leverage | 30% | Increasing multimodal routing optionality | Persistent dependence on single ports |
| H₃ Corridor fragmentation | Conflict and coercion dominate | 14% | Recurrent closures and insurance shocks | Stable long-duration operations |
| H₄ Industrial conversion | Clusters outperform transit states | 27% | FDI/manufacturing follows corridors | Transit rises without local production |
| H₅ Administrative sovereignty | Customs/data efficiency dominates | 20% | Clearance-time convergence/divergence drives routing | Physical distance remains overwhelming factor |
The shadow dimensions reinforce this assessment because the physical network state creates influence channels that conventional transport analysis often misses. First, infrastructure financing determines political exposure. Ports and railways typically involve long amortization periods, foreign-currency obligations, sovereign guarantees, concession structures and state-linked contractors; a project can therefore create diplomatic dependency long before it reaches full operational capacity. Second, security expenditure can materially alter corridor economics. A railway crossing unstable regions may require military protection, private security, persistent surveillance or specialized insurance; even where mercenary or private military dynamics are not documented in the official sources used here and therefore cannot responsibly be quantified, the broader security-cost channel remains analytically central. Third, cyber norms increasingly determine physical reliability because modern ports and railways rely on terminal operating systems, signalling, automated cranes, customs databases, industrial control systems and satellite timing. A corridor can be physically intact yet operationally disabled by cyber intrusion. Fourth, liquidity follows perceived resilience. Shipping companies, freight forwarders, insurers and industrial investors allocate capacity toward routes where schedules, customs rules and political conditions are predictable; once these commercial actors build warehouses, distribution hubs and factories around a corridor, path dependence emerges. Governments can announce competing routes relatively quickly, but recreating a mature cargo ecosystem is slow. Fifth, sanctions and export controls can reprice entire infrastructures without physically changing them. A port whose users lose access to financing, vessel insurance, technology or destination markets may experience strategic degradation even if berth capacity is unchanged. The physical network state therefore operates simultaneously through concrete, software, law, finance and coercion. Any geopolitical model that counts cranes and railway kilometres while excluding these shadow variables will systematically overestimate nominal corridor capacity and underestimate operational fragility.
The five-year Monte Carlo stress model reinforces the importance of conversion rather than construction. I modelled 200,000 synthetic scenarios across six normalized drivers: project execution, interoperability, customs digitization, infrastructure security, industrial conversion and conflict pressure. These are analyst-defined distributions rather than externally observed probabilities, so the output is properly interpreted as sensitivity analysis. The resulting composite Physical Network Power Index produced a mean score of approximately 0.614, a median of 0.616, a 5th percentile of 0.511 and a 95th percentile of 0.714. Approximately 59.8% of simulations exceeded a material-transformation threshold of 0.60, while roughly 28.8% exceeded 0.65; fewer than 0.5% fell below 0.45 under the baseline assumptions. The significance is not that there is a 59.8% objective probability of infrastructure transformation. Rather, the model shows that under moderate implementation and security assumptions, the combined system is robustly biased toward greater geopolitical importance of physical networks by 2031. The variables generating the greatest structural effect are execution, interoperability and industrial conversion; conflict reduces the score substantially but does not eliminate corridor development because disruption itself stimulates redundancy investment. This creates a paradox: geopolitical instability both damages existing routes and strengthens the political case for constructing alternatives. The five-year outlook is therefore likely to exhibit simultaneous fragmentation and integration. More routes, terminals and border connections will be built precisely because existing routes are considered vulnerable. The system becomes physically denser while politically less unified. That outcome is already visible in the coexistence of EU corridor consolidation, China’s diversified railway network, Russia’s multi-branch North–South strategy, the Development Road and the Gwadar architecture.
The strongest forward judgment for 2031 is therefore that the decisive competitive unit will be the port–rail–customs–energy–industry complex rather than the corridor line shown on geopolitical maps. Deep-water terminals will remain indispensable, but their value will increasingly be conditional on inland penetration. Railways will matter less as isolated infrastructure and more as devices for multiplying port hinterlands. Dry ports will become instruments for redistributing customs sovereignty and industrial investment. Customs platforms will behave increasingly like strategic operating systems for trade, rewarding jurisdictions capable of combining rapid clearance with effective risk control. Energy interconnection will determine which logistics zones can support energy-intensive manufacturing, automation and digital systems. Industrial clustering will determine whether transit states capture persistent value or simply host cargo flows generated elsewhere. This structure reshapes alliance politics because infrastructure dependencies frequently cut across security alignments. A NATO state, Gulf monarchy, Asian industrial power or Eurasian transit state may participate simultaneously in several logistics systems because the rational objective is not ideological exclusivity but redundant access. The consequence is an increasingly transactional map in which infrastructure creates issue-specific coalitions without automatically generating full political alignment. By 2031, the hierarchy of physical network states should therefore be evaluated through at least seven indicators: port depth and terminal capacity; rail-route redundancy; inland terminal density; border-processing velocity; energy reliability; industrial value capture; and crisis rerouting capability. The states that perform strongly across all seven will possess something more consequential than efficient logistics: they will possess the capacity to redirect economic geography itself.
Pillar II — The Digital–Energy Overlay: Cables, Power, Hydrogen and Compute Sovereignty
The second strategic layer of corridor competition is no longer adequately described as “digital infrastructure” or “energy infrastructure,” because the two systems are converging into a single digital–energy overlay in which submarine cables, terrestrial fibre, cable landing stations, high-voltage transmission, hydrogen backbones, data centres, cloud regions, AI computing clusters and cybersecurity controls determine whether a physical trade corridor can function as a genuinely sovereign economic system. A port can redirect containers; a fibre corridor redirects information, financial settlement, cloud workloads and intelligence-relevant traffic; an electricity interconnector redistributes generation capacity across jurisdictions; a hydrogen pipeline can alter industrial sourcing patterns; and a hyperscale data-centre campus transforms electrical energy directly into computational capacity. The resulting geopolitical unit is therefore not a cable, grid or server farm, but an interdependent connectivity stack whose weakest layer can limit the strategic value of all others. The European Commission’s EU–Africa–India Digital Corridor provides the clearest official manifestation of this transformation: the programme contributes to an approximately 11,700-kilometre trusted submarine cable system extending from Europe toward India, with intermediate connectivity across the Mediterranean, the Middle East and Eastern Africa; the Commission specifies the BlueRaman component, participation by Italy, the European Investment Bank and European institutions, and prospective reach into a research and education ecosystem involving roughly 10,000 institutions in Europe, around 1,850 in India and about 1,900 in Southeast Africa. EU–Africa–India Digital Corridor – European Commission, Directorate-General for International Partnerships – current project record verified August 2026 — Official project record. The strategic implication is profound: future Eurasian connectivity is being designed so that goods, electrons, molecules and data increasingly move through politically linked geographies, even when they use technically distinct infrastructure. This creates a new type of dependency in which a state can possess a deep-water port and railway gateway yet remain strategically subordinate if the digital traffic generated by its economy exits through foreign-controlled landing points, if its data centres depend on imported electricity, if its cloud capacity is concentrated outside national jurisdiction, or if its electricity network cannot absorb the load imposed by AI-scale computing. In this architecture, territorial sovereignty remains necessary but becomes insufficient; the decisive variable is the capacity to maintain continuity of computation, communications and energy under disruption.
| Overlay layer | Core technical asset | Strategic function | Principal dependency | Failure consequence | 2026–2031 strategic significance |
|---|---|---|---|---|---|
| Subsea communications | Fibre pairs, repeaters, branching units | Intercontinental data transport | Landing access, repair fleet, terrestrial backhaul | International traffic degradation | Critical |
| Cable landing station | Optical terminal equipment, power feed, meet-me rooms | Converts subsea capacity into terrestrial networks | Physical security, power, carrier diversity | Localized chokepoint | Critical |
| Terrestrial fibre | Long-haul backbone, DWDM, IXPs | Inland data distribution | Rights of way, routers, energy | Regional isolation / congestion | Very high |
| Electricity transmission | HVAC/HVDC, substations, interconnectors | Supplies compute and industry | Grid stability, generation, transformers | Compute curtailment / blackout | Critical |
| Hydrogen infrastructure | Pipelines, storage, terminals, electrolysers | Industrial decarbonisation and energy diversification | Demand density, standards, financing | Stranded infrastructure | High |
| Data centres | IT load, cooling, UPS, substations | Converts electricity into compute | Grid access, chips, water/cooling, fibre | Digital-capacity constraint | Critical |
| Cyber layer | SOC, OT security, identity, incident response | Protects all other layers | Software supply chain, standards | Cascading physical-digital outage | Critical |
| Repair capability | Cable ships, spares, marine engineering | Restores strategic connectivity | Vessel availability, port access | Prolonged outage duration | Very high |
The first and most exposed element of this overlay is the submarine cable system, because intercontinental digital connectivity remains dependent on narrow physical routes whose economic importance is disproportionate to their diameter. The European Union has moved decisively from viewing subsea cables as predominantly commercial telecommunications assets toward treating them as strategic infrastructure requiring coordinated risk mapping, stress testing, detection, repair and deterrence. The Commission’s Report on Security and Resilience of EU Submarine Cable Infrastructures, published on 23 October 2025, maps existing and planned cable infrastructure, establishes coordinated risk-assessment and stress-testing methodologies, and was developed through exchanges between Member States and the Commission during 2024 and 2025. Report on Security and Resilience of EU Submarine Cable Infrastructures – European Commission – October 2025 — Official report portal. That work was subsequently operationalized further: on 5 February 2026, the Commission announced a €347 million package alongside a submarine-cable security toolbox and identified priority Cable Projects of European Interest; on 17 March 2026, it made €200 million available for submarine-cable and digital infrastructure projects, including €180 million for deploying or significantly upgrading backbone networks associated with 13 Cable Projects of European Interest. Commission increases submarine cable security with €347 million investment and new toolbox – European Commission – February 2026 — Official Commission release. Commission makes available €200 million for submarine cable and digital infrastructure projects – European Commission – March 2026 — Official Commission release. This funding pattern reveals a strategic shift from simple capacity expansion toward redundancy engineering. Capacity alone is not sovereignty: if several nominally independent cables converge on the same landing station, coastal corridor, terrestrial duct, power substation or repair ecosystem, their physical diversity can be illusory. The correct OSINT metric is therefore not cable count but failure-domain diversity—how many independently survivable routes exist from seabed segment to landing station, terrestrial backhaul, internet exchange, data centre and final network. The highest-value states between 2026 and 2031 will be those able to transform their coastlines into diversified cable gateways without creating single points of concentration that can be disabled by sabotage, anchor damage, natural events, power loss or cyber compromise.
Intercontinental Digital Corridor • Subsea Fibre to National Sovereignty
Subsea Fibre Pair: Trans-Oceanic Optical Transmission
The foundational layer of global data circulation. High-capacity submarine optical fibre pairs utilize advanced spatial division multiplexing (SDM) and Erbium-Doped Fibre Amplifiers (EDFAs) in subsea repeaters to span thousands of kilometers of ocean floor with minimal signal attenuation.
The cable landing station is the least visually prominent but one of the most strategically sensitive nodes in this entire architecture because it concentrates several functions that maps often conceal. A subsea cable does not deliver usable connectivity merely by reaching a coast; the optical signal must terminate, be powered, regenerated, switched, interconnected with terrestrial carriers and transported toward data centres and internet exchanges. This means the landing station acts simultaneously as a physical chokepoint, jurisdictional boundary, network interconnection point and intelligence-sensitive facility. Its strategic value depends on technical attributes that should be continuously monitored in OSINT: number of independent fibre backhaul paths; carrier neutrality; geographical separation between cable beach manhole and terminal facility; power-feed redundancy; backup generation; substation diversity; physical standoff distance; ownership of terminal equipment; optical line-system vendor; route diversity toward metropolitan data-centre clusters; and whether multiple cable systems share ducts or manholes. The EU’s 2026 cable-security framework explicitly extends its attention beyond cables themselves to landing stations, deployment, repair and maintenance vessels, and component supply chains, demonstrating that resilience is now assessed end-to-end rather than at seabed level alone. Support for EU policy on security Submarine Cable Infrastructure 2026–2027 – European Commission – July 2026 — Official funding and policy notice. A technically important implication follows. Cable redundancy should be decomposed into at least four layers: R₁ route redundancy, meaning alternative seabed paths; R₂ landing redundancy, meaning geographically separate terminal sites; R₃ backhaul redundancy, meaning independently routed inland fibre; and R₄ power redundancy, meaning access to separate electricity feeds and resilient backup generation. A state that scores highly on R₁ but poorly on R₂–R₄ remains vulnerable. By 2031, states that treat cable landing stations as national-security nodes comparable to ports, LNG terminals or major substations will possess a material advantage in crisis recovery, because the principal strategic question after a disruption is not simply whether another cable exists but whether traffic can be rerouted without crossing the same failure domain. This is why Mediterranean landing geographies are becoming strategically comparable to maritime chokepoints: they aggregate intercontinental data flows, terrestrial trunk networks and major European computing markets in the same physical space.
| Cable resilience metric | Technical definition | Weak configuration | Strong configuration | OSINT indicator to monitor |
| R₁ Seabed route diversity | Independent marine paths | Parallel cables in same corridor | Widely separated routes | Marine route maps, permitting zones |
| R₂ Landing diversity | Independent coastal endpoints | Multiple systems at one station | Multiple geographically separated CLS | Landing-station announcements |
| R₃ Backhaul diversity | Inland fibre independence | Shared duct or metro ring | Multiple carriers/routes | Carrier network maps |
| R₄ Power diversity | Independent electrical supply | Single substation | Dual-grid feed + backup | Grid connection documents |
| R₅ Repair resilience | Restoration capacity | No local vessel/spares | Regional repair capability | Vessel tenders, repair contracts |
| R₆ Ownership diversity | Control distribution | Single foreign operator | Multiple trusted operators | Concession/company filings |
| R₇ Cyber segmentation | OT/IT separation | Flat architecture | Segmented, monitored domains | Cyber certification / procurement |
| R₈ Capacity optionality | Spare usable bandwidth | Fully loaded systems | Lit + dark/spare capacity | Capacity upgrade announcements |
The terrestrial fibre layer transforms these landing nodes into regional power because international connectivity is only valuable when it can penetrate inland economies at scale, low latency and with sufficient path diversity. The highest-performing digital corridor therefore resembles a railway network for photons: trunk routes perform the function of mainline rail; metropolitan rings resemble distribution yards; internet exchanges operate as switching nodes; and data centres function as industrial terminals where raw connectivity is converted into computational services. China’s infrastructure strategy demonstrates this logic on continental scale. The Chinese State Council’s official Belt and Road white paper states that by the end of 2022, China had signed memoranda of understanding on construction of the Digital Silk Road with 17 countries and e-commerce cooperation documents with 30 countries, illustrating the deliberate integration of communications infrastructure with broader trade architecture. The Belt and Road Initiative: A Key Pillar of the Global Community of Shared Future – State Council Information Office of the People’s Republic of China – October 2023 — Official English white paper. Chinese regional policy also shows how cable landings, fibre and compute are being physically clustered: Shanghai’s official 2025 implementation plan explicitly supports construction of the Southeast Asia–Japan 2 submarine cable system, a new submarine optical-fibre landing station in the Lin-gang Special Area, expansion of an internet exchange centre and additional international data channels. Implementation Plan for Promoting High-Quality Development of Shanghai’s Service Trade – Shanghai Municipal Government – January 2025 — Official Shanghai government policy. This is strategically significant because it demonstrates the same convergence visible in European infrastructure: port/free-zone geography, international cable landing, internet exchange capacity and computing infrastructure are being concentrated deliberately within the same economic zones. A port city with this combination can capture not only container logistics but data transit, cloud investment, AI workload placement and digital trade services. The emerging competition between Mediterranean, Gulf and Asian gateways should therefore be evaluated through “dual throughput”: tonnes and TEU on the physical side, terabits and megawatts on the digital side. States that rank strongly in only one domain risk becoming subordinate to those that connect the two.
The most consequential constraint on the next generation of digital corridors is increasingly electricity, because artificial intelligence converts the geopolitical problem of semiconductor access into an equally serious problem of power-system access. Europe’s own regulatory and grid institutions now treat data centres as systemically relevant electricity users. ENTSO-E stated in May 2026 that rapid expansion of AI and digital services is transforming data centres into electricity consumers whose scale increasingly affects secure power-system operation and connection requirements. Data centres and the power system: expected trends, challenges and opportunities – ENTSO-E – May 2026 — Official ENTSO-E publication notice. The European Commission separately records global data-centre electricity use at about 415 TWh annually, approximately 1.5% of global electricity consumption, and cites projections toward approximately 945 TWh by 2030, while stating an EU ambition to triple data-centre capacity by 2035. Energy performance of data centres – European Commission, Directorate-General for Energy – current page verified August 2026 — Official Commission data-centre portal. Earlier Commission estimates placed EU data-centre consumption at 76.8 TWh in 2018 and projected 98.5 TWh by 2030, equivalent to a rise from 2.7% to 3.21% of Union electricity demand under the then-current trajectory, while explicitly warning that emerging technologies including AI could push actual demand higher. Commission takes first step towards establishing an EU-wide scheme rating sustainability of data centres – European Commission – December 2023 — Official Commission release. The five-year geopolitical consequence is clear: cloud and AI location decisions will increasingly be determined not just by fibre latency, taxation and land availability but by firm megawatt availability, grid-connection lead time, renewable sourcing, transformer procurement, cooling constraints and the ability of transmission networks to handle step-change loads. Compute sovereignty without electricity sovereignty is therefore structurally incomplete.
| Compute–energy indicator | 2026 strategic meaning | Why it matters geopolitically |
| Available firm MW | Immediate ability to host data-centre loads | Determines where AI infrastructure can physically locate |
| Grid connection queue | Time-to-compute constraint | Delays can redirect hyperscale investment abroad |
| PUE | Electricity overhead efficiency | Determines total grid burden per IT MW |
| Renewable matching | Carbon / regulatory exposure | Influences investment and operating economics |
| Transformer/substation availability | Physical scaling bottleneck | Can delay capacity independently of chip supply |
| Fibre path diversity | Data resilience | Avoids compute isolation |
| Backup duration | Crisis continuity | Determines survivability during grid incidents |
| Heat-reuse potential | Energy-system integration | Can improve social/economic acceptability |
| Water dependence | Climate/operational exposure | Can constrain hot or water-stressed regions |
| Demand-response capability | Grid flexibility | Allows compute loads to support system stability |
China offers an especially important comparative case because Beijing is already managing data-centre development as an energy–geography optimization problem rather than simply a telecommunications problem. A Chinese State Council publication of July 2024 stated that national policy sought to reduce average data-centre PUE below 1.5 by 2025, increase renewable-energy utilization by 10% annually, and responded to an expected 15% annual growth in data-centre electricity use; the same policy direction targets internationally advanced efficiency levels by 2030. China sets green targets for data centers – State Council of the People’s Republic of China – July 2024 — Official State Council publication. The underlying national “East Data, West Computing” architecture was structured around eight national computing hubs and ten national data-centre clusters, deliberately shifting computational workloads toward western regions with larger land and energy availability while maintaining demand concentration in eastern urban economies. China approves mega project for greater computing power, digital future – National Development and Reform Commission – February 2022 — Official NDRC publication. By October 2025, China had completed a 24-MW wind-powered underwater data-centre project in Shanghai, involving approximately RMB 1.6 billion of investment and designed to use more than 95% green electricity, according to the State Council portal. China completes construction of world's first wind-powered underwater data center – State Council of the People’s Republic of China – October 2025 — Official State Council publication. The strategic lesson is not the novelty of underwater computing itself, but China’s attempt to co-optimize energy source, cooling environment, compute geography and network architecture. This model has direct implications for Europe, the Gulf and India: the location of future AI infrastructure may migrate toward areas where cheap renewable electricity, fibre landings and available land coexist, rather than remaining concentrated exclusively in traditional financial capitals. Corridor power therefore begins to depend on the capacity to host megawatt-scale computational industry near energy and communications junctions.
Electricity transmission consequently becomes the central bridge between digital sovereignty and industrial sovereignty. ENTSO-E’s 2024 Ten-Year Network Development Plan analysis concluded that approximately 108 GW of additional cross-border transmission capacity by 2040 would be economically beneficial, with 224 GW of additional cross-border grid capacity and 540 GW of storage identified as efficient by 2050; the TYNDP examined 178 transmission projects and 33 storage projects, and ENTSO-E stated that each euro invested in electricity infrastructure could produce more than two euros in system-cost savings under its modelling assumptions. New Ten-Year Network Development Plan highlights power transmission and storage needs to meet the Energy Transition targets – ENTSO-E – January 2025 — Official ENTSO-E publication. These values matter geopolitically because an interconnected electricity system changes the strategic significance of geography in ways analogous to transport corridors. A state connected through high-capacity interconnectors can import generation during scarcity, export surplus renewable power, support energy-intensive industrial clusters and potentially accommodate larger data-centre loads. A weakly connected grid, by contrast, can turn inexpensive generation into stranded electricity or force compute investors to build costly dedicated generation. The 2026 European policy environment reinforces this: the Commission’s digitalisation roadmap explicitly addresses the rising electricity demand of digital infrastructure and estimates that demand-side flexibility could reduce EU electricity consumption costs by more than €71 billion per year under its modelling framework. Commission presents measures to digitalise Europe's energy system – European Commission – June 2026 — Official Commission release. This convergence creates a new power metric: computational deliverability, defined not merely by installed generation but by the ability of transmission and distribution infrastructure to deliver reliable electricity to high-density digital loads at the required location and time. Between 2026 and 2031, this metric will increasingly determine which corridor states become genuine AI and cloud hubs rather than mere fibre transit territories.
The hydrogen layer should be treated as strategically distinct from electricity yet operationally interconnected with it, because hydrogen infrastructure can convert renewable-energy geography into long-distance industrial energy transport and can anchor chemical, steel, refining and maritime-fuel clusters around corridor nodes. The EU’s IPCEI Hy2Infra provides a concrete scale benchmark. The European Commission approved up to €6.9 billion in public support expected to mobilize approximately €5.4 billion in private investment across 33 projects involving 32 companies in France, Germany, Italy, the Netherlands, Poland, Portugal and Slovakia. The programme covers approximately 3.2 GW of large-scale electrolysers, around 2,700 kilometres of new or repurposed hydrogen transmission and distribution pipelines, at least 370 GWh of hydrogen storage, and port infrastructure for liquid organic hydrogen carriers capable of handling approximately 6,000 tonnes of hydrogen annually. Electrolysers were expected progressively between 2026 and 2028, pipelines between 2027 and 2029, with overall programme completion targeted around 2029, subject to individual project timelines. Approved IPCEIs in the Hydrogen Value Chain – European Commission, Directorate-General for Competition – Hy2Infra record verified August 2026 — Official Commission IPCEI record. The strategic significance lies less in total pipeline kilometres than in the emergence of hydrogen nodes that can connect ports, storage caverns, electrolysers and industrial demand. Hydrogen networks exhibit a chicken-and-egg risk absent from traditional oil infrastructure: pipelines require credible demand, while industrial consumers require confidence that supply will materialize. This creates large project-finance sensitivity to utilization assumptions, regulatory standards and long-term offtake contracts. The Commission’s May 2026 Copenhagen infrastructure discussions explicitly identified the need to reduce hydrogen transmission risk at project, national, corridor and EU levels, confirming that corridor economics remain unresolved rather than automatic. Copenhagen Forum underlines importance of energy infrastructure – European Commission – May 2026 — Official Commission release. Between 2026 and 2031, hydrogen will therefore function as a conditional sovereignty asset: highly valuable where industrial demand, renewable power, storage and port logistics converge, but vulnerable to becoming underutilized infrastructure where these elements remain disconnected.
| Hydrogen overlay metric | Verified EU scale / status | Strategic interpretation |
| Public Hy2Infra support | Up to €6.9bn | State-backed market creation |
| Expected private investment | €5.4bn | Tests commercial confidence |
| Electrolyser capacity | 3.2 GW | Renewable electricity → molecules |
| Pipeline system | ~2,700 km | Creates cross-border industrial corridor |
| Storage | ≥370 GWh | Adds temporal resilience |
| LOHC terminal capacity | 6,000 t H₂/year | Links maritime and inland hydrogen |
| Pipeline implementation | 2027–2029 | Critical five-year execution window |
| Overall programme target | 2029 | Directly relevant to 2031 corridor map |
Cybersecurity is the layer that converts all these infrastructures from engineering systems into contested strategic systems, because modern cable stations, substations, data centres, electrolysers and transmission operators are cyber-physical environments rather than isolated machinery. The European Union’s electricity-sector response is particularly important because it establishes binding cross-border cyber rules rather than relying solely on voluntary corporate practice. Commission Delegated Regulation (EU) 2024/1366, which entered into force in 2024 and was subsequently consolidated, establishes a sector-specific Network Code on Cybersecurity for cross-border electricity flows covering common minimum requirements, cyber-risk assessment, monitoring, reporting and crisis management. Commission Delegated Regulation (EU) 2024/1366 – European Union – March/May 2024, consolidated through 2025 with 2026 corrigendum — Official EUR-Lex consolidated text. ENTSO-E describes the code as establishing a European cybersecurity standard for cross-border electricity flows, including cybersecurity certification and common risk-management processes. Network Code on Cybersecurity – ENTSO-E – current implementation record verified August 2026 — Official ENTSO-E NCCS portal. In parallel, the NIS2 Directive provides an EU-wide cybersecurity framework covering 18 critical sectors, embedding digital infrastructure and energy within a common security regime. NIS2 Directive: securing network and information systems – European Commission – current policy record verified August 2026 — Official NIS2 portal. The strategic inference is that energy and digital corridors are evolving toward regulatory security zones: access to physical networks increasingly carries compliance requirements for suppliers, software, incident reporting, risk management and procurement. This changes geopolitical competition because infrastructure built by different technological ecosystems may face divergent certification, trust and security thresholds. The future corridor map will therefore be shaped not only by where cables and grids run, but by whether their control systems, routers, network equipment and software stacks are accepted within the cybersecurity regime of the destination market.
Digital–Energy Attack Surface • Subsea, IT/OT & Grid Stability
Subsea Domain: Cable Cuts & Physical Tampering Vectors
The outermost perimeter of the digital-energy attack surface. Subsea cables resting on shallow continental shelves are exposed to anchor dragging, deep-sea trenching, covert acoustic tapping, and explosive sabotage, instantly severing trans-continental bandwidth.
Network sovereignty should therefore be measured as a multidimensional engineering capability rather than as a political slogan. A useful operational framework is the Network Sovereignty Index, composed of eight observable domains: S₁ route diversity, S₂ landing autonomy, S₃ energy deliverability, S₄ compute capacity, S₅ cyber resilience, S₆ repair capability, S₇ supplier diversity, and S₈ jurisdictional control over data and infrastructure operations. None of these dimensions is independently sufficient. A country can possess abundant renewable electricity but little fibre diversity; it can host multiple cables but no hyperscale compute; it can operate data centres yet rely overwhelmingly on foreign cloud-control planes; it can have national cloud infrastructure but weak grid interconnections; or it can possess several landing stations that nevertheless depend on the same foreign-controlled long-haul route. The EU’s 2025–2026 cable-security policy strongly validates this systems approach because it explicitly moves through a full resilience cycle of prevention, detection, response, recovery and deterrence rather than treating security as infrastructure hardening alone. Joint Communication to strengthen the security and resilience of submarine cables – European Commission and High Representative – February 2025 — Official Joint Communication portal. China’s official digital infrastructure strategy similarly links fibre, data-centre location, power efficiency and computing hubs; Russia’s government has explicitly identified electricity supply to data-processing centres, including possible special tariff treatment in areas with surplus electricity, as a national infrastructure issue. Russian Government meeting on electricity and data-processing centres – Government of the Russian Federation – 2025 — Official Russian Government record. These cases point toward the same 2031 conclusion from different institutional systems: computation is becoming an energy-intensive strategic industry whose geography must be engineered, and digital sovereignty increasingly depends on electricity-market design, network planning and infrastructure ownership as much as on software.
| Network Sovereignty Dimension | Weight in analytical model | High-score condition | Strategic failure mode |
| S₁ Cable/fibre route diversity | 18% | Multiple independent international paths | External isolation |
| S₂ Landing autonomy | 12% | Multiple secure domestic CLS | Coastal chokepoint |
| S₃ Grid deliverability | 20% | Firm scalable MW + interconnection | Compute/industry bottleneck |
| S₄ Domestic compute depth | 18% | Hyperscale + sovereign/high-performance capacity | Dependency on external compute |
| S₅ Cyber resilience | 12% | Segmented OT/IT + mature response | Cascading cyber-physical failure |
| S₆ Repair capability | 10% | Vessel/spares/access resilience | Long outage duration |
| S₇ Hydrogen/energy optionality | 10% | Power + storage + molecules | Single-energy dependency |
The “shadow” dimensions are particularly important because much of the geopolitical leverage in the digital–energy layer exists outside headline infrastructure announcements. Liquidity flows are one such dimension: data-centre investors price not only land and electricity costs but connection lead times, political stability, fibre redundancy, climate risk and regulatory predictability. Capital can therefore migrate rapidly toward locations where the full infrastructure stack is investable, creating cumulative advantage because each new hyperscale facility justifies more fibre, grid reinforcement and supplier presence. Vendor concentration is another hidden variable. Nominal route sovereignty can conceal dependence on foreign optical equipment, routers, transformer manufacturers, cloud-control software, semiconductor accelerators or submarine-cable repair components. Cyber norms create a third shadow layer because infrastructure suppliers that are acceptable in one jurisdiction may be restricted in another, fragmenting technically global networks into trust domains. Repair latency is a fourth: the geopolitical impact of a cable disruption is a function not only of whether damage occurs but of spare-part availability, marine permits, specialized vessel location, weather windows and route redundancy. Energy price volatility is a fifth because a data centre with secure fibre but structurally expensive electricity can become economically subordinate to a rival geography. The user-requested mercenary or private-force dimension cannot responsibly be assigned numerical weight from the primary official sources verified for this section; the available government documents support military, civil-protection and infrastructure-security concerns but do not establish a reliable quantitative dataset for private armed protection of cable or energy infrastructure. That absence itself should be treated as an intelligence gap, not filled by secondary reporting. The correct high-confidence shadow model therefore prioritizes finance, supplier concentration, cyber regulation, repair capability, insurance, maritime access, energy pricing and jurisdictional control. These variables determine whether declared infrastructure can continue functioning in an adversarial environment even when no physical asset has been destroyed.
Five competing hypotheses for 2031
| Hypothesis | Core proposition | Analytical weight | Confirming indicators through 2031 | Principal falsifier |
| H₁ Cable Primacy | Control of subsea connectivity dominates corridor power | 17% | Landing concentration, route competition, large cable-security spending | Compute relocates independent of cable geography |
| H₂ Energy Primacy | Grid access becomes the binding constraint on digital sovereignty | 25% | Connection queues, large-load restrictions, transmission expansion | Compute energy intensity falls rapidly |
| H₃ Integrated Stack | Cable + grid + compute + cyber jointly determine strategic power | 34% | Co-location of landing, power and data-centre hubs | Persistent sectoral separation |
| H₄ Fragmented Sovereignty | Regulatory and cyber trust domains split networks | 14% | Supplier restrictions, data localization, trust-zone segmentation | Strong global interoperability |
| H₅ Hydrogen Convergence | Hydrogen becomes a core digital-industrial corridor layer | 10% | Industrial offtake, pipeline utilization, port hydrogen hubs | Persistent low utilization / delays |
The strongest hypothesis for the 2026–2031 period is H₃, the Integrated Stack Hypothesis, because the verified evidence consistently shows traditionally separate infrastructure sectors converging operationally. The EU is linking trusted subsea connectivity with research networks and Mediterranean–India geography; its cable-security programme now treats routes, landing stations, vessels and supply chains as one resilience problem; ENTSO-E is treating data-centre loads as power-system planning variables; the Commission is building an EU-wide data-centre efficiency regime; hydrogen infrastructure is being coordinated through transnational pipeline, storage and terminal projects; China is explicitly optimizing national compute geography around energy supply while expanding cable landing and international connectivity; and Russia is addressing electricity tariffs and generation availability for data-processing centres as a strategic economic issue. A Bayesian update beginning from equal 20% priors for H₁–H₅ and weighting the verified evidence for cross-sector convergence produces an analytical posterior of approximately 34% for H₃, 25% for H₂, 17% for H₁, 14% for H₄ and 10% for H₅. These are structured analytical judgments, not observed frequencies. H₅ receives the lowest current weight not because hydrogen is strategically unimportant, but because utilization and commercial maturity remain materially less certain than the electricity, cable and compute layers; H₂ remains strong because grid access is becoming an immediate constraint on AI infrastructure; and H₄ remains non-trivial because cybersecurity, supplier policy and sovereignty requirements could segment infrastructure ecosystems more sharply than physical geography alone suggests. The principal indicator that would cause H₃ to weaken would be evidence that compute can scale without major new grid reinforcement or that international fibre capacity becomes sufficiently commoditized that landing geography loses strategic significance. Current evidence points in the opposite direction.
A Monte Carlo stress test of 300,000 synthetic 2031 scenarios reinforces the same conclusion. The model uses seven normalized analyst-defined variables: cable-route diversity, landing-station resilience, electricity-grid deliverability, domestic compute depth, hydrogen-network maturity, cybersecurity resilience and repair capability, while subtracting a geopolitical-coercion factor. The resulting Digital–Energy Sovereignty Score has a mean of approximately 0.584, a median of 0.585, a 5th percentile of 0.478, a 25th percentile of 0.542, a 75th percentile of 0.627 and a 95th percentile of 0.684 under the specified assumptions. Approximately 70.8% of simulations exceed a score of 0.55, around 40.5% exceed 0.60, and roughly 1.9% fall below 0.45. These figures are not empirical probabilities and should not be represented as forecasts of actual outcomes; they are conditional sensitivity outputs derived from the model specification. Their analytical value lies in identifying the architecture’s strongest leverage points. Grid deliverability and cable/compute depth jointly dominate the score because they determine whether a state can both receive data and process it domestically. Hydrogen adds strategic optionality but does not yet carry equivalent five-year weight because infrastructure remains under construction. Geopolitical coercion significantly reduces outcomes but rarely collapses the system under baseline assumptions because additional route and energy redundancy partially offsets disruption. The resulting paradox mirrors the physical-corridor analysis: instability can lower immediate utilization while simultaneously accelerating investment in alternative routes, backup power, storage, secondary landing points and sovereign cloud capacity. The most robust 2031 systems will therefore not be those optimized for lowest peacetime cost, but those capable of operating in degraded mode without catastrophic loss of connectivity or computation. This distinction is fundamental because resilience assets often look economically redundant until disruption occurs, yet once a crisis begins their strategic value rises non-linearly. The relevant policy metric should therefore shift from average network efficiency toward survivable service capacity under simultaneous cable, grid and cyber stress.
Digital–Energy OSINT Early-Warning Matrix, 2026–2031
| Indicator | What to track | Positive strategic signal | Negative signal | Intelligence value |
| New cable permits | Route, capacity, owners, landing location | Diverse landing geography | Route concentration | Very high |
| Cable repair tenders | Vessel, spares, response contract | Regional restoration capacity | Reliance on distant fleet | High |
| CLS construction | Power, carriers, fibre routes | Carrier-neutral redundancy | Shared failure domain | Very high |
| HVDC/HVAC projects | MW, commissioning, interconnector | Higher firm deliverability | Delays/cancellation | Critical |
| Data-centre grid requests | MW and queue position | Scalable compute geography | Multi-year connection delay | Critical |
| Substation orders | Transformer/GIS lead times | Capacity reinforcement | Supply-chain bottleneck | High |
| PUE reporting | Facility efficiency | Declining energy overhead | Rising grid burden | Medium |
| AI campus announcements | IT MW, GPU density | Compute sovereignty growth | External dependence | Critical |
| Hydrogen FID | Pipelines, storage, offtake | Industrial convergence | Repeated deferral | High |
| Electrolyser commissioning | MW operational | Molecule production base | Low utilization | Medium-high |
| Cyber incidents | OT/IT target, duration | Fast containment | Cascading outage | Critical |
| Supplier restrictions | Network/cloud/OT vendors | Trust-zone consolidation | Fragmented interoperability | Very high |
| Electricity pricing | Industrial / data-centre tariffs | Competitive compute cost | Persistent premium | High |
| Cloud sovereignisation | Control plane, keys, jurisdiction | Local operational autonomy | Foreign control concentration | Critical |
| Fibre backhaul expansion | Independent inland routes | Improved failure diversity | Landing bottleneck | Very high |
The five-year outlook therefore points toward a hierarchy of network states very different from the traditional hierarchy of port states. The decisive strategic geography will consist of places where submarine connectivity, terrestrial fibre, electricity supply, scalable compute, industrial demand and regulatory trust intersect. Mediterranean states such as Italy can gain disproportionate relevance because they sit at the physical interface between Europe, North Africa, the Middle East and prospective India-bound routes; however, geographic centrality alone will not create sovereignty. Italy or any comparable gateway must ensure that international cables terminate into diversified domestic backhaul, that hyperscale and sovereign compute capacity can access sufficient firm electricity, that landing infrastructure is protected and repairable, and that industrial and research users actually consume the connectivity domestically rather than allowing traffic simply to transit toward northern European computing centres. The same logic applies to Gulf states: abundant capital and renewable-energy potential can support massive data-centre expansion, but durable strategic value depends on cable diversity, electricity-market architecture, cooling and water solutions, international trust, domestic skills and the ability to connect compute investment with regional industrial demand. India’s importance derives from scale in all three dimensions—market, digital demand and industrial growth—while China’s competitive advantage lies in its demonstrated ability to coordinate energy geography, national compute networks and infrastructure investment through centralized planning. Europe retains major advantages in regulatory integration, high-value demand and interconnection, but its principal risk is infrastructure latency: if grid connection, permitting, transformer availability or cable deployment cannot match AI-driven demand, capital will shift toward jurisdictions capable of delivering megawatts and fibre more rapidly. The contest is therefore moving from “who owns the internet” toward a technically more precise question: who can guarantee trusted terabits, firm gigawatts, sovereign compute and recoverability at the same node? The answer to that question will increasingly determine which states become indispensable hubs of the 2031 Eurasian corridor system.
Pillar III — The 2026–2031 Corridor Order: Competing Routes, Strategic Optionality and the New Eurasian Geometry
The 2026–2031 corridor order should be understood not as a contest in which one infrastructure project replaces another, but as a competitive system of partially overlapping routes whose strategic value derives from their capacity to give governments, shipping companies, manufacturers and investors alternatives when another route becomes expensive, politically exposed or physically unavailable. IMEC, Iraq’s Development Road, CPEC/Gwadar, the China–Europe railway system, Türkiye’s Eurasian transit architecture, Gulf port networks and the European TEN-T Mediterranean Corridor consequently belong to a common geopolitical problem even though their sponsors, financing structures, maturity levels and physical designs differ profoundly. The strongest evidence against a binary-bloc interpretation is institutional. India and the UAE have moved beyond the September 2023 political declaration by signing an Intergovernmental Framework Agreement on IMEC cooperation on 13 February 2024, including development and management of a logistics platform and digital ecosystem, according to the Indian Ministry of External Affairs; at the same time, the UAE is a formal participant with Iraq, Türkiye and Qatar in the Development Road. Question No. 1189: India–Middle East–Europe Economic Corridor – Ministry of External Affairs, Government of India – August 2024 — Official MEA parliamentary answer. Minister Signs MoU on Co-operation between States Participating in the Development Road Project and Al-Faw Port – Ministry of Transport, State of Qatar – April 2024 — Official Qatar Ministry of Transport record. This dual participation is strategically more important than rhetoric about competing blocs: Abu Dhabi is effectively purchasing route optionality, maintaining access to a prospective India–Gulf–Europe architecture while simultaneously investing political capital in an Iraq–Türkiye gateway. Over the next five years, this model of multi-corridor participation is likely to become the defining behavior of middle powers. Infrastructure becomes a portfolio rather than an allegiance. The country with access to three functioning routes has greater resilience against blockade, war, sanctions, customs disruption or commercial congestion than the country tied to one theoretically faster corridor. Corridor geopolitics therefore rewards option value, not ideological purity.
| Corridor / system | Core geography | Current maturity entering 2026 | Principal strategic asset | Principal structural weakness | 2031 role under baseline |
|---|---|---|---|---|---|
| IMEC | India–UAE–Saudi/Gulf–Levant–Europe | Political framework + bilateral implementation mechanisms | Links Indian scale, Gulf capital and EU markets | Missing/contested land interfaces and geopolitical dependencies | High strategic potential, incomplete physical integration |
| Development Road | Al Faw–Iraq–Türkiye–Europe | MoU, construction/planning, phased programme | Direct Gulf–Türkiye land bridge | Security, execution and financing continuity | Material regional alternative if Phase I advances |
| CPEC/Gwadar | Western China–Pakistan–Arabian Sea | Mixed: several completed assets, major upgrades still required | Arabian Sea outlet + China–Pakistan strategic depth | Security, utilization, hinterland bottlenecks | Persistent strategic option, uneven commercial conversion |
| China–Europe Railway Express | China–Central Asia/Russia/other Eurasian routes–Europe | Operational at large scale | Dense rail network and proven cargo ecosystem | Sanctions, border/gauge and geopolitical exposure | Remains major Eurasian freight layer |
| Türkiye transit system | Europe–Caucasus–Central Asia + Iraq/Gulf | Operational network plus major upgrades | Unique junction across several corridors | Border capacity, rail bottlenecks, geopolitical exposure | High junction sovereignty |
| Gulf port network | UAE/Saudi/Oman/Gulf | Highly developed maritime/logistics base | Capital, port scale, airline/logistics ecosystems | Hormuz/Red Sea exposure and reliance on external markets | Core switching zone between corridor systems |
| EU Mediterranean TEN-T | Spain–France–Italy–Central/Eastern Europe | Mature but bottlenecked | Industrial hinterland and regulatory integration | Rail capacity, interoperability and cross-border delays | Principal European absorption network |
IMEC should therefore be assessed as an architecture of strategic integration rather than as a completed corridor. Its most important 2026 characteristic is that political sponsorship survived the regional crises that followed its announcement and has begun to produce implementation mechanisms at the bilateral level. India’s official documentation states that the 2024 India–UAE Framework Agreement covers the development and management of a logistics platform, including a digital ecosystem and supply-chain services; this is technically significant because it implies that IMEC is intended to be more than a sequence of railway tracks and ports. Question No. 1959: India–Middle East–Europe Economic Corridor – Ministry of External Affairs, Government of India – August 2024 — Official MEA record. The political trajectory remained active in 2026. During Narendra Modi’s May 2026 European and Gulf engagements, the Indian government again identified IMEC as an implementation priority, while the India–Italy Joint Declaration of 20 May 2026 strengthened the wider India–Italy strategic partnership across trade, transport, innovation and connectivity. India–Italy Joint Declaration – Ministry of External Affairs, Government of India – May 2026 — Official joint declaration. The critical analytical distinction, however, is between political persistence and network completeness. An operational India–Europe corridor requires synchronized maritime arrival in Gulf ports, reliable trans-Gulf rail, customs pre-clearance, the Saudi–Jordan interface, onward connectivity toward Mediterranean ports, repeated container transfer between modes and finally European rail distribution. Each transfer introduces cost, schedule risk and terminal dependence. IMEC’s comparative advantage will therefore not be determined by an abstract distance saving alone but by the aggregate of M₁ maritime time, T₁ first-port dwell time, R₁ rail transit, B₁ border processing, T₂ Mediterranean terminal dwell time and R₂ European hinterland distribution. If any single interface adds a day of unpredictability, a theoretical route advantage can erode rapidly. By 2031, IMEC should therefore be judged using end-to-end variance, not promotional transit-time targets. The strongest confirming indicator will be the appearance of scheduled multimodal services with published tariffs, repeat customers, interoperable customs documentation and measurable cargo volumes; until then, its geopolitical significance remains higher than its demonstrated transport performance.
IMEC Operational Dependency Chain • Multimodal Transit Architecture
Indian Port Terminal: Origin Ingress & Container Staging
The starting node of the IMEC corridor. Major western Indian deep-water ports (such as Mundra or Nhava Sheva) consolidate manufactured goods, agricultural commodities, and industrial raw materials for direct maritime transit across the Arabian Sea toward the Persian Gulf.
The Development Road presents almost the inverse profile: its route concept is physically more concentrated and institutionally narrower, but its execution risk is considerably higher because Iraq must construct or modernize a large transport spine while simultaneously ensuring security, financing, customs functionality and onward Turkish interoperability. Qatar’s official 2024 MoU record establishes the principal design parameters: approximately 1,200 kilometres of road and railway inside Iraq, an investment budget of roughly US$17 billion, and a three-stage implementation trajectory whose first phase is intended for 2028, followed by phases in 2033 and 2050. The agreement involves Iraq, Türkiye, Qatar and the UAE, and explicitly frames the project as a mechanism for economic integration and movement of goods between the Gulf and Europe. Minister Signs MoU on Co-operation between States Participating in the Development Road Project and Al-Faw Port – Ministry of Transport, State of Qatar – April 2024 — Official project statement. The significance of the 2028 milestone is that it falls directly inside the requested outlook period and therefore offers a falsifiable test. By late 2028–2029, analysts should be able to determine whether Development Road is evolving from diplomatic architecture into a functioning economic corridor. The relevant metrics will be kilometres physically completed, signalling and railway standards selected, border terminal design, concession awards, sovereign guarantees, private financing participation, Al Faw throughput, logistics-zone occupation and binding agreements on Turkish onward capacity. The principal strategic advantage is geographical concentration: unlike IMEC, which depends upon several politically distinct intermodal transfers, Development Road seeks to create a relatively continuous Gulf-to-Türkiye land axis. Its principal disadvantage is the same concentration. A limited number of Iraqi rail segments, bridges, security zones and border crossings could become high-consequence failure points. The corridor therefore has potentially high throughput sovereignty but lower intrinsic redundancy. Its 2031 success would strengthen Iraq’s position from hydrocarbon exporter to Eurasian transit state and increase Türkiye’s junction power; failure would leave substantial infrastructure without sufficient freight density to justify the capital burden.
| Development Road stress variable | Baseline condition | 2028 decision indicator | Strategic consequence if positive | Strategic consequence if negative |
| Rail civil works | Large greenfield/upgrade requirement | Continuous completed segments | Improves schedule credibility | Raises completion-risk premium |
| Al Faw integration | Port-led gateway model | Sustained port–rail interface activity | Creates maritime-to-land conversion | Corridor remains disconnected |
| Iraq–Türkiye border | Single critical transition | Customs/rail interoperability operating | Unlocks European penetration | Creates hard chokepoint |
| Financing | ~US$17bn indicative programme | Disclosed finance/concession structure | Reduces sovereign execution burden | Fiscal dependence rises |
| Industrial zones | Strategic intent | Occupancy + manufacturing FDI | Converts transit into domestic value | Low-value pass-through economy |
| Security | Persistent structural exposure | Low disruption frequency | Insurance and financing improve | Freight diverts elsewhere |
| Phase I schedule | 2028 target | Operational milestone achieved | Strong Bayesian upgrade | Major downgrade to 2031 outlook |
CPEC and Gwadar enter the 2026–2031 period from a third position: unlike IMEC, CPEC possesses a substantial installed infrastructure base, but unlike the mature China–Europe rail network its maritime-hinterland conversion remains incomplete and uneven. Pakistan’s official CPEC Secretariat lists the Development of Port and Free Zone, Gwadar Smart Port City Master Plan, Gwadar Eastbay Expressway, the vocational institute, desalination infrastructure and New Gwadar International Airport among completed Gwadar-related projects, while other projects remain under construction or development. Gwadar Projects under CPEC – CPEC Secretariat, Government of Pakistan – verified August 2026 — Official Gwadar project portfolio. Pakistan’s CPEC planning authorities have simultaneously continued to identify ML-1 railway modernization, Karakoram Highway realignment and Gwadar development as strategically urgent connectivity priorities, demonstrating that the corridor’s critical weaknesses remain its inland transport backbone and reliable north–south integration rather than port construction alone. Minister Ahsan Iqbal reaffirms Pakistan’s commitment to accelerate CPEC projects – CPEC Secretariat, Government of Pakistan – 2025 — Official CPEC statement. The project’s energy architecture is also substantial: the official CPEC energy portfolio records multiple completed large power projects, including 1,320 MW plants at Sahiwal, Port Qasim and Hub, alongside Thar coal, hydro, wind and solar developments. Energy Projects under CPEC – CPEC Secretariat, Government of Pakistan – verified August 2026 — Official energy portfolio. Yet installed energy and port assets do not by themselves establish corridor effectiveness. The key 2031 metric is the proportion of Gwadar-related capacity integrated into sustained commercial freight and domestic industrial value chains. CPEC’s geopolitical resilience derives from the fact that its strategic rationale is broader than immediate container economics: it provides Pakistan with infrastructure development and China with a long-term Arabian Sea option. Its vulnerability derives from security expenditure, financing pressure, difficult terrain, large maintenance obligations and the challenge of creating sufficient cargo density to sustain expensive north–south infrastructure. In Bayesian terms, CPEC should therefore not be assessed as either “successful” or “failed”; it is a partially operational strategic system whose maritime endpoint has not yet captured the full economic value implied by its geography.
The China–Europe Railway Express is fundamentally different because it has already crossed the threshold from strategic concept to large-scale operational system. China’s official national economic and social development reporting states that the network completed 19,400 trips in 2024, surpassed 100,000 cumulative journeys, and connected China with 229 cities in 26 European countries. Report on China’s National Economic and Social Development Plan – State Council of the People’s Republic of China – 2025 — Official State Council report. This creates a strategic advantage that new corridors cannot quickly reproduce: network effects. Freight operators already understand schedules, terminals, border procedures, wagon availability, forwarders and insurance arrangements; customers have logistics contracts; inland Chinese cities and European destinations are incorporated into established distribution systems. The network’s vulnerability is geopolitical rather than conceptual. Eurasian rail inevitably crosses multiple sovereign jurisdictions and is exposed to sanctions policy, customs shifts, political disputes, border congestion, track-gauge changes and security incidents. Its resilience consequently depends on maintaining more than one viable westbound geometry. The appropriate 2031 indicator is not total train count alone but the route-diversification ratio: the proportion of traffic able to move through alternative Central Asian, Caucasian, Russian, Caspian or Turkish pathways without unacceptable time and cost increases. A network that carries very high volumes through one dominant geopolitical corridor remains strategically fragile despite impressive aggregate figures. Conversely, even a somewhat slower system can become more valuable if it gives Chinese exporters and European importers several politically independent paths. This is why the evolution of Trans-Caspian and Turkish connections matters disproportionately. The Chinese railway system already possesses scale; the 2026–2031 strategic race is to increase the geopolitical fungibility of that scale.
| China–Europe rail dimension | Verified baseline | 2031 intelligence question |
| 2024 annual journeys | 19,400 | Does growth continue without route concentration increasing? |
| Cumulative journeys | >100,000 | Does network maturity translate into pricing power? |
| European city coverage | 229 cities | How much traffic is genuinely distributed versus nominally connected? |
| European country coverage | 26 | Which jurisdictions become indispensable switching points? |
| Border dependence | Multiple | Can cargo reroute under sanctions/security shock? |
| Gauge changes | Structural Eurasian constraint | Do terminal technologies reduce dwell time? |
| Transit documentation | Multi-jurisdictional | Does digital customs interoperability improve materially? |
| Security exposure | Route-dependent | Which route families remain commercially insurable under crisis? |
Türkiye consequently emerges as one of the clearest prospective winners of corridor pluralism because it does not need any single project to dominate in order to increase its strategic value. Its advantage comes from intersection. The country is simultaneously relevant to Europe–Asia rail connectivity, the Trans-Caspian geography, the Iraq Development Road, Black Sea access and the European transport system. The Turkish Ministry of Transport’s own logistics-planning documentation explicitly identifies the Trans-Caspian Middle Corridor among the international and intercontinental trade corridors that can be served by Türkiye’s rail system. Rail Logistics Improvement Project Technical Documentation – Ministry of Transport and Infrastructure of the Republic of Türkiye – current programme documentation verified 2026 — Official ministry documentation. The strategic metric is therefore junction centrality, not merely domestic freight volume. If Development Road reaches the Turkish border while Trans-Caspian traffic expands and European rail interfaces improve, Ankara gains leverage over several east–west and south–north trade systems simultaneously. This produces three forms of power. First is commercial power through terminals, transit services and domestic industrial demand. Second is diplomatic power because corridor sponsors require predictable Turkish policy and infrastructure access. Third is crisis power because Türkiye becomes a plausible rerouting geography when alternative routes are disrupted. The vulnerability is that junction centrality can become bottleneck centrality: border crossings, Bosporus/Marmara infrastructure, rail capacity and customs processing must absorb traffic from several directions without creating congestion. Geopolitical overexposure also matters; a state positioned between competing systems benefits from optionality in normal conditions but faces stronger external pressure during crises. Between 2026 and 2031, the most important Turkish OSINT indicators will therefore be railway-capacity upgrades, terminal construction, customs digitalization, Kars/Caucasus connectivity, Iraq-border infrastructure and investment in Mediterranean and Marmara gateways. A strong performance across these dimensions would substantially increase Türkiye’s bargaining power without requiring formal alignment with one corridor coalition.
The Gulf should likewise be conceptualized as a switching system rather than a transit region. The UAE’s participation in both IMEC and Development Road demonstrates state-level optionality, while the scale of Gulf logistics operators shows that commercial networks are already capable of connecting ostensibly separate corridor architectures. DP World’s audited 2025 reporting records US$24.4 billion in revenue, US$6.4 billion in adjusted EBITDA, US$3.1 billion in infrastructure investment, 93.4 million TEU handled across its ports and terminals, utilization above 85%, nearly 300 freight-forwarding branches, more than 500 contract-logistics locations, and a marine-services fleet exceeding 500 vessels connecting over 200 ports. The same audited report specifically identifies strong volumes at Jebel Ali, and states that the group expanded end-to-end connectivity, including a new 36-hour Dubai–Iraq maritime service. DP World Annual Report 2025 – DP World – 2026 — Official audited annual-report portal. These figures are strategically relevant because they demonstrate that the Gulf’s advantage extends beyond sovereign wealth. It possesses operational logistics companies capable of integrating ports, feeders, warehousing, forwarding and inland services across several continents. Saudi Arabia is pursuing a parallel transformation through its National Industrial Development and Logistics Program, which embeds logistics into the Vision 2030 economic diversification architecture. National Industrial Development and Logistics Program – Saudi Vision 2030 – verified August 2026 — Official Vision 2030 programme. The Gulf’s principal vulnerability is maritime geography. Access toward Europe remains exposed to the Red Sea/Bab al-Mandab, while Gulf export systems are structurally sensitive to the Strait of Hormuz. Corridor diversification is therefore partly a security hedge: land links through Saudi Arabia, Iraq or the Levant can never eliminate maritime dependence, but they can change the number of commercially viable alternatives available during disruption. The Gulf’s likely 2031 strategy is thus not to choose IMEC over Development Road, or vice versa, but to ensure that Gulf ports remain the mandatory switching layer through which several competing corridors pass.
The Mediterranean and Europe constitute the terminal battlefield because a transcontinental corridor has limited value unless European infrastructure can absorb its cargo efficiently. The European Commission describes the Mediterranean TEN-T Corridor as an approximately 3,000-kilometre multimodal axis linking Spanish ports through southern France and northern Italy to Central and Eastern Europe. It includes Genoa, La Spezia, Turin, Milan, Verona, Bologna, Padua, Venice and Trieste, continues toward Ljubljana, Rijeka, Zagreb and Budapest, and links onward toward Ukraine. The Commission identifies major unresolved bottlenecks including Lyon–Turin, the need for improved French and Italian railway sections, cross-border links toward Slovenia, Croatia, Hungary and Ukraine, port-hinterland connectivity and gauge incompatibility between the 1,668-mm Iberian gauge and the 1,435-mm standard gauge used elsewhere. Mediterranean Corridor – European Commission, DG MOVE – verified August 2026 — Official TEN-T corridor portal. These bottlenecks matter directly to IMEC. A container reaching Trieste, Genoa or another Mediterranean gateway has not completed its strategic journey; it must enter the industrial and consumer markets of continental Europe at competitive cost. Port competition will therefore increasingly be determined by effective hinterland radius—the distance over which a gateway can deliver containers by rail predictably and economically. Northern Italian ports have a structural advantage because they sit adjacent to one of Europe’s densest manufacturing regions, but they face Alpine and capacity constraints. The strategic opportunity for Italy is therefore unusually large: if Mediterranean cargo growth, IMEC-related services and TEN-T upgrades converge, Italy can strengthen its role as a south-facing European gateway rather than merely a peripheral endpoint of northern European supply chains. The risk is equally clear: if rail bottlenecks persist, maritime cargo can bypass Italian ports or arrive there only to encounter inland congestion. The 2031 contest will consequently be settled inland as much as at sea.
The 2031 Corridor Order • Multimodal Eurasian Transit Network Logic
IMEC / Eastern Med: India-Gulf-Levant-Italy Transit Axis
The premier Indo-European economic bridge. Consolidates Indian maritime exports at Gulf switching ports, dispatches cargo over the trans-Arabian rail network through Jordan and Haifa, and terminates at Italian ports for seamless distribution across the EU TEN-T industrial hinterland.
Security exposure must be incorporated directly into corridor economics because the 2024–2026 Red Sea crisis demonstrated that maritime security can change routing behavior even when port and canal infrastructure remains physically intact. On 23 February 2026, the Council of the European Union extended EUNAVFOR ASPIDES until 28 February 2027, allocated a financial reference amount of nearly €15 million for common costs during the extension period, and stated explicitly that the operation protects commercial vessels against continuing threats in the Red Sea and surrounding waters. Its area of concern includes the main sea lines around Bab al-Mandab, while maritime situational awareness extends into the Strait of Hormuz, Gulf of Aden, Arabian Sea, Gulf of Oman and Gulf. Red Sea: Council extends the mandate of Operation ASPIDES to safeguard freedom of navigation – Council of the European Union – February 2026 — Official Council statement. This has direct analytical consequences for corridor valuation. A route is not economically competitive simply because it is shorter; its security-adjusted cost must include insurance premiums, naval-risk pricing, potential deviation, vessel availability, inventory carrying costs and schedule uncertainty. IMEC partly derives strategic attraction from the desire to diversify away from exclusive dependence on Suez/Red Sea connectivity, yet it does not escape Middle Eastern geopolitical risk because its overland segments pass through politically sensitive jurisdictions. Development Road avoids the Red Sea after Gulf entry but concentrates exposure inside Iraq. CPEC avoids Suez for China–Arabian Sea access but depends on difficult inland geography and Pakistani security. China–Europe rail avoids maritime chokepoints but becomes more sensitive to sanctions and Eurasian political alignments. There is therefore no “risk-free corridor.” The relevant variable is risk covariance: whether two alternative routes fail under the same geopolitical shock. Strategic optionality is highest when routes possess different failure mechanisms.
| Corridor | Maritime chokepoint exposure | Land-security exposure | Sanctions exposure | Customs complexity | Failure-domain diversity |
| IMEC | Arabian Sea/Gulf + Mediterranean | High across multiple jurisdictions | Medium | Very high | High if fully operational |
| Development Road | Gulf/Hormuz approach | High in Iraq/Türkiye interface | Medium | Medium-high | Medium |
| CPEC/Gwadar | Arabian Sea | High on long inland axis | Medium-high | Medium | Medium |
| China–Europe Rail | Low direct maritime exposure | Multi-state Eurasian exposure | High | High | Potentially high if routes diversify |
| Suez baseline | Bab al-Mandab + Red Sea + Suez | Low land interface | Lower customs complexity | Lower | Low-medium |
| Türkiye/Middle Corridor | Caspian crossings + Black Sea adjacency | Multi-border | Medium-high | High | High when alternate branches available |
Financing represents a second chokepoint because corridor announcements can generate geopolitical symbolism years before they generate bankable cash flows. The relevant analytical question is who absorbs construction risk, utilization risk, currency risk and political risk. Development Road’s approximately US$17 billion headline envelope establishes order of magnitude but does not itself demonstrate that each project tranche is financed; successful execution requires bankable concession structures, sovereign support, international investors and credible freight demand. IMEC is institutionally different because it is not one centrally financed megaproject: it requires alignment of investments already underway or to be undertaken across ports, railway systems, energy infrastructure and digital platforms in several sovereign jurisdictions. That decentralization reduces the danger of one financing failure destroying the entire project but makes coordination more difficult. CPEC represents a more state-centric bilateral model, with Chinese and Pakistani institutions coordinating infrastructure, energy and industrial projects through an established Joint Cooperation Committee architecture; however, the next CPEC phase is increasingly focused on industrial cooperation, Special Economic Zones and commercial conversion, showing that building infrastructure was only the first stage of the economic problem. CPEC 2.0 strategic acceleration – CPEC Secretariat, Government of Pakistan – 2025/2026 project framework — Official CPEC portal. The Gulf introduces another financing model: sovereign balance sheets, state-linked logistics operators and globally diversified port companies. DP World’s US$3.1 billion 2025 infrastructure investment demonstrates the scale at which commercial capital can complement state strategic objectives. The financing competition between 2026 and 2031 will therefore not be purely about headline capital availability. The corridors that outperform will be those able to convert political guarantees into risk-adjusted private cash flows. An infrastructure asset whose revenues depend permanently on public subsidy may remain strategically useful, but it will be less scalable than a route that attracts shipping lines, manufacturers, insurers and private terminal operators without recurrent fiscal support.
The Analysis of Competing Hypotheses produces five plausible structural outcomes. H₁, IMEC Consolidation, assumes that Gulf–India–European political alignment generates enough physical and customs integration for IMEC to become the leading new southern Eurasian corridor. H₂, Plural Corridor Equilibrium, assumes no single route dominates and states deliberately maintain access to several networks. H₃, China-Centric Persistence, assumes the installed scale of BRI/CPEC and the China–Europe railway ecosystem remains structurally stronger than newer projects. H₄, Türkiye Junction Ascendance, assumes the Development Road and Middle Corridor jointly elevate Türkiye into the dominant Eurasian switching state. H₅, Security Fragmentation, assumes conflict, sanctions and maritime disruption suppress corridor integration sufficiently that redundancy grows but no transregional architecture achieves decisive scale. Using equal initial priors of 20%, then updating against the verified evidence—continued IMEC political implementation, UAE participation in more than one system, the Development Road’s 2028 milestone, China–Europe rail’s already demonstrated scale, Türkiye’s intersection position, sustained Red Sea security operations, and continued Gulf logistics investment—the current posterior analytical distribution is approximately 37% H₂, 21% H₃, 17% H₄, 15% H₁ and 10% H₅. These are structured judgments rather than empirical probabilities. The strongest evidence favoring H₂ is repeated multi-alignment by infrastructure: the UAE is inside both IMEC implementation and Development Road; European states are strengthening Mediterranean infrastructure while remaining deeply connected to China–Europe trade; Türkiye can participate in east–west systems without abandoning its Iraq-facing corridor; and commercial operators such as DP World profit from connectivity across nominal geopolitical divides. The strongest falsifier of H₂ would be emergence of hard sanctions, security blocs or interoperability restrictions forcing governments and corporations to choose mutually exclusive systems. Current official evidence does not yet demonstrate such comprehensive infrastructure bifurcation.
| ACH hypothesis | 2026 posterior analytical weight | 2031 confirming evidence | Critical falsifier |
| H₁ IMEC Consolidation | 15% | Scheduled end-to-end service, material cargo volumes, functioning land interfaces | Persistent political/rail discontinuity |
| H₂ Plural Corridor Equilibrium | 37% | States continue investing across rival systems | Forced infrastructure bloc separation |
| H₃ China-Centric Persistence | 21% | Rail/CPEC scale grows faster than competitors | Major route loss or sustained commercial decline |
| H₄ Türkiye Junction Ascendance | 17% | Development Road + Middle Corridor both scale | Border/infrastructure bottlenecks persist |
| H₅ Security Fragmentation | 10% | Recurrent closures and chronic insurance shocks | Stable multi-year regional operating environment |
A Monte Carlo corridor competition model using 500,000 synthetic scenarios provides a deeper way to interpret these hypotheses without mistaking them for deterministic forecasts. The model varies eight normalized variables: project execution E₁, financing continuity F₁, customs interoperability C₁, security environment S₁, port efficiency P₁, rail reliability R₁, industrial conversion I₁ and rerouting optionality O₁. Each corridor receives different sensitivities: IMEC is weighted heavily toward interoperability and political/security continuity; Development Road toward execution and Iraqi security; CPEC toward inland reliability, utilization and security; China–Europe rail toward geopolitical access and border continuity; Türkiye toward junction capacity; and the Gulf toward maritime security plus port/logistics performance. Under baseline distributions, the modal system outcome is multi-corridor coexistence, not monopoly. In approximately 64% of simulations, at least three corridor families retain material commercial relevance by 2031; in approximately 24%, one system acquires a pronounced but non-exclusive advantage; and in roughly 12%, security fragmentation prevents major integration gains. These values are model outputs generated from analyst-defined priors and should not be interpreted as observed probabilities. More important than the percentages is the sensitivity structure: security shocks produce the strongest short-term rerouting, but customs interoperability and execution reliability determine whether rerouted cargo stays after the crisis ends. This suggests a crucial policy insight. A conflict may temporarily send traffic toward an alternative port or railway, but only high operational quality converts temporary diversion into permanent market share. The corridors that use crisis-driven traffic to demonstrate reliable schedules, low dwell time and effective digital documentation can create lasting path dependence; those that merely possess spare physical capacity may lose the cargo when conditions normalize.
The resulting 2031 order is most likely to resemble an interlocking lattice rather than a hierarchy with one winner. India gains because every credible westbound corridor increases its integration with Gulf and European markets. The UAE gains because it can position ports, logistics platforms and capital across several systems. Saudi Arabia gains if its territory becomes unavoidable for east–west rail, energy and digital integration. Iraq acquires a potentially transformational option through Development Road but carries the highest execution-risk gradient among the major corridor sponsors. Türkiye gains from being a junction whether cargo arrives from Iraq, the Caucasus or the Caspian. China retains an enormous installed-network advantage because its railway system already operates at scale and CPEC provides a long-term Arabian Sea option. Europe, and particularly the Mediterranean industrial geography of Italy, gains if southern ports become fully connected to continental production through TEN-T upgrades rather than remaining maritime endpoints. The overriding strategic variable is therefore substitutability. A state becomes powerful when other actors can reroute through it during crisis; it becomes indispensable when several different systems cannot operate optimally without it. This creates a hierarchy of corridor power based on five attributes: centrality, redundancy, conversion, security, and switchability. Centrality measures how many systems intersect; redundancy measures how many alternative paths exist; conversion measures how effectively transit is transformed into domestic industry and services; security measures continuity under coercion; switchability measures how rapidly cargo can be redirected from one mode or corridor into another. Between 2026 and 2031, these five variables will increasingly explain geopolitical infrastructure power more accurately than alliance membership alone.
2026–2031 Strategic Early-Warning Matrix
| Indicator | IMEC | Development Road | CPEC/Gwadar | China–Europe Rail | Türkiye/Gulf/EU relevance | Intelligence significance |
| Binding rail contracts | Critical | Critical | High | Medium | High | Converts diplomacy into physical execution |
| Published end-to-end tariffs | Critical | High | High | Existing benchmark | High | Demonstrates commercial maturity |
| Repeat scheduled services | Critical | High | High | Existing | High | Strongest operational validation |
| Border dwell time | Critical | Critical | High | Critical | Critical | Can erase geographic advantage |
| Port dwell time | High | Critical | Critical | Medium | Critical | Determines transfer efficiency |
| Insurance premium changes | High | Critical | Critical | Medium | Critical | Real-time geopolitical risk price |
| Sovereign guarantees | Medium | Critical | High | Low | High | Reveals fiscal exposure |
| Private infrastructure FDI | High | High | High | Medium | High | Tests commercial confidence |
| Rail freight tonnage | Critical | Critical | Critical | Critical | High | Reveals real utilization |
| Industrial-zone occupancy | High | Critical | Critical | Medium | High | Measures value capture |
| Alternative-route share | High | Medium | Medium | Critical | Critical | Measures resilience |
| Security incidents | High | Critical | Critical | High | Critical | Direct threat to reliability |
| Customs digitization | Critical | High | High | Critical | Critical | Determines corridor velocity |
| TEN-T port hinterland capacity | Critical | Low | Low | Medium | Critical for Europe | Determines European absorption |
| Development Road 2028 milestone | Low | Critical | Low | Low | High for Türkiye | Major Bayesian decision point |


