

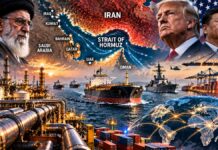















Scope: A comparative assessment of Italian maritime ports, the Northern European Range, Mediterranean and Southern European gateways, and the Balkan–Danube inland-waterway network, examining investment conditions, governance, operational performance, energy transition and climate resilience through 2030 and beyond.
Executive Summary / Bottom Line Up Front
The principal constraint on European port transformation is not the physical availability of infrastructure alone. It is the capacity to turn infrastructure, industrial land, transport access and energy investment into dependable long-term cash flows.
- Italy: The proposed Porti d’Italia S.p.A. framework seeks to centralise strategic investment coordination, but the government’s proposal and its parliamentary implementation must be distinguished. Centralisation alone cannot guarantee financeable concessions, faster authorisations or reliable private investment.
- Northern Europe: Rotterdam and Antwerp-Bruges possess major industrial clusters, established commercial interfaces and comparatively developed investment platforms. Nevertheless, the postponement of energy projects and persistent industrial cost pressures demonstrate that sophisticated governance cannot eliminate market risk.
- Mediterranean Europe: Competition will depend increasingly on railway connectivity, terminal productivity, industrial demand and the total cost of reaching inland markets, not simply on geographic proximity to global maritime routes.
- Danube and Western Balkans: Serbia’s river-port cargo turnover reached 12.816 million tonnes in 2024, according to the Danube Commission, but activity remains concentrated in bulk commodities. This is an insufficient foundation, by itself, for claims of a future large-scale intermodal logistics transformation.
- Climate resilience: Recurrent low-water conditions, flood interruptions and depth restrictions make navigability a commercial and financial variable, not merely an engineering problem.
- Energy transition: Shore power has a stronger near-term regulatory demand foundation than many proposed hydrogen projects. Hydrogen and carbon-management systems remain dependent on industrial offtake, electricity costs, infrastructure integration and project-level financeability.
- 2030 outlook: Incremental maritime electrification and targeted infrastructure improvements are more probable than comprehensive transformation into fully developed green-energy hubs.
- Strategic consequence: Governments should evaluate projects by utilisation, enforceable revenues, implementation speed and resilience rather than solely by allocated budgets or announced capacity.
The opening evidence already challenges two simplistic narratives: that Italian port weakness can be resolved through administrative centralisation alone, and that Northern European ports have effectively completed the financing challenge of decarbonisation.
Europe’s Port Crisis: Billions in Infrastructure, but Who Will Finance the Next Industrial Transformation?
From Italy’s contested governance reform to Rotterdam’s industrial retrenchment and the Danube’s collapsing cargo flows, Europe’s port competitiveness is being decided less by infrastructure spending than by the ability to turn public investment into reliable commercial returns.
Europe is committing substantial public resources to modernise its ports without resolving the institutional and commercial conditions needed to make those investments productive. Italy is considering Porti d’Italia S.p.A. while financing port electrification; Rotterdam is advancing major energy infrastructure as industrial customers close facilities or postpone investment; and the Danube remains exposed to freight volatility and recurrent low-water restrictions. The contradiction carries direct fiscal and industrial consequences. Under Regulation (EU) 2024/1679, the European Union retains its 2030 core transport-network objective, yet the European Court of Auditors has concluded that the deadline will not be met. Europe’s port problem is no longer principally about building capacity. It is about determining who finances it, who bears the risk and whether sufficient commercial demand exists to justify the investment.
Public ownership is not the problem. Uncertain investment rights are.
Italy’s proposed port-governance reform exposes a fundamental weakness in the European infrastructure debate. The existing system, established under Law No. 84 of 28 January 1994 and subsequently reorganised around the Autorità di Sistema Portuale, assigns public authorities responsibility for planning, regulating and coordinating port activities while commercial operators undertake much of the terminal investment and cargo handling. This separation protects public functions but creates investment dependencies when a private operator must finance assets whose profitability relies on infrastructure, authorisations or decisions controlled by other institutions.
The proposed Porti d’Italia S.p.A. is intended to strengthen national coordination of strategic investments. On 23 September 2026, the Italian Ministry of Infrastructure and Transport reported that parliamentary examination had reached the voting stage on amendments, with 622 amendments submitted by the August deadline. The proposal’s potential value lies in coordinating projects that exceed individual port boundaries. Its principal risk is introducing another decision-making authority without clarifying concession rights, financing responsibilities or implementation deadlines. A new company can centralise expenditure without necessarily improving the conditions under which private capital is committed. Italian Ministry of Infrastructure and Transport, Port Reform, September 2026.
The legal framework already provides instruments for greater certainty. Article 18 of Directive 2014/23/EU requires the duration of qualifying concessions exceeding five years to reflect the period reasonably necessary to recover investment and obtain a return on capital. Directive (EU) 2021/1187 establishes a four-year permit-granting framework for qualifying TEN-T infrastructure, subject to specified exclusions and exceptions. Neither instrument guarantees the timely completion of a port project. The essential problem remains the allocation of construction delays, regulatory changes, financing obligations and the financial consequences of unavailable connecting infrastructure. Directive 2014/23/EU; Directive (EU) 2021/1187.
The European Court of Auditors quantified the wider consequences in Special Report 02/2026, published on 19 January 2026. Among five major transport projects with comparable information, average delays had reached 17 years against original plans. The Lyon–Turin railway connection was projected for 2033 rather than its original 2015 opening, while the Brenner Base Tunnel had shifted from 2016 to 2032. These are not port projects, but their relevance to Mediterranean maritime gateways is direct: a terminal may be completed years before the rail infrastructure required to reach its intended market. The concessionaire carries commercial exposure without controlling the public works on which its revenues depend. European Court of Auditors, Special Report 02/2026.
The numbers expose Europe’s unequal capacity to absorb risk.
Rotterdam’s 2025 results demonstrate the advantages of a commercially managed public port corporation, but also the limits of institutional sophistication. The Port of Rotterdam Authority reported €940.4 million in revenue, €583.6 million in EBITDA, €266 million in net profit and €291.4 million in capital investment. Cargo throughput reached 428.4 million tonnes, down 1.7%, while container activity increased to 14.2 million TEU. The authority also distributed €186.2 million in dividends to its public shareholders. Its financial structure supports substantial infrastructure expenditure, but the surrounding industrial economy remains vulnerable to energy costs, competitive pressure and postponed investment. Port of Rotterdam Authority, 2025 Results.
Antwerp-Bruges handled 266.5 million tonnes in 2025, a decline of 4.1%. Industrial action caused approximately 25 days of disruption and an estimated loss of 2.4 million tonnes. Hamburg handled 114.6 million tonnes and 8.3 million TEU, with containers representing nearly 71% of total cargo tonnage. These figures demonstrate three different dimensions of port competitiveness: Rotterdam’s financial and industrial scale, Antwerp-Bruges’ exposure to operational disruption and Hamburg’s dependence on the effectiveness of its container and inland-transport system. None can be ranked credibly through tonnes handled alone. Port of Antwerp-Bruges, 2025 Results; Hamburg Port Authority, 2025 Results.
Mediterranean evidence is equally revealing. Valencia handled 5.663 million TEU in 2025, up 3.41%, but transit containers fell 7.39% while loading and unloading containers increased 14.35%. Marseille-Fos reported approximately 74 million tonnes, including 47.6 million tonnes of liquid bulk, alongside €235.3 million in port-authority revenues and €105 million in investment. The French National Assembly’s July 2026 assessment showed that HAROPA’s throughput had declined from 97.4 million tonnes in 2010 to 84.7 million tonnes in 2025, while Marseille fell from 86 million to approximately 74 million tonnes. The Mediterranean’s commercial challenge is not insufficient maritime geography; it is converting maritime access into competitive inland logistics and sustained industrial demand. Valencia Port Authority, 2025 Statistics; Marseille-Fos, 2025 Results; French National Assembly, Report No. 3020, July 2026.
Energy transition is producing infrastructure faster than guaranteed demand.
Italy’s cold-ironing programme illustrates the distinction between financial allocation and operational achievement. The national complementary investment framework allocated €700 million over 2021–2026, while the PNRR monitoring framework identified a €400 million measure under M3C2, Investment 2.3. The government reported a portfolio of 24 installations in 16 ports, with procurement milestones supported by awards involving 20 installations in 13 ports. These figures concern different programme and implementation perimeters and cannot simply be added together. An awarded contract does not establish that an installation is commissioned, connected or supplying electricity to vessels. Italian Government, Sixth PNRR Implementation Report, 2025.
The European Commission separately authorised an Italian €570 million state-aid scheme, extending through 2033, to reduce electricity-system charges associated with shore-side power. This addresses operating costs rather than merely financing physical installations. Regulation (EU) 2023/1804 requires qualifying maritime ports to achieve specified shore-power infrastructure coverage by 31 December 2029; Regulation (EU) 2023/1805 introduces corresponding obligations for relevant vessels from 1 January 2030. The regulatory demand is real, but commercial performance will depend on vessel connections, electricity prices and actual energy delivered. On 27 October 2026, an Italian parliamentary question raised concerns about the regulatory organisation of shore-power services, showing that construction and the legal capacity to operate a service remain separate issues. European Commission, State Aid SA.105117; Regulation (EU) 2023/1804; Regulation (EU) 2023/1805.
Rotterdam’s Porthos project provides an equally important warning. The carbon transport and storage system is designed for approximately 2.5 million tonnes of CO₂ annually, yet its expected operational start was revised from the end of 2026 to no earlier than the second half of 2027. Pipeline and injection-well progress had not eliminated the risks associated with integrating compression, offshore storage and industrial operations. The lesson for hydrogen valleys, electrolysers and multi-energy terminals is clear: announced capacity, financial commitments, completed construction and commercial operation are separate milestones. Industrial customers must ultimately purchase the service, and the resulting revenues must support the project’s financial obligations. Porthos, Revised Project Schedule, April 2026.
The Danube’s freight contraction exposes a deeper failure of corridor integration.
The Balkan–Danube system reveals the physical limits of infrastructure policy more sharply than many maritime gateways. According to the CCNR’s 2025 statistical annex, the selected major Danube ports handled 45.5 million tonnes in 2025, down 22.8% from 58.9 million tonnes in 2024. These figures represent the reporting ports, not every tonne transported along the river. Serbian results were sharply differentiated: Smederevo increased 11.6% to approximately 3.1 million tonnes, while Pančevo declined 41.9% to 1.3 million tonnes and Novi Sad fell 42.7% to 0.8 million tonnes. Prahovo increased 5% to approximately 1.4 million tonnes. This divergence reflects different industrial and cargo markets; it cannot be explained by drought alone. CCNR, European Inland Navigation Statistical Annex, 2025.
The hydrological evidence nevertheless establishes a serious reliability problem. Official Danube Commission material recorded 116 days below the Low Navigable Water Level on the Bulgarian Danube section in 2025, compared with 30 in 2024 and 111 in 2022. These observations do not indicate that the entire river was closed for those periods. They demonstrate recurring restrictions capable of reducing permissible vessel loads and increasing transport costs. An inland terminal can possess modern infrastructure while remaining commercially disadvantaged if vessels must operate below normal loading capacity. Danube Commission, Hydrological Conditions and Achieved Fairway Depths, March 2026.
The Sava system reinforces the diagnosis. Its selected port and transshipment figures increased only 2.2% to 2.838 million tonnes in 2025, while Sremska Mitrovica fell from 446,000 to 55,000 tonnes. Along the Lower Danube, Constanța’s inland-waterway handling declined from 21.7 million tonnes in 2023 to 13 million tonnes in 2025, while Izmail fell from 20.3 million to 7.6 million tonnes. Changes in Ukrainian export routes, commodity demand and navigation conditions all affected the region. The Danube’s geographical connection to the Black Sea does not create a reliable freight market without commercially viable industrial customers, functioning multimodal links and navigation conditions that operators can price into their contracts. CCNR, European Inland Navigation Market Observation.
Europe’s competitors will exploit the gap between port capacity and inland access.
The competitive relationship between the Northern Range and the Mediterranean cannot be resolved through terminal expansion alone. Genoa’s access to northern Italian industry depends on the reliability of rail and inland connections; Trieste’s commercial position rests on its relationship with Central European markets; Gioia Tauro’s container volumes depend heavily on maritime network decisions; and Valencia’s different trends in transit and gateway traffic show why gross container throughput is an insufficient measure of economic penetration. The revised TEN-T framework offers a common investment architecture, but the delays documented by the European Court of Auditors weaken the assumption that corridor integration will be completed uniformly by 2030. Regulation (EU) 2024/1679; European Court of Auditors, January 2026.
The United Kingdom provides an institutional counterpoint through its combination of private, trust and other port ownership structures. The UK Department for Transport’s governance framework demonstrates that commercial autonomy can coexist with different forms of ownership and public oversight. France and Germany face different pressures: the former must improve the competitive reach of its maritime gateways, while the latter must preserve the effectiveness of established industrial and railway connections. In the Western Balkans, Serbia’s non-EU status introduces an additional requirement for cross-border regulatory and operational coordination. None of these constraints can be eliminated by adopting Rotterdam’s corporate form or by creating a national investment company. UK Department for Transport, Ports Good Governance Guidance.
The distinction between the state as regulator and the state as commercial operator consequently matters less than the ability to allocate risks rationally. Governments must finance or coordinate infrastructure producing wider public benefits, while private investors need enforceable rights and commercially credible revenues. A hydrogen terminal without industrial buyers, a river berth without dependable navigation or a container facility without reliable rail access is not transformed into a productive asset simply because its construction was publicly funded.
By 2028, the cost of inaction will appear on balance sheets, not policy documents.
Over the next 12–24 months, from late 2026 to late 2028, the immediate test will be implementation rather than another expansion of investment announcements. Italy’s port reform will have to demonstrate whether it can improve financing conditions and project delivery. Shore-power programmes will face pressure to convert publicly financed installations into functioning commercial services ahead of the 2030 regulatory requirements. Rotterdam’s industrial-energy projects will have to move from construction towards measurable output, while Mediterranean gateways will remain exposed to the availability of connecting infrastructure. On the Danube, operators will continue confronting the combined effects of freight volatility and unpredictable navigation conditions.
The costs of failing these tests will fall unevenly. Taxpayers may finance infrastructure whose utilisation remains below expectations; terminal operators and industrial investors will carry capital costs while waiting for public connections or commercial demand; shipping companies and freight customers will pay through delays, additional handling and unreliable routing; and industrial regions may lose activity when logistics and energy services become commercially uncompetitive. The European Court of Auditors’ finding that the 2030 core-network deadline will not be achieved establishes the scale of the implementation problem. The next investment cycle will determine whether Europe reduces that exposure or finances another generation of assets whose productive value emerges years after their construction budgets are approved.
Navigational Index
Pillar I — Institutional Architecture, Investment and Competitive Geography
Chapter 1. Italian Port Systems: Regulatory Constraints, Concessions and the Economics of Investment
The legal and financial architecture of the Autorità di Sistema Portuale; the relationship between public functions and commercial participation; concession duration and stability; fiscal incentives and ZES Unica; the proposed Porti d’Italia S.p.A. reform; industrial-land development; and the conditions under which private investors commit long-duration capital.
Chapter 2. Northern European Ports: Governance, Capital Mobilisation and Industrial Competitiveness
Rotterdam, Antwerp-Bruges, Hamburg, Amsterdam and their competitors. Comparative treatment of institutional ownership, corporate autonomy, revenue generation, project companies, debt capacity, industrial investment, energy networks and the economic limits of the Northern Range model.
Chapter 3. Mediterranean Gateways: Hinterland Access, Industrial Demand and Competitive Positioning
Italy, France, Spain, Greece and selected Mediterranean competitors, with separate attention to the United Kingdom as an investment-governance comparator. Assessment of Genoa, Trieste, Gioia Tauro, Marseille-Fos, Valencia, Algeciras and other relevant hubs, including rail connectivity, transshipment, energy-import infrastructure and the distinction between gateway and redistribution functions.
Pillar II — Operational Performance, Energy Economics and Climate Exposure
Chapter 4. Balkan and Danube River Ports: Throughput, Navigability and Structural Underutilisation
Serbia’s Belgrade, Novi Sad, Smederevo, Pančevo and Prahovo systems; Croatia’s river ports; Romania and Constanța; the Sava–Danube connections; freight composition, cargo statistics, berth utilisation, containerisation, missing intermodal links, drought exposure and corridor reliability.
Chapter 5. Port Energy Transition: From Announced Capacity to Operational and Financeable Projects
Cold ironing, shore-side electricity, port energy communities, hydrogen valleys, electrolysers, hydrogen derivatives, LNG, carbon capture and storage, electricity networks and energy-import terminals. An investment-stage audit distinguishing policy announcements, project approvals, financial commitments, commissioning and actual commercial operations.
Pillar III — Reform Choices, Financial Resilience and Strategic Outlook
Chapter 6. Governance Reform and Investor Certainty: The State as Regulator, Enabler or Operator
Comparative evaluation of public-management and corporatised models; concession protection; contractual allocation of construction, demand and regulatory risks; dedicated energy-investment vehicles; private equity participation; procurement reform; fixed procedural timelines; and fiscal-policy durability.
Chapter 7. The European Port Outlook: Realistic Scenarios for 2027, 2028–2030 and 2031–2035
A baseline under existing rules and a conditional reform scenario, with explicit investment, throughput, energy, climate and geopolitical dependencies. Qualitative forecasts grounded in observed asset cycles rather than unsupported numerical probabilities.
Chapter 8. Strategic Net Assessment: Residual Risks, Monitoring Indicators and Policy Decisions
Decision-relevant risks, evidence gaps, country divergences, implementation thresholds, climate-adaptation requirements and an operational framework for distinguishing productive investment from the creation of underused assets.
Master Abstract
Europe’s port competitiveness is increasingly determined by the quality of investment institutions
Europe’s maritime and inland-port systems are entering a period in which capital requirements are rising faster than the certainty of the revenues available to finance them. The transformation involves several distinct investment markets: freight-handling terminals, public access infrastructure, railway corridors, high-capacity electricity connections, hydrogen production and distribution, carbon-management facilities and climate adaptation. These markets have different risk profiles and cannot be financed sustainably through one institutional model. Public authorities remain indispensable for territorial planning, strategic infrastructure and environmental protection, but the financial viability of commercial facilities depends on predictable concession rights, enforceable contracts and customers prepared to purchase the services produced.
The strategic distinction is between public expenditure that creates physical capacity and investment frameworks that create economically productive capacity. The revised European TEN-T regulation establishes a framework for network completion and resilience, with core-network milestones in 2030, extended core-network milestones in 2040 and comprehensive-network milestones in 2050. These dates create planning obligations and investment priorities. They do not establish that corresponding freight demand, commercial services or private financing will emerge automatically. Trans-European Transport Network — European Commission — 2024. Mobility and Transport+1
Italy’s institutional reform addresses coordination, but not necessarily investment certainty
Italy illustrates the central institutional problem. Its port system operates within the framework of Law No. 84/1994 and subsequent amendments, with port-system authorities exercising public functions in a market that requires substantial private commitments. The government’s Porti d’Italia S.p.A. proposal envisages a publicly owned body for strategic infrastructure coordination while maintaining territorial responsibilities within the existing port-authority system. The Ministry of Infrastructure and Transport reported parliamentary consideration and amendment voting in September 2026; that announcement must not be mistaken for proof that the proposed structure has entered full legal and operational effect.
The investment consequences depend on the final legislation and its implementation. A national investment vehicle could improve the coordination of major infrastructure expenditure, reduce fragmentation and address projects crossing multiple port jurisdictions. Conversely, the model could introduce an additional decision-making layer if capital allocations, investment powers, concession responsibilities and territorial authorisations are not precisely separated. The decisive test will be whether private investors obtain longer and more reliable visibility over project revenues, implementation deadlines, fiscal treatment and contractual risk allocation. Law No. 84/1994 — Italian Republic; Port Governance Reform — Ministry of Infrastructure and Transport — September 2026. Normattiva+1
Northern Europe demonstrates institutional strength without immunity from industrial decline
The Northern Range provides an important benchmark, although it is not a uniform institutional system. Rotterdam, Antwerp-Bruges, Hamburg and the Seine corridor differ in ownership arrangements, financing and operational governance. Their common advantage is the concentration of freight flows, established industrial customers, logistics networks and infrastructure that permits complementary investments across energy, petrochemicals, storage and transport.
The distinction between infrastructure capacity and industrial competitiveness is particularly visible in Rotterdam. The Port of Rotterdam Authority reported 428.4 million tonnes of throughput in 2025, a decline of 1.7%, alongside container growth to 14.2 million TEU. It also reported industrial closures and postponed investments, particularly in renewable fuels. Antwerp-Bruges recorded 266.5 million tonnes in 2025, down 4.1%, notwithstanding comparatively stable container traffic. These observations weaken any interpretation that corporatised or commercially active port governance automatically produces successful industrial decarbonisation. They instead suggest that institutional capacity is a necessary enabling factor, while electricity costs, industrial margins, international competition and offtake conditions remain decisive. Rotterdam Throughput — Port of Rotterdam Authority — February 2026; 2025 Port Results — Port of Antwerp-Bruges — January 2026. Port of Rotterdam+1
The Danube corridor exposes the difference between geographic potential and commercial performance
The Danube offers a geographically significant inland connection between Central Europe, the Balkans and the Black Sea. Yet a river corridor does not function as a competitive transport system merely because a navigable route exists. Commercial reliability also requires sufficient sailing depth, maintained channels, efficient border procedures, cargo consolidation, industrial demand, integrated railway terminals and predictable delivery times. Serbia demonstrates this distinction. The Danube Commission records Serbian river-port turnover of 12.816 million tonnes in 2024, compared with 12.031 million tonnes in 2023. Construction materials, petroleum products, agricultural commodities and iron-related cargo account for substantial activity, whereas these figures do not demonstrate a mature containerised logistics system.
The climate dimension compounds the operational challenge. Low-water conditions reduce permissible vessel loading, increasing the cost per tonne and weakening reliability against road and rail alternatives. Floods can also interrupt navigation. Moreover, the EU’s revised Rhine–Danube corridor includes Serbia, while the separately designated Western Balkans–Eastern Mediterranean corridor does not itself contain inland waterways. This distinction matters for the planning of investments, legal integration and the assignment of corridor priorities. Market Observation for Danube Navigation: Results in 2024 — Danube Commission — 2025, pp. 38–40; Rhine–Danube Corridor — European Commission. danubecommission.org+2
The likely 2030 outcome is selective modernisation rather than uniform transformation
The most defensible forecast is an uneven European port transition. Shore-side electricity will benefit from comparatively clear EU regulatory requirements, particularly the obligations applying from 2030 to relevant container and passenger ships at designated ports. Hydrogen, synthetic fuels and carbon-management systems face more heterogeneous demand, production-cost and investment risks. Rotterdam’s Porthos project illustrates both the potential and the difficulty of implementing major shared infrastructure: despite advanced construction activity, the port authority’s 2026 financial reporting indicated that operations were not expected before the second half of 2027.
For Italy, the principal uncertainty is whether institutional reform will deliver enforceable contractual improvements rather than simply revised administrative responsibilities. For Northern Europe, the question is whether industrial customers retain sufficient competitiveness to support investments in emerging energy systems. For Mediterranean ports, improved access to inland markets is likely to matter more than additional transshipment capacity alone. For the Danube, reliable navigation and commercially useful multimodal connections are more urgent than speculative claims of large-scale logistics expansion. The probable trajectory is therefore differentiated: relatively mature hubs consolidate selected energy and logistics functions; investment-constrained gateways progress more slowly; and river ports remain vulnerable to physical, commercial and institutional bottlenecks.
FuelEU Maritime Regulatory Guidance — European Commission; 2026 Interim Financial Reporting — Port of Rotterdam Authority.
Key Evidence Table
Reported statistics retain their original scope. EU harmonised freight statistics and individual port-authority reporting are not necessarily directly comparable.
| Indicator | Value / status | Reference period | Issuer and source |
|---|---|---|---|
| EU maritime freight | 3.4 billion tonnes | 2024 | Eurostat, Maritime Freight Statistics |
| Rotterdam throughput | 428.4 Mt; −1.7% | 2025 | Port of Rotterdam Authority, 2025 results |
| Rotterdam containers | 14.2 million TEU; +3.1% | 2025 | Port of Rotterdam Authority, same source |
| Antwerp-Bruges throughput | 266.5 Mt; −4.1% | 2025 | Port of Antwerp-Bruges, 2025 results |
| HAROPA maritime throughput | 84.7 Mt; +2% reported | 2025 | HAROPA PORT, Annual Traffic Results |
| HAROPA containers | 3.2 million TEU; +4% | 2025 | HAROPA PORT, same source |
| Serbian river-port turnover | 12.816 Mt | 2024 | Danube Commission, Market Observation, Table 3.11 |
| Croatian river-port turnover | 0.392 Mt | 2024 | Danube Commission, same publication, Table 3.10 |
| EU TEN-T core network | Target: 2030 | Regulation adopted 2024 | European Commission, TEN-T Framework |
| EU shore-power obligations | Relevant container and passenger ships from 2030 | Regulatory milestone | European Commission, FuelEU Maritime Guidance |
| Porti d’Italia S.p.A. | Proposed public investment-coordination company; parliamentary process documented | September 2026 | Italian MIT, Reform Update |
| Porthos CCS | Approximately 2.5 Mt CO₂/year planned; commissioning delayed | 2026 reporting | Port of Rotterdam Authority, Project and financial reporting |
Mt = million metric tonnes; TEU = twenty-foot equivalent units. Port throughput, river cargo turnover and planned project capacity are distinct measures and must not be added together. Sources are institutional or official records. The available Danube tables establish cargo turnover, not berth-capacity utilisation.
Preliminary Structural Comparison
| Port system | Governance and investment context | Energy-transition position | Principal vulnerability | Probable 2030 direction |
|---|---|---|---|---|
| Italy | Public-law port authorities; national reform under parliamentary consideration | Funded cold-ironing programme; project economics remain port-specific | Administrative coordination, concession certainty, grid access | Selective electrification; reform-dependent private investment |
| Netherlands — Rotterdam | Corporatised public port authority with industrial and commercial investment capabilities | Advanced CCS and hydrogen infrastructure development; industrial investment pressures | Electricity costs, industrial demand, project delays | Energy infrastructure expansion, subject to commercial demand |
| Belgium — Antwerp-Bruges | Public corporate port authority; major industrial and logistics cluster | Energy and infrastructure transition supported by industrial ecosystem | Congestion, chemical-sector economics, energy costs | Logistics consolidation and selective energy investment |
| Germany — Hamburg | Publicly influenced landlord-port system with commercial terminal operators | Shore-power deployment and wider energy-transition activity | Railway capacity, industrial competition, investment execution | Gradual modernisation alongside conventional cargo handling |
| France — HAROPA / Marseille-Fos | Public port institutions with industrial and transport partnerships | Shore power, multimodal and energy-related projects | Hinterland access and project profitability | Selective growth in corridor-integrated services |
| United Kingdom | Mixed landlord, private and trust-port structures | Port-specific investment approaches rather than EU-wide AFIR obligations | Grid availability and project-level demand certainty | Uneven but potentially flexible private-capital deployment |
| Spain and wider Mediterranean | Predominantly public landlord models with concession-based operations | Electrification, alternative fuels and energy-import opportunities | Transshipment competition and hinterland connectivity | Concentration of investment at stronger gateways |
| Serbia — Danube and Sava ports | Public governance combined with commercial port operators | Early-stage diversification; limited evidence of scaled alternative-fuel operations | Low water, bulk dependence and multimodal gaps | Incremental modernisation; limited containerisation without structural changes |
| Croatia and Romania — Danube system | EU regulatory and corridor framework; nationally differentiated governance | Selective modernisation and transport integration | Hydrology, variable infrastructure quality, cargo volatility | Corridor-specific rather than uniform expansion |
These are qualitative assessments, not standardised investment ratings. Confidence is highest for documented governance structures and observed traffic, and lower for project-by-project financial certainty and 2030 outcomes.
Competing Structural Pathways
Three pathways are materially plausible. They are not fully mutually exclusive across countries or individual ports.
| Hypothesis | Diagnostic support | Evidence limiting the hypothesis | Current standing |
|---|---|---|---|
| H1 — Public centralisation improves execution | A national body could coordinate strategic works and capital allocation | Additional governance layers may not resolve commercial-contract uncertainty | Conditional; medium confidence |
| H2 — Commercially autonomous investment platforms achieve superior mobilisation | Industrial clusters, established operators and dedicated project structures can support large investments | Northern European industrial closures and delayed energy projects show persistent market risk | Strong institutional mechanism; high confidence |
| H3 — Physical, energy-market and climate constraints dominate institutional reform | Danube navigability constraints and industrial energy costs directly affect operating economics | Better contracts and targeted infrastructure can mitigate some constraints | Strong for river transport and energy projects; high confidence |
Net assessment: H2 and H3 offer the strongest explanation of observed differences, but they are complementary rather than contradictory. Commercial autonomy can increase capital mobilisation without overcoming poor underlying project economics. Centralisation may improve execution where responsibilities are fragmented, yet its investment effect remains dependent on the operative legal and contractual arrangements.
Preliminary Forecast and Confidence Assessment
2027 — Infrastructure completion and regulatory implementation
High confidence
Ongoing electrification, port works and administrative implementation are more probable than broad restructuring of port business models. Project delays will remain consequential.
2028–2030 — Selective energy and logistics transformation
Medium confidence
Stronger commercial gateways are likely to progress in shore power, freight intermodality and selected energy systems. Hydrogen scaling remains dependent on cost and customer commitments.
2031–2035 — Greater divergence between port systems
Medium confidence
Ports with dependable industrial demand, grid connections, robust contractual structures and reliable multimodal access are likely to outperform weaker counterparts. Climate adaptation becomes increasingly material for the Danube.
Principal Evidence Gaps and Watch Indicators
The most consequential unresolved questions concern commercially usable capacity rather than announced capacity.
1. Italian reform implementation. Publication of the final parliamentary act, subsequent implementing measures, the financial powers of Porti d’Italia S.p.A. and the relationship with existing concession authorities. Changes in administrative authority should not be confused with proven improvements in bankability.
2. Real investment mobilisation. Signed financing agreements, committed private equity, financial closes, concession extensions and observed project completion times. Published investment allocations do not measure the private capital actually mobilised.
3. Port-energy operations. Commissioned electrical capacity, operational shore-power connections, electricity actually delivered to vessels, offtake agreements, hydrogen production and operational CCS injection. These indicators must be separated from tender awards and engineering announcements.
4. Serbian and Balkan asset utilisation. Port-specific berth capacity, cargo moved per berth, terminal operating hours, container lifts, rail freight connections and available vessel draught. The currently cited official turnover statistics do not establish a comparable regional utilisation rate.
5. Danube hydrological reliability. Annual days below navigable-depth thresholds, loading restrictions, flood-related closures, dredging expenditure and river-transport cost penalties. Data should be collected by river section because corridor-wide averages can conceal critical bottlenecks.
6. Industrial competitiveness. Electricity prices for energy-intensive customers, industrial closures, signed energy-infrastructure contracts, refining and petrochemical production trends, and sustained demand for low-carbon fuels.
7. Mediterranean competition. Import/export gateway volumes versus transshipment, inland rail market shares, end-to-end freight costs, vessel-service changes and customs processing times. Traffic growth without commercially attractive hinterland access does not automatically imply competitive convergence with Northern Europe.
Decision-Useful Visualisation
Selected European maritime ports — 2025 reported cargo throughput
Million metric tonnes. Individual port-authority reporting; illustrative comparison only, not the harmonised Eurostat series.
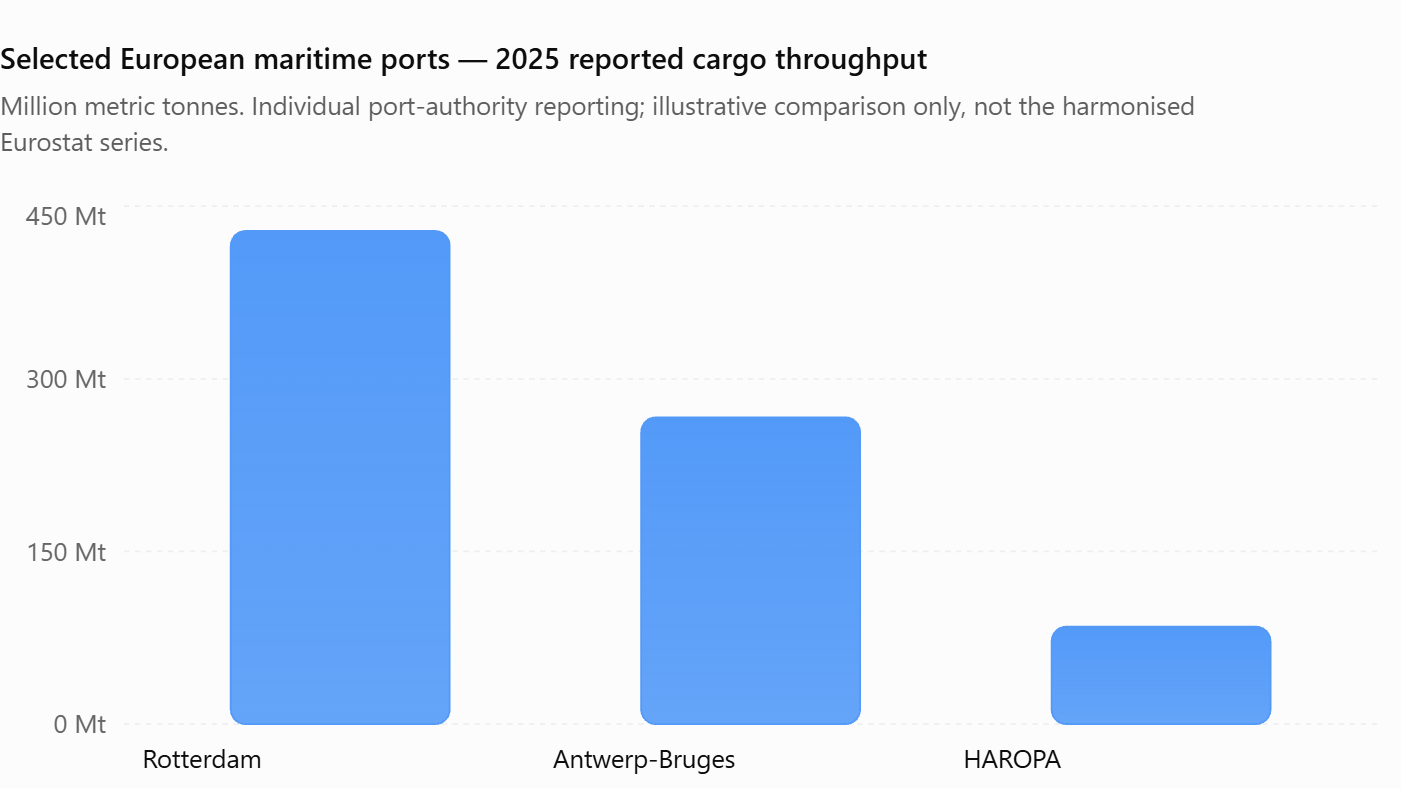
The source record supports this limited traffic comparison. A quantitative cross-border investment-efficiency dashboard would require harmonised data on returns, capital expenditure, private commitments, asset utilisation and project delivery that have not yet been established on a comparable basis.
Opening Net Assessment
The evidence supports a clear strategic position. Europe’s next phase of port competition will be decided increasingly by investment execution, commercial integration and operational reliability, rather than by nominal infrastructure capacity alone. Italy faces an institutional and contractual test; Northern Europe faces an industrial competitiveness and energy-cost test; the Mediterranean faces a hinterland-integration test; and the Danube faces the combined challenge of hydrological uncertainty and economically viable freight demand.
These are different manifestations of a common problem: infrastructure has value only when it can provide a reliable service at a cost that customers are prepared to pay. Policies that finance physical construction without resolving these underlying conditions risk creating assets whose productive use remains substantially below their design potential.
The most defensible policy direction is not indiscriminate privatisation or administrative centralisation. It is the allocation of responsibilities, capital and risks to the institutions and investors best able to manage them, supported by enforceable contracts, transparent implementation and independently measurable operating results.
PORT SYSTEMS
UNDER STRUCTURAL PRESSURE
Investment governance, cargo concentration, energy transition and climate resilience across European maritime gateways and the Balkan–Danube network.
Evidence cut-off: 31 October 2026Animated 3D Port Scale Comparison
Reported 2025 maritime cargo throughput. Select a column to inspect the underlying figure and its significance.
Scale begins at zero. Columns are proportional to tonnes; isometric faces are decorative. Different reporting perimeters are not fully harmonised.
Rotterdam
The largest throughput among the three selected reporting systems. Industrial concentration and extensive logistics infrastructure support investment capacity, but energy costs and industrial competitiveness remain material constraints.
Interpretation
Throughput measures the physical volume handled. It does not measure profitability, carbon efficiency, financial returns or project execution speed. Differences in cargo composition also limit direct comparison.
The Port Investment Conversion Chain
How public authority, commercial revenue certainty and execution capacity must interact to convert strategic policy into productive infrastructure.
Stable concession provisions, enforceable allocation of risks, environmental permissions and credible implementation timelines.
Public enabling infrastructure combined with private equity, debt, customer commitments and revenue mechanisms suited to asset lifetimes.
Commissioned and connected assets with measurable utilisation, operational reliability, commercial demand and long-run cost recovery.
Port Governance and Structural Exposure Matrix
Qualitative institutional assessments. Select a geographic lens to filter the comparison.
| System | Governance | Principal capital constraint | Energy-transition position | 2030 outlook |
|---|---|---|---|---|
| Italy | Public port-system authorities | Concession, procedural and reform implementation certainty | Shore-power deployment; wider projects uneven | Selective modernisation |
| Rotterdam | Corporatised public port authority | Industrial economics and customer demand | Advanced CCS and hydrogen development; delays remain | Selective energy expansion |
| Antwerp-Bruges | Public corporate port authority | Industrial competitiveness and energy costs | Industrial-cluster energy investment | Logistics consolidation |
| Hamburg | Public landlord and commercial operators | Infrastructure coordination and connectivity | Shore-power and energy-related development | Incremental upgrading |
| France / HAROPA / Marseille-Fos | Public port institutions with commercial partners | Hinterland and project profitability | Electrification and energy projects | Corridor-dependent growth |
| Spain / Mediterranean | Public landlord systems and concessions | Transshipment competition and hinterland access | Selected alternative-energy projects | Investment concentration |
| United Kingdom | Mixed private, trust and other port models | Grid and project-specific demand | Port-specific energy strategies | Uneven private deployment |
| Serbian Danube / Sava | Public oversight and commercial operators | Navigability, multimodal links and demand | Limited evidence of scaled low-carbon systems | Climate-constrained growth |
| Croatia / Romania river ports | National structures within the EU framework | Channel conditions and infrastructure integration | Selective upgrading | Corridor-specific growth |
From Announcement to Commercial Operation
Illustrative project-stage framework. Select each stage to see which evidence establishes genuine progress.
Announced or Proposed
Policy announcements, memoranda and feasibility studies establish intentions. They do not demonstrate funding, commissioning or recurring revenues.
Bands display the selected conceptual project milestone, not measured deployment percentages or sector completion rates.
Interactive 2027–2035 Scenario Engine
Qualitative conditional scenarios, not numerical forecasts. Select the policy framework and time horizon.
Institutional framework
Forecast horizon
Implementation Without Systemic Transformation
Existing projects progress unevenly. Administrative complexity and investment delays persist. Shore-power infrastructure advances at selected gateways, while industrial-scale hydrogen investment remains commercially selective.
Confidence: HighThe Strategic Constraint
Europe’s port transition will be determined less by the volume of announced infrastructure expenditure than by the ability to convert long-duration capital into commercially productive, energy-secure and climate-resilient assets.
Italian regulatory certainty, Northern Europe’s industrial economics, Mediterranean inland connectivity and Danube navigability are distinct constraints. They require differentiated investment responses, not a single model of port reform.
Pillar I — Institutional Architecture, Investment and Competitive Geography
European Port Systems: Regulatory Constraints, Capital Mobilisation, Industrial Competition and the Future of Mediterranean Gateways
Assessment date: 31 October 2026 | Historical evidence: primarily 2024–2025 | Strategic assessment horizon: 2027–2035
Chapter 1. Italian Port Systems: Regulatory Constraints, Concessions and the Economics of Investment
The structural problem: infrastructure investment without equivalent contractual and commercial certainty
Principal judgement — High confidence. The central weakness of the Italian port investment environment is not an absolute shortage of public infrastructure expenditure, nor is it the mere existence of public ownership. It is the incomplete alignment between administrative authority, contractual duration, commercial responsibility and the financial characteristics of capital-intensive port assets. The distinction is essential because modern maritime infrastructure is increasingly developed through combinations of public works, private terminal investments, industrial facilities, electricity networks, logistics platforms and specialised financial vehicles. These components are economically interdependent but frequently governed by different legal instruments, investment timetables and decision-making authorities. A container terminal may become commercially viable only when railway access reaches sufficient capacity; a hydrogen production facility may depend on electricity supply, industrial customers and permissions outside the port authority’s direct competence; and a shore-power installation may be physically complete without generating sufficient revenues until vessels are appropriately equipped and electricity tariffs become commercially workable. Where these dependencies cannot be synchronised, investors face exposure to delays and costs that are only partially under their control. This produces an economically important distinction between the nominal duration of a concession and the period during which the investor can actually operate the completed asset at productive capacity.
The Italian framework established by Law No. 84 of 28 January 1994, subsequently amended, was designed to separate public port governance from commercial port operations and establish a coordinated institutional structure for national maritime infrastructure. The later reforms introduced the Autorità di Sistema Portuale, or AdSP, as public-law bodies responsible for functions including planning, coordination, regulation and supervision within their respective port systems. The framework does not imply that public authorities are prohibited from every form of investment activity or corporate participation. Rather, their powers and restrictions derive from specific statutory provisions, and the distinction between ordinary commercial operations and activities legally connected with public port functions is consequential. Articles 6, 16 and 18 are particularly relevant to the allocation of administrative responsibilities, port operations and the concession of maritime state property. An analytical treatment that simply describes Italian port authorities as incapable of participating in commercial development would therefore overstate the legal restriction. The more defensible conclusion is that commercial participation, direct operation, corporate investment and infrastructure development are subject to a more constrained and public-law-oriented framework than the activities of a conventional industrial corporation. Law No. 84 of 28 January 1994 — Italian Republic — Consolidated Legislative Text. Normattiva+1
The practical consequences become clearer when the legal framework is examined through the balance sheet of a private investor. A terminal operator considering substantial expenditure must estimate the future volume of cargo, tariffs, labour expenses, energy costs, equipment replacement, maintenance and financing obligations. It must also estimate when the infrastructure will become operational and whether the concession provides sufficient protection against changes in the conditions on which the original investment decision was made. A concession lasting several decades may appear consistent with the useful life of quay infrastructure, automated handling equipment and storage installations. Yet this nominal consistency can become economically misleading if permission delays, variations to the concession perimeter, uncertain access to public infrastructure or interruptions in complementary works substantially shorten the effective revenue-generating period. The investor’s problem is consequently not limited to whether a concession can legally be granted for a long duration. It concerns whether the combined contractual and administrative arrangements provide sufficient certainty for the investment to be financed on the basis of expected future cash flows.
Port authority status and the division of commercial responsibility
A public port authority and a commercially autonomous port corporation can perform similar physical development functions while operating under substantially different financial incentives. The first is accountable for the exercise of public powers and the management of infrastructure within a statutory framework. The second may be organised to generate operating income, retain profits, borrow, establish subsidiaries, enter commercial partnerships and manage a portfolio of long-term contracts, subject to the legislation and shareholder obligations applicable to it. Neither form is inherently superior. Public-law governance can protect strategic access, prevent excessive market concentration and safeguard environmental and territorial interests. Corporate governance can facilitate integrated project development and commercially disciplined capital allocation. The decisive question is whether the institutional arrangement allows risks to be identified and assigned to parties possessing the authority, financial capacity and technical competence to manage them.
The European legal framework does not impose a single ownership structure on member-state ports. Regulation (EU) 2017/352 establishes common principles governing selected port services, financial transparency and infrastructure charges while recognising the role of national institutional arrangements. Its provisions on financial relationships, accounting transparency and charging rules are particularly relevant because they establish that the commercial management of port infrastructure must coexist with competition safeguards and accountability for public financing. Accordingly, any proposal to expand the investment or commercial powers of Italian port institutions must account for procurement, concession procedures, public financing and competition requirements. The policy choice is not between unrestricted commercial freedom and complete public management. It is between institutional arrangements that clearly distinguish public responsibilities from investment functions and arrangements in which that distinction remains operationally ambiguous. Regulation (EU) 2017/352 — European Parliament and Council — February 2017. EUR-Lex+1
An important analytical consequence follows. Italian port authorities can contribute to a favourable investment environment through transparent planning, properly structured concession awards, infrastructure maintenance and coordination of public works without directly becoming the owners or operators of every associated commercial project. Conversely, expanding their formal investment powers would not necessarily increase private investment if the resulting structures lacked credible revenues, appropriate debt capacity or enforceable contractual arrangements. In commercial terms, investors require clarity about who controls the land, who finances the quay, who pays for the railway connection, who bears construction delays, who owns the energy facility and who ultimately purchases the services it produces. A governance model that answers these questions in legally durable contracts is more important than the institutional label attached to the entity administering them.
Concession duration, investment amortisation and the cost of regulatory uncertainty
The interaction between concession duration and investment recovery deserves particular attention because it is one of the mechanisms through which regulatory risk can influence both investment volumes and the quality of infrastructure development. A concession is not equivalent to a permanent property right. Its economic value depends on the scope of the rights granted, the conditions of use, obligations to invest, applicable tariffs, termination provisions, transferability, and the treatment of assets when the concession expires. Port infrastructure frequently requires large initial capital expenditure and generates returns over extended periods. Structures such as quay walls and dredged access channels may have useful lives extending well beyond those of cranes, digital systems and handling equipment. The concession must therefore reconcile heterogeneous asset lives, replacement requirements and the evolving demands of shipping companies.
For analytical illustration, consider a hypothetical terminal investment of €200 million, financed without leverage and generating €15 million of annual net operating cash flow before financing and tax effects. These figures are illustrative assumptions, not reported data from any Italian port. Ignoring the time value of money, the simple capital recovery period is approximately 13.3 years. If cash flow were delayed for four years by construction and administrative problems, the period required for recovery would extend materially. Once an appropriate discount rate, maintenance expenditure, equipment renewal and concession termination risks are introduced, the sensitivity becomes greater. At an illustrative discount rate of 8%, the present value of 20 annual payments of €15 million is approximately €147.3 million, below the original investment. Forty annual payments would have a present value of approximately €179.4 million, still below €200 million. This simplified calculation omits residual value and many contractual details, but it shows why the apparent generosity of a concession term cannot be assessed independently of cash-flow timing, risk and capital cost.
| Illustrative investment variable | Assumption | Financial implication |
|---|---|---|
| Initial terminal investment | €200 million | Capital exposed before operational returns |
| Annual net cash inflow | €15 million | Assumed constant, before financing and taxes |
| Simple payback | 13.3 years | Ignores discounting |
| Discount rate | 8% | Illustrative required return, not an Italian benchmark |
| Present value of 20 years of cash inflows | €147.3 million | Below assumed initial investment |
| Present value of 40 years of cash inflows | €179.4 million | Longer duration alone does not ensure viability |
| Additional construction or permission delay | 4 years | Defers revenues and reduces present value |
The calculation is deliberately simplified to isolate the financial mechanism. A real concession valuation would require a comprehensive operating model incorporating taxes, working capital, debt repayments, maintenance capital expenditure, concession payments, renewal obligations, traffic scenarios, residual values and termination compensation. Nevertheless, the economic conclusion is robust: a contractual right extending over several decades may still be insufficient to finance infrastructure when revenue uncertainty, delays or the cost of capital are excessive. This is precisely why policy discussions should focus on concession quality rather than automatically equating longer concessions with greater investment attractiveness. Extensions must remain compatible with competition and concession-law requirements, and any compensation arrangements must be designed without guaranteeing private returns irrespective of performance.
Porti d’Italia S.p.A.: the difference between a legislative reform and an investment institution
The proposed Porti d’Italia S.p.A. reform is best understood as an attempt to address fragmentation in the planning and execution of strategic port investment. According to the Italian Ministry of Infrastructure and Transport, the legislative proposal provides for the creation of an entirely publicly owned company tasked with programming and implementing strategic works. On 23 September 2026, the Ministry reported that voting on amendments had begun in the Chamber of Deputies’ Transport Committee, following hearings and parliamentary examination, and that 622 amendments had been presented by the August deadline. This is evidence of an active legislative process, not evidence that the proposed company had already achieved operational maturity or acquired the institutional and financial characteristics required to function as an established investment platform. The correct policy assessment must distinguish the objectives stated by the government from the legal powers that are ultimately enacted and from the commercial results that subsequently become observable. Port Governance Reform: Parliamentary Amendment Examination — Italian Ministry of Infrastructure and Transport — September 2026. Ministero delle infrastrutture e dei trasporti
A centralised investment company could have several operational advantages. It could aggregate a portfolio of strategic infrastructure projects, establish common project-evaluation standards, reduce differences in procurement practices, coordinate investments exceeding the territorial scope of individual port systems and provide a more consistent interface with national public financing institutions. Where several ports depend on the same rail corridor or on common electricity and energy networks, a national coordinating function could improve sequencing and avoid investments that become operational at different times. It could also establish a clearer hierarchy between commercially justified projects, strategic infrastructure requiring public support and projects whose expected benefits are primarily territorial or environmental. These potential benefits are important because some of the most consequential transport investments cannot be attributed to the commercial balance sheet of a single terminal or port authority.
The countervailing risk is that centralisation changes administrative hierarchy without improving the contractual conditions of investment. If the new national company controls financial programming but individual port authorities remain responsible for concessions and parts of implementation, investors may need to interact with an additional public institution. If disputes arise over project selection, capital allocation, concession rights or the distribution of responsibilities, procedural uncertainty could increase. If the company relies overwhelmingly on annual public appropriations rather than predictable financing arrangements, centralisation would not necessarily improve its capacity to support long-lived assets. Moreover, if project governance becomes increasingly dependent on ministerial intervention, the institutional reform could reduce the flexibility required to respond to commercial opportunities. These risks are conditional assessments rather than established outcomes of the proposed reform; their importance will depend on the final statutory text, implementing instruments, financial structure and decision-making practice.
| Reform dimension | Potential improvement | Principal risk | Evidence required to establish success |
|---|---|---|---|
| National investment programming | Better coordination between port systems | Central priorities may displace commercially justified local projects | Published investment criteria and executed project portfolio |
| Strategic infrastructure delivery | Common procurement and project management | Additional approval layer | Measured permit-to-construction and construction-to-operation times |
| Public financing | Greater visibility over long-term capital commitments | Dependence on changing budget allocations | Multiannual binding financing arrangements |
| Private capital mobilisation | Coordinated public-private project structures | Unclear allocation of commercial and public powers | Signed financing contracts and private equity contributions |
| Concession administration | Potentially more consistent national guidance | Conflicting national and territorial responsibilities | Operative concession rules and documented implementation |
| Financial accountability | Consolidated project monitoring | Reduced transparency of individual project economics | Audited project-level expenditure, liabilities and asset utilisation |
| Industrial coordination | Stronger infrastructure–energy integration | Excessive administrative centralisation | Commissioned projects supported by industrial customers |
The issue is not whether a new national company can formally own or implement infrastructure. It is whether its governance permits a legally clear and financially workable distribution of obligations across public authorities, contractors, investors and users. The effectiveness of the reform should therefore be evaluated against project-level evidence rather than through changes in organisational charts or the number of institutions formally participating in the programme.
ZES Unica: the economic value and limitations of fiscal incentives
The Zona Economica Speciale Unica represents a materially different policy instrument because it attempts to influence private investment through tax incentives and administrative simplification. Introduced in 2024 and subsequently expanded, the framework is governed by Decree-Law No. 124 of 19 September 2023, converted into Law No. 162 of 13 November 2023, and subsequent amendments. The 2026 Budget Law extended the investment tax-credit framework through 2028. The official ZES administration identifies the territories and investment categories covered by the scheme and publishes the applicable rates according to location, enterprise size and project scale. This legal and administrative detail matters because references to the ZES as a general incentive for port industrialisation can conceal important sector exclusions, territorial qualifications and financial limitations. ZES Unica Investment Tax Credit — Italian Government, Department for Southern Policies — 2026; Article 16, Decree-Law No. 124/2023 — Italian Ministry of Economy and Finance — Consolidated Provisions. Dipartimento per il Sud+2
For 2026, official rules required an initial communication of eligible expenditure between 31 March and 30 May, followed by a supplementary communication between 3 and 17 January 2027 to confirm investments actually made. Eligible projects generally involve initial productive investment in machinery, equipment, industrial land and instrumental buildings, subject to the detailed criteria of the legislation. The official guidance identifies a minimum project expenditure of €200,000 and a maximum eligible cost of €100 million per project, with land and buildings subject to a specific proportional limitation. Rates vary significantly according to the assisted territory, the size of the enterprise and the project category. The institutional significance of these provisions lies not only in the level of the nominal incentive but also in the ability of investors to determine eligibility and value before committing capital. A tax benefit that is not available to the relevant sector, cannot be accessed during the investment period or is subject to funding constraints should not be treated as assured project revenue.
Selected 2026 ZES Unica rates from official guidance. Rates are ceilings subject to the relevant aid rules and project conditions; they are not guaranteed realised tax credits.
| Territory | Small enterprise, qualifying projects up to €50m | Medium enterprise, qualifying projects up to €50m | Large enterprise | Investment relevance |
|---|---|---|---|---|
| Campania | 60% | 50% | 40% | Industrial and logistics investment in qualifying areas |
| Puglia | 60% | 50% | 40% | Adriatic and Ionian industrial hinterlands |
| Calabria | 60% | 50% | 40% | Potential qualifying activities around logistics and manufacturing |
| Sicilia | 60% | 50% | 40% | Industrial processing and eligible port-adjacent activities |
| Basilicata | 50% | 40% | 30% | Inland industrial and logistics integration |
| Sardegna | 50% | 40% | 30% | Eligible industrial and productive investment |
| Molise | 50% | 40% | 30% | Industrial investment in assisted territory |
| Abruzzo, Marche and Umbria, specified areas | 35% | 25% | 15% | Selective eligible industrial investment |
These figures reproduce the selected general territorial categories in the government’s 2026 guidance, not special territorial rates or the separate treatment of larger projects. In certain qualifying areas of Puglia and Sardinia, differentiated rates apply. The formal rate is also not equivalent to the final benefit received, because the statutory funding envelope, approval procedures and enterprise-specific conditions remain relevant. Official Investment Tax-Credit Eligibility and Regional Rate Table — Italian Department for Southern Policies — 2026. Dipartimento per il Sud
A particularly consequential restriction concerns the exclusions explicitly identified by the government’s guidance. The scheme does not apply indiscriminately to all transport or energy enterprises. Transport activities are generally excluded, with identified exceptions for warehousing, transport-support activities and related infrastructure, while energy production, storage, transmission and distribution, together with energy infrastructure, fall within listed exclusions. The interpretation of a specific project therefore requires careful assessment of its activity classification and the applicable rules. A port-adjacent warehousing facility may be materially different from an electricity-generation project or a transport operation. An investor developing an integrated industrial-energy complex cannot assume that all expenditure qualifies merely because the assets are situated within the geographical perimeter of the ZES. This creates a potential mismatch between political descriptions of large integrated port-energy projects and the tax treatment of their separate components. ZES Unica — Beneficiaries, Sector Exclusions and Eligible Investments — Italian Government — 2026. Dipartimento per il Sud+1
The extension of incentives through 2028 provides more certainty than a scheme ending after a single fiscal year, but it remains short relative to the economic life of many port-industrial investments. This does not make the tax credit ineffective; investment credits are normally intended to improve the economics of initial capital expenditure rather than guarantee revenues for the entire operating life of an asset. The limitation becomes material when businesses regard fiscal incentives as a substitute for stable concession arrangements, predictable energy costs or long-term customer demand. An eligible project may benefit significantly from a tax credit while still being commercially unviable because of insufficient throughput, high operating costs or an incomplete transport connection. The appropriate policy assessment must therefore examine whether ZES-supported projects become operational, attract private financing, sustain employment and generate productive output, rather than measuring success only through approved expenditure or the nominal generosity of tax relief.
Industrial land: from territorial availability to investable assets
Industrial land within or adjacent to a port acquires economic value through a combination of physical suitability, legal availability, transport access, utilities and the ability to accommodate specific productive activities. The availability of hectares alone says little about whether land can support a modern industrial project. Potential investors must establish whether the relevant property rights permit the intended use, whether the land is environmentally suitable, whether remediation is required, whether electricity and water infrastructure have sufficient capacity and whether construction can begin within an economically acceptable period. Large industrial-energy projects introduce additional dependencies associated with hazardous-material controls, pipeline routing, storage installations, fire safety and connections to external electricity or gas infrastructure. Consequently, land-management reform can improve investment conditions only if it changes the effective time and cost required to convert allocated land into operating facilities.
The connection between industrial land and concession finance is particularly important. Where land is made available through a concession, the investor must consider what happens when the concession expires, how improvements are valued, whether assets can be transferred or financed and how changes in permitted industrial use affect future revenue. These questions are more complex for multi-energy projects than for conventional cargo storage because an industrial plant may depend on interconnected facilities located outside the relevant port perimeter. A port authority may be able to provide land and maritime access but may not control the national electricity network, the industrial buyer’s production strategy or the external rail corridor. Effective project development therefore requires contractual coordination that extends beyond the boundaries of the port authority itself. This is a material reason why the performance of a port’s industrial estate should be evaluated through the operational condition and commercial use of its sites rather than the percentage of land formally allocated to investment projects.
Italian investment: observed commercial activity versus the financing gap
The Italian port system should not be characterised as commercially marginal or uniformly stagnant. The national association Assoporti maintains consolidated annual traffic statistics and, together with SRM, has documented significant cargo volumes across container, Ro-Ro, liquid-bulk and dry-bulk segments. The May 2026 statistical release reported more than 510 million tonnes of goods handled by Italian ports in 2025 and almost 13 million TEU, with reported growth in container traffic. These figures demonstrate that the national system has a substantial operating base. They do not demonstrate that every port is equally competitive, that capital is allocated efficiently or that private investors possess an equivalent ability to finance new projects throughout the country. Aggregate national traffic can increase while individual port systems face declining industrial activity, incomplete rail access or insufficient returns on new infrastructure. Italian Port Traffic Statistics 2025 — Assoporti — June 2026. L’Italia dei porti+1
The internal diversity of Italian ports also creates different commercial requirements. Genoa and the wider Ligurian system connect maritime cargo activity with northern Italian and transalpine industrial markets; Trieste has a different geographic relationship with Central European freight corridors and railway transport; Gioia Tauro operates within a container transshipment market that is highly dependent on shipping-network decisions; and ports serving established industrial and energy installations have investment requirements linked to commodity demand, refinery activity and the evolution of industrial production. A common legal framework therefore covers assets with markedly different commercial risk profiles. Treating all port investment as a uniform public infrastructure requirement would conceal these differences. National authorities should be able to distinguish between projects whose returns can be captured by an identifiable operator, projects generating wider transport benefits, and strategic public works that may not be commercially financeable but remain justified by public policy objectives.
The 2025 cargo results reinforce the need for differentiated investment evaluation. A maritime terminal with growing container traffic may still suffer from high inland transport costs, while a bulk-handling facility can experience declining utilisation as industrial production changes. Public investment that expands available terminal space without addressing these demand conditions may produce apparent capacity gains rather than higher economic output. Conversely, an intervention that improves the reliability of a critical rail connection could generate substantial productivity benefits even without increasing quay length or terminal land. The economically relevant indicator is the additional commercial service capacity created per euro of total investment, adjusted for utilisation, operating reliability and asset lifetime, rather than simply the size or visibility of the infrastructure project.
Key judgements — Chapter 1
The evidence supports a high-confidence conclusion that Italian port governance requires clearer alignment between public functions, contractual investment rights and commercially accountable implementation. It supports a medium-confidence judgement that an appropriately designed national investment company could improve coordination, but not a claim that the proposed Porti d’Italia S.p.A. reform has already demonstrated such an effect. The ZES Unica provides substantial statutory incentives for eligible productive investment, yet its sector exclusions and the distinction between tax relief and operating revenue limit its relevance to integrated port-energy development. The principal evidence still needed for a definitive investment assessment consists of the final operative reform text, harmonised project-level financial commitments, actual concession terms, implementation delays and audited private-capital mobilisation. Without these records, broad estimates of a national regulatory-risk premium or precise claims about private investment lost to administrative uncertainty would be unsupported.
What would change the assessment: Evidence that binding multiannual investment arrangements, executable concession contracts and coordinated infrastructure authorisations have materially reduced implementation times and increased privately financed project completions would strengthen the positive assessment of Italian reform. Conversely, continued delays despite revised institutional structures would indicate that the principal constraints remain embedded in project execution and commercial risk allocation.
Open official record: The final enacted port-governance legislation and implementing regulations; concession-level investment obligations and termination provisions; audited financing commitments; port-specific project delivery schedules; and operational outcomes of ZES-supported investments.
Chapter 2. Northern European Ports: Governance, Capital Mobilisation and Industrial Competitiveness
Commercial autonomy is an investment mechanism, not a guarantee of competitiveness
Principal judgement — High confidence. The principal institutional advantage of the Northern European port systems is the combination of established industrial demand, commercially accountable port organisations, long-term contractual relationships and the financial capacity to develop infrastructure across interconnected markets. Their advantage should not, however, be interpreted as proof that corporatisation or commercial autonomy independently creates superior economic outcomes. Rotterdam, Antwerp-Bruges, Hamburg and Amsterdam have developed within different legal, geographic and industrial environments, and their institutional models vary substantially. What distinguishes the most developed Northern European clusters is their ability to combine several revenue-producing activities within the same economic geography: containerised freight, liquid and solid bulk, industrial processing, energy storage, distribution networks, railway services, inland navigation and logistics real estate. This diversity strengthens investment opportunities because infrastructure can support more than one commercial function, but it also increases exposure to structural changes in European manufacturing, energy demand, international trade and environmental regulation.
The institutional comparison must begin by distinguishing the port authority from the port-industrial complex. A port authority’s turnover and investment expenditure do not represent the combined revenues and capital expenditure of all terminal operators, industrial companies, utility providers and logistics businesses located within its territory. This distinction is indispensable when assessing the ability of Northern European ports to attract private capital. The reported investment of a public port corporation is a measure of expenditure undertaken by that particular entity; it is not the total value of private industrial investment in the port. Conversely, an announced private investment located within the port should not automatically be attributed to the financial capacity of the port authority, particularly when the project is being financed by an industrial undertaking with an independent balance sheet, customer base and investment strategy.
Rotterdam: the financial architecture of a commercially autonomous public port company
The Port of Rotterdam Authority provides one of the clearest institutional examples of the distinction between public ownership and commercial financial management. The authority operates as a public corporation whose shareholders include the Municipality of Rotterdam and the Dutch State. Its financial model relies on commercial relationships with port users, including contractual revenues associated with land and other rights, alongside port dues and associated activities. The company’s investment capacity is therefore linked to its financial performance, cash generation, debt capacity and shareholder arrangements. This does not eliminate public influence, but it provides a framework in which infrastructure development can be assessed through financial statements, commercial commitments and the investment requirements of the port-industrial cluster.
The authority’s 2025 financial figures are particularly informative because they permit an assessment beyond cargo volume alone. Revenues increased by 6.6% to €940.4 million, while earnings before interest, taxes, depreciation and amortisation reached €583.6 million, an increase of 3.6%. Net profit was €266.0 million, down by €7.8 million, while the authority invested €291.4 million, approximately 9% less than in 2024. The authority attributed changes in expenses to labour costs, supplier-price adjustments and accounting treatment, and it reported higher depreciation and a one-off impairment affecting the net result. The disclosed dividend amounted to €186.2 million, representing approximately 70% of net profit, with the distribution arrangement linked to the company’s investment plans and financial position. These figures reveal a functioning commercial balance sheet but also demonstrate that public shareholders influence the allocation of financial resources between reinvestment and distributions. Port of Rotterdam: 2025 Financial and Operational Results — Port of Rotterdam Authority — February 2026. Port of Rotterdam+1
| Rotterdam Port Authority indicator | 2025 reported result | Financial interpretation |
|---|---|---|
| Revenue | €940.4m | Income generated by the port authority’s activities |
| Revenue growth | +6.6% | Reported year-on-year increase |
| EBITDA | €583.6m | Operating earnings before depreciation, financing and taxation |
| EBITDA growth | +3.6% | Positive operating earnings development |
| Net profit | €266.0m | Accounting profit after expenses and other recognised effects |
| Capital investment | €291.4m | Expenditure by the port authority, not total cluster investment |
| Change in investment | −9% | Decline relative to previous year |
| Dividend | €186.2m | Distribution to public shareholders |
| Dividend as share of net profit | Approximately 70% | Shareholder distribution arrangement |
| Maritime throughput | 428.4 Mt | Physical cargo handled within the port system |
| Container volume | 14.2m TEU | Container throughput; distinct from tonnage |
The authority’s reported EBITDA is equivalent to approximately 62.1% of revenue, while capital investment represents approximately 31.0% of revenue. These are derived descriptive ratios, not standardised measures of financing capacity. EBITDA is not free cash flow, because it excludes capital requirements, financing obligations and other items. Similarly, the ratio between investment and revenue cannot be compared mechanically with the corresponding ratios of statutory port authorities operating under different financial and accounting systems. Nevertheless, the figures establish the scale of resources being managed within Rotterdam’s corporate structure. They also show that a public port corporation can combine recurrent commercial income with substantial infrastructure investment without requiring all investment decisions to be treated as isolated annual expenditure programmes.
The more important question is whether this corporate capacity is sufficient to sustain the transition of the surrounding industrial economy. Rotterdam’s 2025 results suggest that the answer is conditional. The port reported that several chemical companies had announced closures and that investments in both new and ongoing industrial projects had been halted, particularly in renewable fuels. Dry-bulk throughput declined by 6.5%, with iron ore and scrap falling by 11.5%, while coal throughput declined by 8.7% to 17.3 million tonnes. The authority linked these developments in part to weak European steel competitiveness, high energy and carbon costs, and international competitive pressure. Thus, the same port that possesses substantial financial and institutional capacity faces declining demand in parts of its established industrial base. The significance is not merely cyclical: a port authority can finance or facilitate common infrastructure, but it cannot independently guarantee that an energy-intensive producer will remain commercially competitive or that a low-carbon fuel project will secure customers at economically viable prices. 2025 Throughput, Industrial Activity and Financial Results — Port of Rotterdam Authority — February 2026. Port of Rotterdam+1
Rotterdam’s energy projects: infrastructure integration and the limits of announced capacity
Rotterdam’s energy transition is especially useful as a benchmark because the projects under development involve more than isolated demonstrations. The port has been developing industrial hydrogen infrastructure, electricity-related facilities and carbon-management systems within an established energy and petrochemical cluster. Its February 2026 reporting identified a 200 MW hydrogen-production project by Air Liquide, then under construction and scheduled for operation by the end of 2027. It also referred to Shell’s Holland Hydrogen I project and the development of a hydrogen network, including a 32-kilometre pipeline whose construction was progressing. The strategic importance of these projects lies in their integration with existing industrial land, industrial users, pipeline corridors and energy infrastructure. This provides a more substantial economic foundation than projects justified only by the intention to create future demand.
Yet the reported project timetable must be interpreted as a dated institutional expectation, not as a guarantee of delivery. The same February disclosure anticipated Porthos becoming operational by the end of 2026, while subsequent 2026 reporting indicated that operations were not expected before the second half of 2027. That change illustrates why a port-energy project should be described through a sequence of documented milestones rather than classified as operational merely because construction is advanced or commercial partners have been identified. The existence of a pipeline, an industrial agreement or a scheduled commissioning date does not establish actual carbon injection or hydrogen deliveries. For investment analysis, the differences between construction completion, regulatory acceptance, initial commissioning, full utilisation and contracted revenues remain essential. Port of Rotterdam Energy and Infrastructure Developments — Port of Rotterdam Authority — February 2026; Porthos Project — Port of Rotterdam Authority.
Rotterdam’s value as a benchmark is consequently institutional and operational rather than ideological. It demonstrates how a port authority can participate in the creation of common infrastructure and collaborate with industrial companies possessing their own balance sheets. It also demonstrates that substantial financial resources, advanced project development and formal energy-transition strategies cannot eliminate commercial uncertainty. The experience has direct implications for Italy: creating an investment vehicle or granting port authorities broader commercial powers would not automatically produce hydrogen demand, cheaper electricity, sufficient grid capacity or bankable industrial contracts. Those conditions depend on markets and infrastructures extending well beyond the governance perimeter of a single port.
Antwerp-Bruges: industrial concentration, operational scale and exposure to commercial disruption
The Port of Antwerp-Bruges represents a different form of integrated port-industrial development, combining extensive maritime and logistics activities with major chemical, industrial and energy functions. Its governance is based on a publicly owned port company with commercial responsibilities and a structure designed to coordinate port development and infrastructure management. The economic advantage arises from the concentration of industrial users and logistics services, which can create demand for storage, pipelines, terminals and shared infrastructure. In such an environment, a project may benefit from several potential industrial customers, established contractors and proximity to existing transport and utility networks. However, this concentration can also increase sensitivity to industrial downturns and disruptions affecting the wider cluster.
The port’s 2025 results offer an important corrective to simplified narratives of Northern European superiority. Maritime throughput fell by 4.1% to 266.5 million tonnes, although container volumes increased slightly, by 0.7% in TEU. The port reported congestion and operational disruption associated with changes in shipping alliances and vessel schedules. Industrial action accounted for approximately 25 days of disruption during the year, with an estimated loss of 2.4 million tonnes, equivalent to roughly 1% of annual throughput. The port also reported that its share of the Hamburg–Le Havre container range declined by 1.2 percentage points to 29.3% during the first nine months of the year. The market-share figure refers to that reporting period and should not be presented as a full-year measure. These results show that even a commercially sophisticated port system can experience a simultaneous combination of industrial weakness, operational congestion and market-share pressure. Port of Antwerp-Bruges: 2025 Maritime Traffic and Operating Conditions — Port of Antwerp-Bruges — January 2026. newsroom.portofantwerpbruges.com
The underlying economic implication is that infrastructure competitiveness cannot be measured by berth availability or terminal capacity alone. A port’s effective performance depends on the interaction between maritime arrival schedules, labour availability, terminal operations, customs procedures, landside distribution and the reliability of inland transport. A major terminal may possess substantial nominal capacity while congestion reduces the number of containers that can be handled within commercially acceptable times. The value of additional capacity therefore depends partly on whether the surrounding system can absorb it. Expansion of quay infrastructure without equivalent attention to railway operations, road access, yard management and digital coordination can create new bottlenecks rather than eliminate existing ones. This lesson is particularly important for Mediterranean ports attempting to compete for Northern European industrial hinterland traffic, because a shorter maritime route provides little benefit when port or inland delays absorb the potential time saving.
Hamburg: the strategic importance of railway integration and specialised terminal economics
Hamburg differs from Rotterdam and Antwerp-Bruges in its institutional arrangements, geographic characteristics and terminal structure. The Hamburg Port Authority operates within a public governance framework, while commercial terminal companies undertake essential cargo-handling functions. This division requires coordination between infrastructure management and commercial terminal investment, and it places particular importance on inland connectivity. Hamburg’s location and its integration into German and Central European industrial and transport networks make railway capacity a major component of its competitive position. A comparison with Mediterranean ports must therefore account not only for maritime distances but also for the density, frequency and operational reliability of rail services connecting the port to inland distribution and production centres.
Official 2025 data show that Hamburg handled 114.6 million tonnes, up 2.6% from 2024, while container throughput increased by 7.3% to 8.3 million TEU. Approximately 81 million tonnes were carried in containers, representing nearly 71% of total cargo tonnage. Loaded containers accounted for approximately 7.0 million TEU, more than 84% of total container throughput. These figures establish Hamburg’s strong container specialisation, distinguishing it from ports where liquid-bulk and industrial-energy cargo account for a substantially larger proportion of total tonnage. The difference matters because investments in terminal automation, railway access and container handling generate economic effects that cannot be directly compared with investments serving crude oil, chemicals or dry bulk. Hamburg Port Traffic Results 2025 — Hamburg Port Authority — February 2026; Container Throughput and Cargo Composition — Port of Hamburg — 2025. hamburg-port-authority.de+1
Hamburg’s experience also illustrates the need to distinguish commercial integration from institutional concentration. The port is not dependent on a single company carrying out all infrastructure and terminal functions. Different public and commercial organisations participate in port development, while the productive value of their investments depends on maintaining efficient relationships across the wider transport system. The policy lesson is therefore not that every port should adopt one integrated corporate structure. It is that a fragmented institutional environment must nevertheless function as an operationally integrated infrastructure system. A Mediterranean port that possesses competitive handling facilities but cannot provide reliable rail access to major inland markets may remain less attractive to a shipper than a more distant Northern European port operating within a dense and established transport network.
Amsterdam and the diversification of the Northern European port model
Amsterdam should not be treated merely as a smaller version of Rotterdam. Its position within the North Sea Canal area and its connections with the wider Dutch transport and industrial economy create a different commercial profile. The port’s strategic role includes industrial and energy-related activities alongside maritime logistics, and its future exposure depends partly on the transformation of conventional fuel and industrial cargo markets. This differentiates its investment priorities from those of a port dominated by international container transshipment or general cargo handling. The relevant analytical issue is how existing infrastructure, industrial land and maritime access can be converted into productive new uses without assuming that emerging energy markets will necessarily replace established commodity flows in equivalent volumes or at equivalent margins.
In energy-transition planning, this distinction is important because the substitution of one commodity by another rarely preserves the same infrastructure requirements, storage characteristics or commercial arrangements. Traditional liquid-bulk handling may involve established tanks, pipelines and customers, whereas hydrogen-derived fuels or other emerging energy carriers may require different safety systems, specialised equipment, new contractual relationships and altered permitting conditions. The presence of industrial land and energy infrastructure offers an advantage, but investment decisions remain dependent on the characteristics of individual products and customers. Amsterdam therefore contributes to the wider Northern European benchmark as an example of how industrial transition must be evaluated at the level of asset conversion and future commercial demand rather than through aggregate port traffic statistics alone. No unsupported 2025 financial or throughput figure is assigned here in the absence of a verified comparable record.
Corporate balance sheets and the limits of international financial comparison
A robust financial comparison between port authorities requires more than the juxtaposition of reported revenues. The institutions differ in legal form, the activities included within their accounts, ownership of commercial assets, treatment of government grants, infrastructure obligations and the extent to which public works are funded outside the port authority’s own balance sheet. An authority collecting port dues and land rents cannot be compared directly with an entity whose reported income includes additional commercial operations without adjusting for those differences. EBITDA, net profit and capital expenditure likewise acquire different meanings when entities operate under distinct accounting and financing arrangements. A port with lower accounting profitability may be responsible for a greater amount of publicly useful infrastructure, while a company with stronger operating earnings may benefit from commercially attractive assets that were developed through historical public investment.
This problem is particularly relevant when using Rotterdam as evidence that the Italian port system should adopt an equivalent financial model. Rotterdam’s 2025 EBITDA and investment expenditure demonstrate substantial financial capacity, but they do not establish how much additional investment an Italian port authority could generate through corporatisation. Such an estimate would require a comparable assessment of concession revenues, port charges, cash balances, debt capacity, public infrastructure responsibilities, historical asset values and future capital commitments. The calculation would also need to account for national differences in taxation, accounting treatment and the fiscal relationship between the port institution and government. Without this reconciliation, financial ratios risk appearing objective while concealing major institutional differences.
| Financial comparison variable | Rotterdam | Antwerp-Bruges | Hamburg | Appropriate interpretation |
|---|---|---|---|---|
| Principal governance | Public corporation | Public port company | Public infrastructure authority and commercial operators | Different legal and operational perimeters |
| Commercial income | Reported authority revenues and contractual income | Port-company revenues and associated activities | Infrastructure and commercial revenues across different entities | Requires reconciliation of scope |
| Public ownership | Yes | Yes | Strong public institutional role | Public ownership does not preclude commercial activity |
| Debt-financing potential | Linked to corporate financial structure | Linked to port company and project structures | Depends on institutional and project arrangements | Cannot be inferred from throughput |
| Private industrial investment | Distinct from port-authority expenditure | Distinct from port-company expenditure | Distinct from authority and terminal-company investment | Avoid double counting |
| Energy infrastructure | Integrated industrial and project development | Industrial-cluster project development | Port-specific infrastructure and industrial participation | Project-stage evidence essential |
| Principal observed constraint | Industrial competitiveness and delayed investment | Congestion, industrial conditions and operational disruption | Connectivity and terminal-system performance | Different mechanisms dominate |
The comparison therefore supports an institutional conclusion rather than an automatic financial ranking. Commercially autonomous public companies can provide a useful framework for long-term investment, particularly when supported by recurrent contractual income and strong industrial clusters. However, such structures still depend on shareholder policy, financing conditions and the viability of underlying businesses. They are not independent of government, immune to competition or necessarily better suited to every infrastructure function.
The United Kingdom: a distinct benchmark for port ownership and governance
The United Kingdom provides an instructive comparator because its port system includes privately owned ports, trust ports and ports operating under other statutory or local-authority structures. This diversity challenges the assumption that European port competitiveness depends on a single model of ownership. The UK Department for Transport describes trust ports as independent statutory bodies governed by their own legislation and controlled by local independent boards. They have no shareholders, and surpluses are reinvested for the benefit of port stakeholders. The official government description identifies more than 100 trust ports in the United Kingdom, although the wider port industry also includes substantial private investment and different ownership arrangements. Trust Ports: Institutional Structure — UK Department for Transport; Ports Good Governance Guidance — UK Department for Transport — March 2018. GOV.UK+1
The existence of different British governance arrangements indicates that ownership form and access to capital must be examined separately. A private port operator may possess substantial discretion over its assets and investment strategy but remain constrained by financing costs, planning procedures and uncertain demand. A trust port may be commercially managed without shareholders and may reinvest its surpluses in infrastructure while facing limits associated with its financial scale and statutory obligations. A publicly influenced port entity may possess secure revenue arrangements but face restrictions on borrowing or investment execution. The British experience therefore supports a broader institutional principle: the effectiveness of port governance depends on the clarity of powers, commercial accountability, financial discipline and the ability to plan investments over their economic lifetime.
For continental European governments, the British comparison also highlights the importance of distinguishing strategic regulation from direct operating responsibility. The state can establish rules governing safety, competition, environmental performance and infrastructure access while allowing different organisations to finance and manage commercial assets. Such an approach does not eliminate the need for public intervention where infrastructure produces substantial benefits that cannot be fully captured through private revenues. It does, however, make the economic justification for that intervention more explicit. The state remains responsible for determining when public finance is warranted, while commercial operators must demonstrate that their own investments can generate adequate returns under the applicable contractual and market conditions.
Northern Europe’s industrial competitiveness crisis and the limits of capital mobilisation
The 2025 evidence from Rotterdam and Antwerp-Bruges reveals a central contradiction in European port policy. Governments and port authorities are attempting to accelerate industrial decarbonisation at the same time that established energy-intensive industries face difficult operating conditions. This means that the expected demand for shared low-carbon infrastructure cannot be treated as independent of the competitiveness of the industries it is intended to serve. An industrial hydrogen network is commercially stronger when factories have both the technical ability and the financial incentive to purchase hydrogen at contracted prices. Carbon-management infrastructure is more viable when emitters remain operational and face sufficiently predictable regulatory and commercial conditions to enter long-term arrangements. Electrification investments depend on reliable grid access and on a cost differential that makes the relevant technologies economically attractive over their operating lives.
This produces several possible forms of investment failure. A project may fail before construction because its expected revenues are insufficient to secure finance. It may reach construction but encounter escalating costs or delayed regulatory approval. It may be commissioned yet operate below expected capacity because customers postpone their own investment decisions. It may also function technically while remaining dependent on subsidies or other financial support that are not assured over its anticipated lifetime. These outcomes differ economically and should not be combined under a single measure of project progress. The availability of public funding, even when substantial, cannot substitute for evidence that an industrial service will be used and that its operating costs can be recovered.
The Northern European benchmark consequently offers a more demanding lesson than simply adopting corporatised governance. It shows that sophisticated ports can mobilise investment because they operate within large commercial ecosystems, but their future performance is conditional on the competitiveness of those ecosystems. Italy and other Mediterranean countries may learn from the separation of commercial and public responsibilities, the management of industrial land, the use of dedicated project entities and the coordination of infrastructure investment. They cannot reproduce the historical concentration of industrial demand through a governance decree alone.
Key judgements — Chapter 2
High confidence: Rotterdam’s financial statements establish the capacity of a commercially managed public port corporation to generate substantial operating revenues and undertake infrastructure expenditure. Antwerp-Bruges and Hamburg demonstrate the importance of industrial concentration and established hinterland access. The reported cargo and financial data also establish that these advantages coexist with material commercial risks.
Medium confidence: Dedicated project structures and commercially accountable infrastructure management offer lessons for Italian and Mediterranean ports, but their effectiveness is conditional on the availability of industrial customers, appropriately structured contracts and the economic viability of individual projects.
What would change the assessment: Sustained recovery in Northern European industrial investment, completed low-carbon infrastructure projects operating at commercial scale and independently measurable private-capital mobilisation would strengthen the view that established Northern Range institutions can convert their current advantages into leadership in energy infrastructure. Continued industrial closures and delayed project financing would weaken that judgement.
Open official record: Harmonised financial comparisons between major port authorities; audited private investment in port-industrial clusters; long-term project financing arrangements; delivered versus announced energy capacity; and comparable hinterland transport service-performance indicators.
Chapter 3. Mediterranean Gateways: Hinterland Access, Industrial Demand and Competitive Positioning
The geography of Mediterranean trade does not automatically translate into control of European logistics
Principal judgement — High confidence. The economic competitiveness of Mediterranean ports is determined less by their proximity to major maritime routes than by their ability to convert that geographic position into reliable access to inland production, consumption and distribution markets. The distinction between a maritime gateway and a transshipment platform is central. A gateway port handles cargo whose commercial origin or destination is connected to its hinterland; a transshipment hub primarily facilitates the transfer of containers between maritime services. Both functions may produce substantial economic activity, but they generate different demands for infrastructure, different patterns of investment and different exposure to shipping-company decisions. A port that handles very large container volumes through transshipment does not necessarily possess equivalent influence over inland European freight flows. Conversely, a port with lower total container throughput can occupy an economically important position if it provides reliable and competitive access to high-value industrial markets.
The Mediterranean occupies a strategically significant position between Europe, North Africa, the Middle East and Asia, but this position has never eliminated the operational advantages of established Northern European logistics systems. Rotterdam, Antwerp-Bruges and Hamburg benefit from extensive industrial demand, established inland transport services and large concentrations of freight-related businesses. Mediterranean gateways must therefore compete through the combined maritime and inland transport chain rather than through the distance travelled by a vessel alone. The relevant economic comparison is the total landed cost, including the maritime freight rate, terminal charges, port dwell time, customs procedures, railway or road transport, inventory costs and the reliability of delivery. In this calculation, a shorter sea route can be outweighed by insufficient railway frequency, delays at an inland terminal or unreliable access to industrial customers.
The scale of this competition becomes clearer when the national and regional traffic data are considered alongside the different functional roles of individual ports. Assoporti’s consolidated 2025 statistics place Italian goods throughput above 510 million tonnes, while Valencia’s official figures show that a single Mediterranean port system handled more than 5.66 million TEU. Marseille-Fos handled substantial liquid-bulk cargo alongside containers and other commercial traffic, demonstrating a different industrial orientation. These indicators cannot be combined into a single ranking of competitive strength because tonnes, container units, industrial cargo and transshipment activity represent different economic functions. They nevertheless show that the Mediterranean is not a peripheral maritime market. Its central strategic problem is the conversion of significant existing maritime activity into stronger inland transport integration and higher-value industrial services. Italian Port Statistics — Assoporti — 2026; Valenciaport Annual Traffic Statistics — Port Authority of Valencia — 2025; Marseille-Fos 2025 Operating Results — Grand Port Maritime de Marseille — January 2026. L’Italia dei porti+2
Genoa and the Ligurian system: maritime infrastructure and the decisive role of inland access
The ports of Genoa, Savona and the wider Ligurian system occupy an important geographical position at the intersection of Mediterranean maritime transport and the industrial markets of northern Italy. Their strategic advantage arises from proximity to major productive regions and the potential to connect maritime freight with European railway corridors. The competitive relevance of Genoa therefore cannot be assessed through quay dimensions, container capacity or maritime accessibility in isolation. It depends on whether goods arriving at the port can be transferred efficiently to inland markets and whether the transport chain can offer sufficiently frequent, reliable and cost-effective services to compete with established Northern European routes.
This makes the relationship between maritime infrastructure and railway investment particularly consequential. Larger vessels, improved access channels and modernised terminal facilities can increase the capacity to receive cargo. However, these investments generate their full economic value only when the landside system can move the resulting traffic without creating bottlenecks. A port terminal may be technically capable of handling additional containers while rail connections, inland terminals or road access become saturated. The resulting delays increase inventory and transport costs, weakening the commercial benefit of the maritime investment. The correct infrastructure evaluation must therefore measure the effective capacity of the complete transport chain, not merely the design capacity of the maritime component.
Genoa’s infrastructure development also illustrates the difference between an important strategic project and its eventual commercial outcome. Major maritime works can create the physical conditions for a larger range of vessel calls and terminal operations. Yet changes in the competitive distribution of European freight depend on shipping-company services, terminal productivity, railway capacity and the willingness of inland customers to reorganise their logistics. A new maritime asset should accordingly be regarded as a necessary enabling investment where the existing infrastructure imposes a physical restriction, but not as direct evidence of increased future traffic. The additional capacity must be connected to a commercially credible distribution system before its economic value can be established.
The same reasoning applies to industrial land and logistics development around Ligurian ports. Space allocated to freight operations is valuable only when it supports economically viable handling, storage and distribution activities. Geographic restrictions and competing urban uses can intensify land pressures, making productivity per hectare and efficient integration with inland facilities particularly important. In this environment, better digital coordination and reliable inland services may offer significant advantages without requiring every commercial function to be concentrated within the immediate port perimeter. The economic challenge is to develop a network in which port terminals, rail services and inland logistics platforms operate as complementary components of one transport system.
Trieste: a gateway whose competitiveness depends on Central European integration
Trieste’s competitive position differs substantially from that of a predominantly transshipment-oriented Mediterranean port. Its location in the northern Adriatic creates opportunities to serve inland Central European markets, while established railway relationships give the port a distinct functional role. The strategic question is not simply whether Trieste is closer by sea to particular trade routes than Northern European alternatives. It is whether the total transport chain through the northern Adriatic offers an attractive combination of shipping frequency, railway reliability, cost and delivery time for specific cargo flows.
The port’s geographic relationship with Central Europe creates an opportunity but also introduces competitive dependencies. The relevant hinterland markets are not exclusive to one port; they may be served through multiple maritime gateways and transport corridors. Freight forwarders, shipping companies and industrial customers can adjust routing decisions when relative costs or reliability change. A port seeking to increase its share of these markets must therefore maintain commercially attractive services, not merely demonstrate that an alternative route is geographically shorter.
The most important infrastructure variable is the integration between maritime operations and inland railway services. Where scheduled rail connections provide reliable access to industrial markets, port users can reduce dependence on road transport and organise predictable distribution patterns. However, the availability of railway infrastructure does not by itself establish competitive service quality. Terminal handling times, train length, loading practices, cross-border operating arrangements and network capacity can all affect the viability of a service. In practical terms, the economic value of a rail-connected port depends on how consistently the complete service can operate.
Trieste also illustrates the need to distinguish industrial and energy functions from container logistics. A port with established liquid-bulk or energy-related operations may possess commercially valuable infrastructure that is not directly reflected in its container traffic. Such assets can support broader industrial activity, but their future value depends on changes in energy demand, refining activity, storage requirements and industrial production. The possibility of developing new energy-import functions should therefore be examined through the compatibility of existing facilities with emerging commodities and the availability of identifiable customers, rather than by assuming that traditional hydrocarbon infrastructure can be converted without substantial additional investment.
Gioia Tauro: scale in container redistribution and the exposure to shipping-network decisions
Gioia Tauro represents a different strategic position within the Italian and Mediterranean port system. Its competitive importance is associated principally with container transshipment and participation in international shipping networks. The underlying economic model differs from that of Genoa or Trieste because a substantial share of activity involves the transfer of containers between maritime services rather than the direct movement of cargo into the immediate regional hinterland. This configuration can support very high terminal productivity and significant container volumes, but it also creates dependence on decisions made by shipping companies and terminal operators concerning vessel deployment, network structures and the location of transshipment operations.
The economic implications are substantial. A transshipment terminal can increase throughput when a major carrier allocates additional maritime services to it, even if domestic industrial demand remains largely unchanged. Conversely, a change in shipping-network organisation can reduce traffic without an equivalent deterioration in terminal infrastructure or regional economic conditions. Investment analysis must therefore distinguish the stability of contractual relationships with carriers from the availability of physical terminal capacity. The ability to accommodate large vessels and perform container transfers efficiently is necessary, but the durability of traffic depends on the commercial strategies of shipping networks operating across several competing Mediterranean hubs.
This introduces a central question for public investment: which additional infrastructure produces benefits that remain economically justified under different possible shipping-network configurations? Investments that improve safety, terminal access and essential public infrastructure may retain value across several scenarios. Investments justified exclusively by a particular forecast of carrier traffic could be more vulnerable. This does not imply that transshipment-oriented investment should be avoided. It means that project evaluation should explicitly account for carrier concentration, potential network changes and the distinction between local economic development and the volume of containers passing through the terminal.
The regional economic benefits of transshipment should also be assessed independently from gross throughput. Container handling generates direct employment and demand for specialised services, but the local industrial and logistics effects may differ from those associated with cargo entering inland production and distribution networks. A large increase in transshipment activity does not automatically create a corresponding increase in domestic manufacturing, warehousing or inland freight transport. Consequently, policies intended to expand the economic contribution of Gioia Tauro must distinguish between measures improving its position as a maritime redistribution hub and measures designed to establish additional industrial or logistics functions. These objectives may complement each other but should not be presented as interchangeable.
Marseille-Fos: the Mediterranean industrial-energy interface
Marseille-Fos provides one of the strongest examples of a Mediterranean port whose competitiveness depends on the interaction between maritime activity, industrial operations and energy infrastructure. The port is connected to the industrial economy of southern France and the Rhône corridor, and its cargo profile includes substantial liquid-bulk activity alongside containers, solid bulk and other goods. This gives Marseille-Fos a different investment and transition profile from ports principally dependent on containerised freight. The future of its energy infrastructure is therefore linked both to the continuation of established industrial activity and to the commercial development of alternative energy functions.
The port’s 2025 figures illustrate this orientation. Marseille-Fos reported 47.6 million tonnes of liquid bulk, 6.8 million tonnes of solid bulk and approximately 1.45 million TEU. The port authority also reported €235.3 million in revenues and €105 million in investment expenditure. Its reported container modal shares included 16% by rail and 5% by inland waterway. These indicators establish an operating model with significant energy-related cargo activity and a measurable, although incomplete, role for non-road inland transport. They also show why the port should be evaluated through different criteria from an inland-oriented container gateway or a predominantly transshipment terminal. Marseille-Fos: Key Figures for 2025 — Grand Port Maritime de Marseille — January 2026. Key figures for 2025
The financial results provide a basis for examining the scale of investment undertaken by the port institution, but they should not be treated as the total capital expenditure of the industrial cluster. The port authority’s investment represents expenditure within its own reporting perimeter, while the industrial companies using port infrastructure may undertake independent investments in processing, storage, production and distribution. Moreover, the reported inland modal shares identify the relative role of railway and inland waterway transport in container movements; they do not establish the availability or utilisation of all transport infrastructure connected to the port. A rigorous comparison with Northern European gateways would require equivalent measures of inland transport frequency, cost, reliability and the geographic distribution of cargo origins and destinations.
Marseille-Fos is also important in the debate over Mediterranean multi-energy hubs because its established liquid-bulk infrastructure offers a potential foundation for energy-system transformation. Existing maritime access, industrial land and distribution networks can reduce some barriers to investment in new energy carriers. Nevertheless, the economic conversion of these assets depends on their technical compatibility with future products and on the strength of associated industrial demand. Hydrogen, ammonia, synthetic fuels, LNG and carbon-management infrastructure have different handling requirements, safety conditions and revenue structures. The presence of a large existing energy cluster cannot therefore be treated as proof that each proposed new energy activity will be commercially viable. The relevant assessment must consider individual investment decisions, committed customers and the extent to which new infrastructure can share existing facilities without imposing unacceptable technical or financial risks.
France’s national port challenge: strategic location without equivalent competitive penetration
France’s experience deserves particular attention because its geographic position and maritime infrastructure have not produced a uniform ability to compete with the Northern European Range. The French National Assembly’s July 2026 report on port competitiveness provides a detailed institutional examination of this issue. It identifies the diversity of French port assets and their industrial importance but also highlights structural competitive weaknesses, administrative and operational constraints, and changes in maritime traffic. Its historical traffic comparison shows that several major French ports handled less cargo in 2025 than in 2010, despite substantial infrastructure and industrial activity. The report’s figures indicate that HAROPA handled 84.7 million tonnes in 2025, compared with 97.4 million tonnes in 2010, while Marseille handled approximately 74.0 million tonnes, compared with 86.0 million tonnes in 2010. Dunkerque, by contrast, increased from 42.9 million tonnes to 48.0 million tonnes over the same period. Evaluation of the Competitiveness of French Ports, Report No. 3020 — French National Assembly — July 2026. Assemblée nationale+1
| French port system | 2010 cargo traffic | 2025 cargo traffic | Approximate change | Interpretation |
|---|---|---|---|---|
| HAROPA | 97.4 Mt | 84.7 Mt | −13.0% | Substantial long-term traffic decline despite recovery in 2025 |
| Marseille-Fos | 86.0 Mt | 74.0 Mt | −14.0% | Long-term adjustment in a major industrial-energy port |
| Dunkerque | 42.9 Mt | 48.0 Mt | +11.9% | Stronger long-term development than the other two major systems |
| Nantes–Saint-Nazaire | 31.0 Mt | 26.4 Mt | −14.8% | Reduced cargo volume over the period |
Source: French National Assembly, Report No. 3020, 7 July 2026. Percentage changes are those reported in the parliamentary comparison; figures are rounded and refer to cargo tonnes rather than containers. Official Parliamentary Traffic Comparison — Assemblée nationale — July 2026.
The French figures are analytically important because they show that infrastructure location and public institutional support do not guarantee increased market share. They also demonstrate why a single explanation for port competitiveness is insufficient. Some cargo categories may contract because of structural industrial changes, while others grow through containerisation or changes in trade routes. A reduction in total tonnage may coexist with an increase in particular higher-value logistics activities. Conversely, a port may increase overall tonnage through bulk cargo without strengthening its position in containerised freight or inland distribution. National port policy should therefore distinguish changes driven by sectoral demand from those resulting from administrative inefficiency, insufficient transport connectivity or commercial underperformance.
The public institutional structure of the French grands ports maritimes is also relevant to comparisons with Italy. These ports perform strategic infrastructure and territorial management functions within a public institutional framework while interacting with commercial operators and industrial firms. The French experience suggests that formal public ownership is not the sole explanation for competitive difficulties. The relationship between operational governance, industrial strategy, inland transport integration and the efficient use of infrastructure is equally consequential. It also demonstrates that a country can possess several major seaports with different trajectories under a broadly shared national policy environment. The implication for Italian reform is that a uniform institutional response may be insufficient when commercial and geographic constraints vary substantially by port.
Valencia: the distinction between container throughput and domestic gateway performance
Valencia provides a particularly useful Mediterranean benchmark because its detailed statistics allow the separation of container traffic connected to inland economic activity from maritime transit or transshipment. In 2025, the Valencia Port Authority reported approximately 5.663 million TEU, an increase of 3.41% from 2024. Its merchandise statistics distinguish 3.110 million TEU associated with loading and unloading from 2.552 million TEU in transit. The former increased by 14.35%, while the latter declined by 7.39%. The port also reported 80.062 million tonnes of goods traffic, down approximately 0.75%, with loading and unloading tonnage increasing while transit tonnage declined. These divergences demonstrate why total TEU growth can conceal substantial changes in the underlying composition of traffic. Valenciaport: Official Goods and Container Traffic Statistics 2024–2025 — Port Authority of Valencia. Valenciaport+1
| Valencia traffic indicator | 2024 | 2025 | Reported change |
|---|---|---|---|
| Total containers | 5,475,773 TEU | 5,662,661 TEU | +3.41% |
| Loading/unloading containers | 2,720,047 TEU | 3,110,474 TEU | +14.35% |
| Transit containers | 2,755,726 TEU | 2,552,187 TEU | −7.39% |
| Total goods traffic | 80,666,175 t | 80,061,993 t | −0.75% |
| Loading/unloading goods | 46,107,020 t | 49,032,547 t | +6.35% |
| Transit goods | 34,559,155 t | 31,029,446 t | −10.21% |
The table shows an important pattern: Valencia’s container traffic grew even as transit container volumes declined. The stronger performance of loading and unloading indicates a different commercial development from a purely transshipment-driven increase. However, the authority’s statistical categories should not be interpreted as a direct measurement of domestic manufacturing value added. They identify traffic operations, not the ultimate economic origin or destination of every shipment. A full assessment of gateway activity would require origin-destination surveys, customs information and inland transport records.
Valencia’s 2025 provisional financial results also permit a more detailed evaluation of the relationship between traffic and institutional resources. The port authority reported €164.3 million in turnover, up 9.02%, and €43.7 million in pre-tax profit, up 50.51%. Revenue growth was associated partly with stronger port-fee income. The authority reported port fees of €139.9 million, compared with €126.9 million in 2024. These figures demonstrate that a publicly owned port authority operating within the Spanish system can generate commercial revenues and positive accounting results while supporting infrastructure investment. They do not establish that the Spanish model is superior to the Italian model in every respect, but they challenge any proposition that public ownership necessarily prevents financially disciplined port administration. Valenciaport: Provisional Financial Results and Traffic for 2025 — Port Authority of Valencia — February 2026. Valenciaport+1
The strategic relevance of Valencia extends beyond its immediate traffic performance. It illustrates how a Mediterranean port can combine maritime redistribution and direct gateway functions while competing for traffic within a broader European logistics market. Yet the distinction between these activities remains important for investment allocation. Transshipment infrastructure is sensitive to carrier-network decisions, while gateway activity depends more directly on hinterland services and regional industrial demand. Public investment in maritime capacity must therefore be evaluated in conjunction with private terminal commitments and inland transport performance. Expansion justified through anticipated container growth should consider the possibility that growth occurs primarily in a different segment from the one originally forecast.
Algeciras and the Strait of Gibraltar: maritime position and transshipment competition
Algeciras occupies a strategically important maritime position at the junction between the Atlantic and the Mediterranean, with access to major east-west shipping routes and connections serving European and international markets. This creates significant advantages for container redistribution and other maritime operations. However, the commercial value of this location is shaped by competition with alternative transshipment hubs, the scheduling decisions of shipping companies and the ability of terminals to provide efficient vessel services. Algeciras is therefore best assessed as part of a competitive network rather than as a self-contained national gateway.
The structure of this competition differs from the contest between Genoa and Northern European inland gateways. A transshipment operator prioritises vessel turnaround, terminal efficiency, nautical accessibility, operating cost and the ability to connect several shipping services. Inland railway access remains relevant to the development of gateway cargo, but it may not determine the majority of traffic handled through a predominantly maritime redistribution function. Consequently, the infrastructure investments that generate returns for Algeciras may differ significantly from those justified by industrial access to Central European markets.
The competitive relationship with North African ports is particularly consequential. Mediterranean container redistribution is not confined to EU jurisdictions, and shipping companies evaluate competing facilities according to their commercial and operational characteristics. A port’s position on a maritime route does not confer permanent traffic rights. Carrier networks may change as vessel sizes, alliances, relative costs and terminal arrangements evolve. For this reason, a precise assessment of Algeciras requires terminal-level capacity, maritime service patterns and comparable verified traffic statistics from its competitors. This chapter does not assign an unverified 2025 throughput figure or invent a market share in the absence of an opened primary statistical record.
Greece and the Eastern Mediterranean: commercial gateways under geopolitical and corridor constraints
Greece occupies a different geographic and commercial position within the Mediterranean because its principal maritime gateways participate in routes connecting the Eastern Mediterranean, the Balkans and Central European markets. Piraeus and Thessaloniki have distinct economic functions: Piraeus is associated with containerised maritime services and an extensive port complex, while Thessaloniki offers a different relationship with Balkan hinterland markets. The potential value of these gateways is therefore connected to the quality of rail and road corridors extending into Southeastern Europe, the reliability of border crossings and the competitive organisation of shipping networks.
The strategic importance of Greek ports should not be reduced to their location near routes connecting Asia and Europe. Maritime traffic patterns are influenced by geopolitical developments and by the reliability of major trade passages. An apparent geographic advantage can narrow or disappear when vessel routing changes, particularly if maritime transport becomes subject to longer detours, insurance costs or security restrictions. In addition, the ability to serve inland Balkan markets depends on infrastructure and institutional arrangements beyond Greek territorial jurisdiction. Railway investment within the port country cannot by itself resolve bottlenecks elsewhere along the transport corridor.
This produces an analytical relationship between Greek and Balkan port systems that differs from the conditions in much of Northern Europe. The value of additional maritime capacity depends on cross-border transport performance, the availability of reliable freight services and the extent to which industrial customers can exploit the proposed routes. Where these conditions are weak, port expansion may increase nominal handling capacity without achieving the expected redistribution of European freight flows. Where they improve, the same geographic position could support greater gateway activity. The investment question is therefore conditional on corridor performance, not solely on port infrastructure.
Mediterranean energy imports: industrial capacity, geopolitical exposure and the problem of future demand
The ambition to develop Mediterranean ports as multi-energy hubs is economically plausible but must be treated with considerable analytical discipline. Several ports already possess maritime energy infrastructure, industrial land, storage facilities and connections to existing distribution networks. These assets can support investment in LNG, alternative fuels, electricity infrastructure, hydrogen derivatives and carbon-management activities. Nevertheless, the economic viability of new facilities depends on the particular commodity, its expected demand, the technical characteristics of the infrastructure and the contracts available to finance development.
A major distinction exists between importing energy carriers for which established customers and markets already exist and developing facilities intended to supply energy products whose demand remains uncertain. Established hydrocarbon infrastructure generally benefits from mature shipping, storage, pricing and distribution arrangements, although individual assets may face declining long-term demand. Emerging energy carriers can present greater difficulties associated with production costs, handling requirements, industrial conversion and the willingness of customers to commit to long-term purchases. In addition, port infrastructure cannot resolve all elements of the energy supply chain. An import facility may be commercially dependent on upstream production, shipping availability, national transmission capacity and downstream industrial consumption.
The implications for public investment are significant. A port authority may have sound reasons to reserve land, establish safety requirements and develop common infrastructure that can accommodate future energy activities. These preparatory functions differ from assuming demand risk or financing an industrial plant whose expected customers have not made binding commitments. Public financing may be justified where infrastructure provides collective benefits or addresses identifiable market failures, but the economic case must remain separate from political narratives concerning energy sovereignty or future industrial transformation. A multi-energy port strategy is financially credible only when the relevant components have been assessed through their individual investment and operating economics.
Mediterranean competitive positioning: comparative operational evidence
The available figures establish a differentiated Mediterranean port economy in which cargo composition and hinterland functions matter at least as much as aggregate size.
| Port or system | Verified recent operating evidence | Dominant analytical function | Principal economic dependency |
|---|---|---|---|
| Genoa / Ligurian gateways | Italian system within substantial national cargo market | Gateway access to northern Italian and transalpine markets | Railway and inland distribution performance |
| Trieste | Established northern Adriatic railway-oriented gateway | Central European freight and industrial access | Cross-border rail service competitiveness |
| Gioia Tauro | Major Italian container redistribution function | Maritime transshipment | Shipping-network concentration and terminal efficiency |
| Marseille-Fos | 74.0 Mt in 2025; 47.6 Mt liquid bulk; 1.45m TEU | Industrial-energy port and Mediterranean gateway | Industrial demand and Rhône corridor access |
| Valencia | 80.062 Mt and 5.663m TEU in 2025 | Mixed gateway and transshipment | Inland cargo growth and carrier-network decisions |
| Algeciras | Strategic Strait of Gibraltar maritime position | International maritime redistribution | Carrier-network competition |
| Piraeus | Major Eastern Mediterranean gateway and container port | Maritime connectivity and Southeast European access | Shipping services and Balkan corridors |
| Thessaloniki | Northern Greek access to Balkan markets | Regional gateway and industrial logistics | Cross-border transport efficiency |
Sources for the numerical observations: Marseille-Fos 2025 Figures — Port Authority — January 2026 and Valencia 2025 Goods Statistics — Port Authority of Valencia. Other entries describe functions and dependencies rather than unverified throughput values.
The differences in port function create an important limitation for international benchmarking. A high-volume transshipment port can rank above an inland-oriented gateway by TEU while generating a different pattern of local economic value. An industrial-energy port can have greater total tonnage than a container gateway while possessing less container capacity. A port with a strong railway market may derive substantial competitive value from inland connectivity even if its total maritime traffic is modest. Accordingly, public authorities should resist the use of general traffic rankings as substitutes for measures of economic performance.
Hinterland connectivity and the economics of terminal choice
The competitive role of inland transport can be examined through a more precise definition of the services purchased by cargo owners. Freight customers do not generally purchase port throughput as an independent product. They purchase transport between commercial origins and destinations, subject to delivery deadlines, cargo-handling requirements and contractual obligations. The port is one component in that chain. A choice between Mediterranean and Northern European routes therefore depends on the total transport service, including the availability of maritime connections, terminal handling performance, railway schedules, inland terminal access, customs arrangements and the reliability of the complete operation.
This economic perspective changes the criteria by which infrastructure projects should be prioritised. A project that reduces vessel waiting times may create direct value for shipping companies. A rail connection that increases the frequency or reliability of inland services can change the commercial attractiveness of an entire gateway. A digital system that reduces uncertainty about container availability can lower inventory costs and improve coordination. Conversely, capacity expansion that does not address the binding operational bottleneck may deliver limited economic benefits. The relevant investment problem is therefore to identify the constraint that determines the performance of the complete logistics chain.
This is also why headline comparisons between the Northern Range and Mediterranean ports can be misleading. The geographic distance between a port and an inland market may be measurable, but distance is not identical to transport cost or reliability. A long-established railway service can offer competitive pricing, frequency and predictability that compensate for greater physical distance. An apparently shorter route may be commercially unattractive if trains operate infrequently, terminal processing is inconsistent or cross-border procedures introduce delays. Infrastructure policy should therefore assess commercially available services and total delivery costs rather than relying on geographic maps as evidence of competitive advantage.
Comparative economic and financial indicators
| Institution / port | 2025 traffic | 2025 port-authority revenue | Other verified financial or operational indicators | Comparability limitation |
|---|---|---|---|---|
| Rotterdam | 428.4 Mt; 14.2m TEU | €940.4m | €583.6m EBITDA; €291.4m capital investment | Authority accounts exclude much private cluster investment |
| Antwerp-Bruges | 266.5 Mt | Not established on a reconciled basis here | Approximately 25 days of industrial disruption | Authority and private-operator perimeters differ |
| Hamburg | 114.6 Mt; 8.3m TEU | Not established on a reconciled basis here | 7.0m loaded TEU | Public infrastructure and terminal accounts must be separated |
| Marseille-Fos | 74.0 Mt; 1.45m TEU | €235.3m | €105m investment; rail modal share 16%, river 5% for containers | Accounting and operational perimeters differ |
| Valencia | 80.062 Mt; 5.663m TEU | €164.3m provisional | €43.7m provisional pre-tax profit | Provisional authority financial reporting |
| Italian port system | Above 510 Mt; almost 13m TEU | Not applicable as one consolidated commercial entity | Nationally aggregated cargo volumes | Multiple independent port authorities and operators |
Primary sources: Rotterdam 2025 Results — Port of Rotterdam Authority — February 2026; Antwerp-Bruges 2025 Results — Port of Antwerp-Bruges — January 2026; Hamburg 2025 Results — Hamburg Port Authority — February 2026; Marseille-Fos 2025 Results — Grand Port Maritime de Marseille — January 2026; Valencia 2025 Financial Results — Port Authority of Valencia — February 2026; Italian 2025 Port Statistics — Assoporti — June 2026.
The table supports descriptive comparisons of observed traffic and disclosed financial results, but it does not justify ranking these ports by efficiency or investment quality. Meaningful financial benchmarking would require adjustments for differences in institutional perimeter, accounting practices, asset ownership, public financing and commercial responsibilities. The absence of a harmonised figure is not a zero value and should not be replaced by a speculative estimate. This is particularly important for investment analysis because the amount of money spent by an authority and the amount of private capital mobilised in its industrial cluster are different variables.
Key judgements — Chapter 3
High confidence: Mediterranean port competitiveness depends on the quality of inland connectivity, cargo composition and shipping-network relationships, rather than geographic proximity to international maritime routes alone. The 2025 results from Valencia and Marseille-Fos, alongside the French parliamentary analysis, demonstrate that Mediterranean port systems exhibit different operating models and performance trajectories. Aggregate traffic is an inadequate proxy for commercial competitiveness.
Medium confidence: Selective investment in railway connectivity, reliable gateway services, industrial infrastructure and commercially supported energy facilities offers a more credible basis for strengthening Mediterranean competitiveness than indiscriminate expansion of terminal capacity. The effectiveness of such investment will vary according to port location, cargo market, industrial demand and the availability of complementary transport infrastructure.
What would change the assessment: Verified evidence of sustained improvements in inland rail performance, lower end-to-end transport costs, growth in commercially significant gateway traffic and privately financed industrial projects would strengthen the outlook for Mediterranean ports. Persistent transshipment dependence without growth in inland market penetration, continued project delays or underutilised new infrastructure would weaken it.
Open official record: Harmonised port-by-port gateway and transshipment statistics; end-to-end freight costs; rail service frequency and reliability; terminal-level utilisation; private-capital expenditure by economic activity; and financially committed versus announced energy projects.
Pillar I — Integrated Institutional Net Assessment
The evidence assembled across Italy, Northern Europe and the Mediterranean supports a common conclusion while revealing important differences in the mechanisms through which port competitiveness is created. Italy’s principal institutional challenge is the relationship between statutory port governance, concession rights and predictable investment implementation. Northern European ports demonstrate how commercially accountable public organisations and substantial industrial clusters can support major infrastructure investment, but their experience also shows the vulnerability of these arrangements to industrial restructuring and energy-market conditions. Mediterranean gateways face an additional challenge because their geographic advantages must be converted into commercially reliable access to inland markets. The financial performance of an individual port institution, the physical capacity of its terminals and the attractiveness of its wider industrial environment are therefore related but analytically distinct indicators.
The strongest evidence does not support the claim that one ownership model is universally superior. Public-law authorities, public corporations, private operators and independent statutory ports can all participate in commercially successful transport systems, provided that responsibilities, investment commitments and infrastructure obligations are sufficiently clear. Nor does it support an assumption that new infrastructure necessarily creates additional demand. The most consequential investments may be those that remove bottlenecks in existing transport chains, improve the reliability of inland services or provide common infrastructure for industrial projects supported by enforceable customer commitments. The institutional challenge is to establish financial and regulatory arrangements that permit these investments to proceed without transferring poorly defined commercial risks to public budgets.
The principal strategic implication for 2027–2035 is that governance reform should be judged by observed investment outcomes rather than institutional design alone. Relevant evidence will include the time required to obtain permissions, the amount of private capital reaching financial close, the proportion of projects commissioned within planned schedules, the operational utilisation of completed assets and the durability of commercial revenues. This approach provides a more defensible basis for public infrastructure decisions than comparisons based exclusively on traffic volumes, announced expenditure or the number of projects included in national strategies.
One numerical precision correction to the illustrative concession model in Chapter 1: at an 8% discount rate, the present value of 40 annual payments of €15 million is approximately €178.9 million, rather than €179.4 million. The investment conclusion is unchanged.
The next analytical pillar moves from maritime governance and competitive geography to the operational economics of inland transport, the Balkan–Danube system, energy-transition implementation and exposure to hydrological and industrial risks. Its distinct contribution will be to examine whether the infrastructure and investment frameworks identified in Pillar I can produce dependable operational performance under the physical, environmental and commercial conditions affecting European transport corridors.
Pillar II — Operational Performance, Energy Economics and Climate Exposure
Chapter 4. Balkan and Danube River Ports: Throughput, Navigability and Structural Underutilisation
Principal judgement — High confidence. The Danube’s principal development constraint is the gap between the corridor’s geographical connectivity and its commercially reliable transport capacity. This gap cannot be explained adequately by insufficient investment in individual port terminals, nor can it be resolved through the construction of additional berths alone. The evidence from 2024 and 2025 points to a transport system in which cargo concentration, hydrological instability, unequal infrastructure quality, industrial demand, cross-border coordination and the limited development of scheduled intermodal services combine to restrict market penetration. The consequences are particularly relevant to Serbia because the country’s river-port system lies along a strategically important section connecting Central European industrial markets with Romania, the Black Sea and the broader Balkan economy. Yet the distribution of observed activity among Smederevo, Pančevo, Novi Sad, Prahovo and the Sava ports shows that the economic significance of a river terminal depends primarily on its industrial relationships and logistics services, rather than on its location along an internationally navigable waterway. The official record also establishes that several major Danube ports experienced pronounced declines in 2025, although those declines cannot all be attributed to drought: industrial output, agricultural trade, the reorganisation of Ukrainian freight routes and geopolitical disruption also contributed to changes in traffic. The resulting strategic conclusion is that hydrological reliability and freight-demand resilience must be evaluated jointly, while physical port capacity must be distinguished from actually utilised capacity.
The commercial geography of the Danube: three transport economies within one river system
The Danube is often presented as a continuous European freight corridor, but its economic geography is substantially more complex than a uniform river transport route. The Upper Danube connects industrial and logistics locations in Germany and Austria; the Middle Danube extends through Hungary, Slovakia, Croatia and Serbia; and the Lower Danube connects Bulgaria, Romania and the approaches to the Black Sea. The Rhine–Main–Danube connection creates the possibility of inland navigation between the North Sea and the Black Sea, but the existence of this physical connection does not mean that freight can be carried competitively along every section under all hydrological conditions. Different sections have different channel characteristics, infrastructure requirements, navigation constraints, industrial markets and competing transport services. The economic viability of a journey extending over several countries consequently depends on the weakest operational elements of the complete route, including admissible vessel draught, passage through locks, navigation restrictions, border formalities, terminal availability and the costs of positioning vessels and equipment.
This geographical distinction is crucial when assessing investment proposals. A port situated along a navigable section of the Danube may possess sufficient quay length and cargo-handling equipment for its immediate industrial market, while remaining poorly positioned to attract regular container services because its customers are dispersed, rail connections are inadequate or the river journey cannot meet delivery requirements consistently. Conversely, a comparatively modest river terminal connected directly to a large industrial customer may achieve significant throughput with limited infrastructure diversification. The appropriate analytical unit is therefore not simply the port or the river section. It is the relationship between a specific cargo flow, its origin and destination, the associated industrial or trading activity, the transport services available and the seasonal constraints imposed by navigation conditions.
The scale of the corridor must also be understood through consistent definitions. Port cargo handling measures the tonnes loaded or unloaded at a terminal. Freight carried on a river section measures cargo passing a particular location. Transport work, expressed in tonne-kilometres, combines freight volume with the distance transported. These measures are not interchangeable. Cargo can be handled at more than one port during a transport chain, while a vessel may cross several measurement points without the cargo being reloaded. Aggregating port-handling figures across jurisdictions is therefore not equivalent to calculating total freight transported along the Danube. The Central Commission for the Navigation of the Rhine’s European Inland Navigation Market Observation, statistical annex for 2025 explicitly limits its aggregated Danube port series to the ports included in the table and identifies differences in the statistical sources used for some Romanian observations. Observation Du Marché+1
The 2025 traffic contraction: a major deterioration concealed by aggregate corridor narratives
The latest comparable port observations provide a more demanding picture of Danube performance than general statements about the corridor’s potential. The CCNR’s statistical annex, drawing on Danube Commission observations and Romanian statistical data, records a decline in cargo handling among the listed major Danube ports from 58.9 million tonnes in 2024 to 45.5 million tonnes in 2025, equivalent to a reported contraction of 22.8%. This is a substantial deterioration, but it must not be described as a fall in the total freight transported on the entire Danube, because the series represents a selected group of river ports. Moreover, the deterioration was geographically unequal. Smederevo and Prahovo recorded increases, while Pančevo and Novi Sad contracted sharply. Romanian and Ukrainian ports also experienced major falls, reflecting different combinations of hydrological, economic and geopolitical factors.
The distribution matters more than the aggregate decline alone. If cargo contraction were driven uniformly by reduced navigability, one might expect a broadly similar direction of change across ports exposed to comparable water conditions. The observed divergence, including growth at Smederevo and Prahovo during the same reporting year in which Novi Sad and Pančevo declined, indicates that individual cargo markets and industrial relationships materially influence performance. Hydrology remains a significant constraint, particularly on vessel loading and journey reliability, but it cannot be treated as the sole explanation for all changes in throughput. The CCNR Statistical Annex, Table 17, 2025 provides the comparative evidence.
Major Danube ports: observed cargo handling, 2022–2025
All values are in million metric tonnes. Annual changes are the percentages published in the CCNR statistical annex, which draws on the Danube Commission and national official statistics. Rounded tonnage values do not always reproduce the published percentage exactly.
| Port | Country | 2022 | 2023 | 2024 | 2025 | 2025/2024 |
|---|---|---|---|---|---|---|
| Constanța — inland-waterway cargo | Romania | 15.4 | 21.7 | 17.0 | 13.0 | −24.0% |
| Izmail | Ukraine | 8.9 | 20.3 | 13.4 | 7.6 | −43.3% |
| Smederevo | Serbia | 3.0 | 2.8 | 2.8 | 3.1 | +11.6% |
| Linz | Austria | 2.9 | 2.9 | 2.8 | 2.7 | −5.9% |
| Galați | Romania | 3.1 | 1.9 | 3.2 | 2.6 | −17.4% |
| Giurgiulești | Moldova | 2.1 | 2.7 | 2.6 | 2.6 | +1.8% |
| Bratislava–Komárno | Slovakia | 1.9 | 1.5 | 1.5 | 1.7 | +15.4% |
| Drobeta-Turnu Severin | Romania | 1.0 | 1.4 | 1.4 | 1.5 | +10.7% |
| Prahovo | Serbia | 0.9 | 1.0 | 1.4 | 1.4 | +5.0% |
| Pančevo | Serbia | 1.6 | 1.6 | 2.2 | 1.3 | −41.9% |
| Reni | Ukraine | 6.8 | 10.1 | 3.4 | 1.1 | −68.0% |
| Regensburg | Germany | 1.1 | 1.0 | 0.9 | 1.1 | +21.1% |
| Budapest-Csepel | Hungary | 1.0 | 0.9 | 0.9 | 1.0 | +7.3% |
| Giurgiu | Romania | 0.7 | 0.7 | 0.8 | 0.9 | +17.2% |
| Novi Sad | Serbia | 0.9 | 0.9 | 1.4 | 0.8 | −42.7% |
| Vienna | Austria | 0.6 | 0.6 | 0.7 | 0.8 | +18.3% |
| Călărași-Chiciu | Romania | 0.6 | 0.9 | 0.7 | 0.7 | +2.5% |
| Măcin | Romania | 0.9 | 0.7 | 0.7 | 0.6 | −20.4% |
| Brăila | Romania | 0.8 | 0.4 | 0.1 | 0.2 | +57.6% |
| Tulcea | Romania | 0.5 | 0.2 | 0.1 | 0.1 | −18.0% |
| Total of ports in the official table | Multiple jurisdictions | 55.7 | 75.0 | 58.9 | 45.5 | −22.8% |
Source: Statistical Annex, Table 17: Inland Waterway Cargo Handling in Major Danube Ports — Central Commission for the Navigation of the Rhine, European Inland Navigation Market Observation — 2026. Observation Du Marché
The statistics establish a substantial contraction among the reporting ports, but their interpretation requires several qualifications. First, the exceptionally high volumes recorded at certain Ukrainian and Romanian ports in 2023 were influenced by the restructuring of Ukrainian grain and commodity exports following disruption to established Black Sea routes. The subsequent decline in some Danube-port handling therefore includes a normalisation of extraordinary wartime freight patterns, not necessarily a deterioration in the ports’ underlying physical productivity. Second, the 2025 results coincide with documented low-water conditions affecting navigation on parts of the river, but the relative contribution of hydrology cannot be calculated directly from the annual port series. Third, individual ports serve different industries. The growth of Smederevo is not evidence that all navigability constraints disappeared, just as the decline of Novi Sad does not prove that water levels were the only limiting factor. For decision-making, the critical requirement is to combine port statistics with daily water levels, industrial production, commodity flows and actual vessel-loading records.
Serbia: industrial concentration instead of a diversified logistics system
Serbia’s river-port system provides an especially useful case for analysing the relationship between industrial demand and river transport. Its ports occupy different positions within the national economy, and their observed cargo volumes reflect those differences. Smederevo is closely connected to metal and steel-related industrial logistics. Pančevo participates in an industrial and energy-related economic geography east of Belgrade. Novi Sad has a broader relationship with the agricultural and industrial economy of Vojvodina. Prahovo serves industrial and bulk-cargo activity in eastern Serbia. Belgrade, by contrast, must be considered through the historical reorganisation of waterfront functions, the changing role of freight infrastructure and the availability of alternative logistics sites within the metropolitan region. These distinctions prevent the construction of a valid national port-performance ranking based solely on the annual tonnage of individual terminals.
The 2025 figures reveal the degree of exposure to changes in specific cargo markets. Smederevo handled approximately 3.1 million tonnes, compared with 2.8 million tonnes in 2024, while Prahovo handled approximately 1.4 million tonnes, compared with 1.4 million tonnes in the rounded 2024 series. Pančevo declined from approximately 2.2 million to 1.3 million tonnes, and Novi Sad from approximately 1.4 million to 0.8 million tonnes. This dispersion indicates that Serbia does not possess one uniform river freight market. Its terminals operate within distinct industrial and commercial environments, and it would be misleading to infer national logistics modernisation from isolated increases in throughput. The verified port series does not provide a comparable 2025 figure for Belgrade; that absence must not be interpreted as proof of zero river-related freight activity in the metropolitan area.
| Serbian port | 2024 | 2025 | Reported change | Principal analytical exposure |
|---|---|---|---|---|
| Smederevo | 2.8 Mt | 3.1 Mt | +11.6% | Industrial and metal-related bulk flows |
| Prahovo | 1.4 Mt | 1.4 Mt | +5.0% | Industrial bulk and local cargo demand |
| Pančevo | 2.2 Mt | 1.3 Mt | −41.9% | Industrial and energy-related cargo variation |
| Novi Sad | 1.4 Mt | 0.8 Mt | −42.7% | Agricultural, industrial and trading activity |
| Belgrade | Not established in this comparable port series | Not established | Not calculated | Urban redevelopment, freight-location changes and logistics reorganisation |
Source: CCNR, Inland Waterway Cargo Handling in Major Danube Ports, 2025, Table 17.
A calculation using the rounded port values indicates that the four listed Serbian Danube ports handled approximately 6.6 million tonnes in 2025, compared with approximately 7.8 million tonnes in 2024, a decline of roughly 15%. This is a derived subtotal for those four ports, not the total cargo turnover of all Serbian inland ports or the national inland-waterway freight transport figure. The distinction is essential because Serbian freight statistics also include other ports, transshipment sites and the Sava system. The national statistical office reported that total goods transported by all transport modes declined by 0.3% in 2025, while total transport work increased by 1.0%; those national figures cannot be used as substitutes for Danube-port statistics because their modal and geographic coverage is different. Serbia: Total Passenger and Goods Transport in 2025 — Statistical Office of the Republic of Serbia — June 2026. Republički zavod za statistiku Srbije
Smederevo: strong industrial dependence and its strategic implications
Smederevo demonstrates how an industrially anchored river terminal can sustain substantial traffic without necessarily developing a diversified logistics economy. Its relationship with steel-related and other bulk activities creates identifiable cargo demand, and the transport of industrial inputs and outputs can be well suited to inland navigation where shipment sizes and delivery schedules are compatible with river transport. However, dependence on a limited group of major industrial customers introduces concentration risk. Changes in production, raw-material sourcing, energy prices or the commercial position of a major industrial facility can directly affect port turnover. A port may therefore record high utilisation during a period of strong industrial demand while remaining vulnerable to a structural decline in the underlying industry.
The investment consequences differ from those of a diversified container gateway. Where throughput is tied to a major industrial customer, the commercial case for terminal equipment, storage and handling infrastructure should be connected to that customer’s medium-term production plans and contractual commitments. Public funding may still be justified for navigation safety, environmental infrastructure and common transport access, but investments intended to expand commercial handling capacity should be evaluated against the stability of the relevant industrial flows. The 2025 increase in Smederevo’s cargo volume establishes that the port performed better than several other Serbian river terminals during that year. It does not, by itself, establish that its traffic is diversified, that additional berth construction is required or that the port has become a reliable container logistics gateway.
Novi Sad: the tension between agricultural potential and service reliability
Novi Sad’s position within Vojvodina creates a natural relationship with agricultural production, commodity trade, food processing and related industrial activity. River navigation can offer a competitive transport option for sufficiently large and consolidated shipments, particularly where storage facilities, loading equipment and access to inland waterways support the movement of bulk goods. However, the commercial characteristics of agricultural cargo introduce additional variability. Harvest volumes, international commodity prices, the timing of exports, seasonal storage requirements and the availability of alternative transport routes can all influence the quantity of cargo delivered to the port. Hydrological restrictions may coincide with periods of high export demand, increasing the economic significance of low-water conditions even when their duration is limited.
Novi Sad’s reported contraction of 42.7% in 2025 is consequently important but cannot be assigned to a single cause without more granular evidence. To identify the reasons, an investor would need monthly commodity-level turnover, operating draughts, vessel numbers, cargo carried per vessel, agricultural export volumes and comparable road and railway tariffs. A decline caused primarily by a weak harvest would have different investment implications from one caused by repeated navigation restrictions or the loss of commercial customers. The first might favour greater operational flexibility and storage capacity, the second would increase the importance of fairway maintenance and vessel suitability, and the third could indicate a more fundamental problem with the port’s competitive position. The observed decline is a reliable indicator of exposure; attribution to a particular mechanism requires additional official evidence.
Pančevo and Prahovo: why cargo composition matters more than aggregate throughput
Pančevo and Prahovo illustrate the heterogeneity of Serbia’s port-industrial geography. Pančevo’s economic environment includes significant industrial and energy-related activity, while Prahovo serves a different configuration of industrial demand and bulk transport. Cargo associated with chemical production, petroleum activities, metals or other industrial processes can involve specialised storage, safety systems, vessel types and handling equipment. These facilities are not necessarily interchangeable with container terminals or agricultural bulk installations. A decline in one commodity category may therefore reduce utilisation of dedicated assets without creating immediately available capacity for an alternative cargo.
This makes investment diversification more difficult than a simple comparison of terminal capacity might suggest. A quay suitable for a particular type of industrial cargo may require substantial additional expenditure before it can accommodate different vessel-handling systems. Storage installations may be restricted by safety regulation or technical characteristics. Rail connections designed around an industrial production facility may not provide a commercially attractive service for general cargo or containers. Consequently, port development strategies should distinguish between diversification that can exploit existing infrastructure and diversification requiring a new operating model. The increase recorded at Prahovo in 2025 offers evidence of continuing commercial demand in its existing market, but it does not establish the financial viability of unrelated investments.
Belgrade: metropolitan logistics, waterfront redevelopment and the location of freight infrastructure
Belgrade requires a different analytical treatment because the economic geography of a large metropolitan area creates substantial competition for waterfront land. Riverfront redevelopment, passenger transport, urban infrastructure and commercial property uses can conflict with conventional freight-handling operations. The economic question is not simply whether a cargo port should remain at a historically established location. It is whether freight operations can be provided more effectively through facilities possessing suitable industrial land, road and railway access, navigation conditions and sufficient separation from incompatible urban activities. A decision to relocate or restructure port functions can improve urban development outcomes while creating significant costs for freight operators if the replacement logistics infrastructure is not available when required.
The commercial risk is especially acute where an existing port function is reduced before an alternative site becomes fully operational. Freight customers may shift permanently to road or rail, terminal operators may face uncertain investment rights and logistics businesses may avoid committing capital until the new institutional and physical arrangements become clear. A credible redevelopment and relocation strategy must therefore include more than designation of land for future logistics use. It requires confirmed site availability, environmental suitability, transport connections, enforceable development arrangements and continuity of service for existing users. Because the comparable official 2025 Danube-port series does not identify a Belgrade cargo figure, it cannot support a quantified claim about current berth utilisation or the volume of freight displaced by metropolitan redevelopment. Such claims require port-specific administrative and operational records.
The Sava system: an additional source of corridor fragmentation
The Sava River links Slovenia, Croatia, Bosnia and Herzegovina, and Serbia, and connects with the Danube at Belgrade. Its transport potential is therefore closely associated with the industrial and logistics systems of the Western Balkans. However, the commercial development of Sava navigation is constrained by the different navigability characteristics of river sections, the condition of infrastructure and the uneven development of cargo terminals. The available official data show that Sava-port activity is highly concentrated and volatile, with substantial differences between Serbian, Croatian and Bosnian facilities. This is particularly important because river transport strategies frequently describe the Sava and Danube as a connected network without demonstrating that the individual links can provide comparable commercial service standards.
The CCNR’s 2025 statistical annex, incorporating information from the International Sava River Basin Commission, records 2.838 million tonnes of cargo handling across the listed Sava ports and transshipment locations, compared with 2.777 million tonnes in 2024, a reported increase of 2.2%. However, this modest aggregate increase conceals sharp changes at individual ports, including a decline at Sremska Mitrovica from 446,000 tonnes to 55,000 tonnes. The statistical series also contains a category covering other Serbian transshipment sites, which represents the majority of the aggregate volume. Treating the total as evidence of generally improving commercial performance would therefore be misleading.
Sava-port cargo handling: 2024–2025
| Port or category | Country | 2024 | 2025 | Reported change |
|---|---|---|---|---|
| Other Serbian transshipment sites | Serbia | 1,959,000 t | 2,488,000 t | +27.0% |
| Šabac | Serbia | 203,000 t | 147,000 t | −27.7% |
| Sremska Mitrovica | Serbia | 446,000 t | 55,000 t | −87.8% |
| Slavonski Brod | Croatia | 154,000 t | 125,000 t | −18.7% |
| Brčko | Bosnia and Herzegovina | 15,000 t | 24,000 t | +59.3% |
| Selected Sava total | Multiple countries | 2,777,000 t | 2,838,000 t | +2.2% |
Source: CCNR Statistical Annex, Table 18: Inland Waterway Cargo Handling in Major Sava Ports, using International Sava River Basin Commission statistics — 2026. Observation Du Marché
The figures provide direct evidence that the corridor’s performance cannot be represented adequately by a single growth rate. The decline at Sremska Mitrovica suggests a major interruption or reduction in commercially relevant activity, but the published aggregate table does not identify its precise cause. The increase at smaller or grouped transshipment locations may reflect changes in cargo routing, reporting categories or customer activity rather than permanent structural improvement. Detailed port-level and commodity-level records are needed before either outcome can justify major investment decisions.
Croatia: river transport as an industrial and cross-border service rather than a self-sustaining network
Croatia’s inland-port economy requires analysis through both the Danube and Sava systems. The eastern Croatian Danube ports, particularly Vukovar, occupy a location relevant to cross-border commerce with Serbia, Hungary and the wider Central European economy, while the Sava ports have different hinterland relationships and infrastructure constraints. The fact that Croatia participates in the European Union’s transport and infrastructure framework provides access to common regulatory standards and potential European funding, but it does not eliminate the economic dependence of river freight on local industrial customers, navigation conditions and efficient connections to road and rail. EU membership can improve the institutional environment for infrastructure development without automatically producing cargo demand or commercially attractive transport services.
The limited scale of several Croatian river-port operations is significant. The 2025 Sava data report 125,000 tonnes at Slavonski Brod, down 18.7%, while the comparable series does not provide complete recent observations for every historically significant location. This does not establish that Croatian river ports as a whole lack economic potential. It establishes that investments must be calibrated to the scale and composition of identifiable freight markets. Where annual handling is measured in hundreds of thousands rather than millions of tonnes, the operating economics of specialised cargo equipment, permanent terminal staffing and capital-intensive infrastructure become especially sensitive to demand concentration. Public investment may be warranted to maintain strategic connectivity and safety, but commercially oriented capacity expansion requires a corresponding analysis of customers and transport contracts.
A particular challenge lies in developing services that cross several jurisdictions. A river-port operator may modernise its facilities while remaining dependent on the navigability, border procedures and transport connections of neighbouring countries. In such circumstances, national expenditure cannot produce all the benefits anticipated in a cross-border corridor strategy unless complementary measures are implemented elsewhere. The resulting coordination problem is especially relevant to Croatia, Serbia and Bosnia and Herzegovina along the Sava. The appropriate response is not necessarily to create additional supranational institutions, but to establish measurable corridor commitments covering fairway information, maintenance, border procedures, infrastructure interfaces and commercially useful transport availability.
Romania and Constanța: the Black Sea interface and the reconfiguration of wartime trade
Romania occupies a particularly important position in the Danube system because the river connects inland European markets with the Black Sea through Romanian territory and maritime infrastructure. Constanța provides a major maritime interface, while Galați, Brăila, Tulcea and other facilities participate in river and industrial freight networks. The relationship between these ports and Ukrainian trade has become strategically significant since Russia’s full-scale invasion of Ukraine in February 2022. The disruption of Ukrainian maritime routes contributed to the redirection of commodity flows through alternative Danube and Black Sea facilities, creating exceptional transport conditions in 2022 and 2023. Subsequent changes in the accessibility of Ukrainian maritime routes altered the distribution of these flows.
The statistical consequences are visible in the official port-handling series. Constanța’s inland-waterway cargo handling increased to approximately 21.7 million tonnes in 2023, then declined to 17.0 million tonnes in 2024 and 13.0 million tonnes in 2025. Izmail declined from 20.3 million tonnes in 2023 to 7.6 million tonnes in 2025, while Reni declined from 10.1 million to 1.1 million tonnes over the same period. These movements reflect a major reconfiguration of freight handling among the reporting ports. They should not be represented as evidence of a hydrology-driven collapse alone. The CCNR’s 2025 analysis of inland-waterway cargo handling explicitly associates the earlier fall at Constanța with the resumption of activity at Odessa and reduced grain handling, demonstrating that geopolitical routing decisions materially influence the series. Observation Du Marché
The distinction is particularly important for infrastructure planning. Capacity developed to accommodate extraordinary wartime freight volumes may remain useful for strategic resilience even if ordinary commercial demand subsequently falls. However, strategic value and commercial utilisation are different concepts. A terminal might serve as insurance against future disruptions while generating insufficient revenues under normal transport conditions to justify its entire investment through private cash flow. Governments must therefore decide whether such infrastructure is being financed as a commercial asset, a strategic redundancy or a combination of both. The distinction should be explicit because a publicly justified resilience investment should not be presented as a commercially self-financing terminal without evidence of sustained demand.
Navigability and drought: the physical constraint on commercial reliability
The hydrological dimension is the most important physical constraint affecting the long-term economic credibility of the Danube corridor. Inland freight vessels achieve their scale advantages by carrying substantial cargo quantities over relatively long distances. When water levels fall, the permissible loaded draught may decrease, forcing operators to reduce cargo per voyage, increase the number of journeys or shift freight to other transport modes. The resulting cost is not confined to an additional handling charge. Reduced payloads lower revenue per vessel journey while many operating costs remain relatively fixed, including crew, depreciation, insurance and the time required to complete a voyage. If navigation restrictions become frequent or unpredictable, cargo owners may prefer more expensive transport modes because they offer greater delivery reliability.
The official evidence from 2025 is unusually important because it documents the severity of the water-level problem. Material submitted within the Danube Commission’s hydrological work records 116 days below the Low Navigable Water Level in the Bulgarian section in 2025, compared with 30 days in 2024 and 111 days in 2022. The series identifies 2025 as exceptionally unfavourable within the six-year observation period. These are water-level-threshold observations for the reported Bulgarian section, not a count of days when the entire Danube was closed to navigation. The Danube Commission’s hydrological assessment of achieved fairway depths and 2025 water conditions provides the underlying record. danubecommission.org
| Year | Days below Low Navigable Water Level | Interpretation |
|---|---|---|
| 2020 | 21 | Relatively favourable conditions |
| 2021 | 53 | Increased low-water exposure |
| 2022 | 111 | Severe hydrological restriction |
| 2023 | 36 | Partial recovery |
| 2024 | 30 | Comparatively favourable |
| 2025 | 116 | Most severe year in this reported series |
Geographic scope: the Bulgarian Danube section covered by the official hydrological assessment. These observations are not equivalent to corridor-wide days of total navigation suspension. Source: Danube Commission, Hydrological Conditions and Achieved Fairway Depths in 2025 — March 2026.
The magnitude of the variation is striking. The reported number of days below the reference water level increased from 30 in 2024 to 116 in 2025, almost four times the preceding year’s figure. Yet the annual sequence also demonstrates why a simple linear drought forecast would be methodologically weak. Conditions improved sharply between 2022 and 2023 before deteriorating again in 2025. A climate-resilience assessment must therefore distinguish long-term changes in the probability and severity of hydrological extremes from year-to-year fluctuations driven by meteorological conditions. The six-year series is sufficient to establish substantial variability and repeated severe low-water exposure, but not to assign a statistically robust probability to future drought years.
The commercial implications are more complex than the number of affected days alone. Low water may constrain permissible vessel draught without stopping navigation completely. Some vessels can continue with reduced cargo, while others may be unable to operate economically. Different river sections and vessel configurations may experience different restrictions. Navigation conditions can also change over the duration of a voyage, complicating loading decisions made at an upstream port. Therefore, the relevant economic indicator should combine water-level observations with available draught, actual cargo carried per vessel and transport price movements. A port investment model that uses annual average water levels but ignores the frequency of critical restrictions may systematically overestimate reliable annual carrying capacity.
The economic effect of reduced vessel loading
The financial transmission mechanism can be illustrated through a simplified vessel-operating example without presenting hypothetical values as measured Danube conditions. Suppose that a freight vessel ordinarily carries 2,000 tonnes and incurs €20,000 in voyage-related costs. Its simplified operating cost is €10 per tonne. If low-water restrictions reduce its commercially available cargo capacity by 25% to 1,500 tonnes, while voyage costs remain unchanged, the cost increases to approximately €13.33 per tonne. A 40% reduction in cargo to 1,200 tonnes raises the simplified cost to approximately €16.67 per tonne. This model does not incorporate changes in fuel consumption, navigation time, freight rates, demurrage or fleet availability, but it demonstrates the mathematical sensitivity of transport cost to vessel loading.
| Illustrative loading condition | Cargo per voyage | Assumed voyage cost | Cost per tonne | Increase from full load |
|---|---|---|---|---|
| Full load | 2,000 t | €20,000 | €10.00 | — |
| 10% reduction | 1,800 t | €20,000 | €11.11 | +11.1% |
| 25% reduction | 1,500 t | €20,000 | €13.33 | +33.3% |
| 40% reduction | 1,200 t | €20,000 | €16.67 | +66.7% |
| 50% reduction | 1,000 t | €20,000 | €20.00 | +100.0% |
Illustrative calculation only. No assumption in this table represents a measured Serbian vessel, an official freight tariff or an observed 2025 loading restriction.
The important conclusion is that a relatively moderate reduction in available cargo capacity can create a disproportionately large increase in transport cost per tonne. This effect can be compounded when multiple vessels are required to replace the capacity of one normally loaded shipment, or when goods must be transferred to rail or road. It also changes the commercial attractiveness of infrastructure. A terminal may have adequate cranes, storage and quay capacity but receive less freight because navigation constraints make river transport too costly for its customers. In such circumstances, capital expenditure on terminal expansion cannot resolve the underlying limitation. Investment priorities should instead reflect the condition of the fairway, the availability of suitable vessels, reliable hydrological information and access to alternative transport modes.
Reliability is not the same as formal navigability
The Austrian Danube provides a useful institutional comparison because its 2025 operating record distinguishes formal navigation availability from actual freight performance. The Austrian waterway management organisation viadonau reported that the river remained navigable throughout all 365 days of 2025, without official closures caused by floods or ice. Nevertheless, cargo transport declined to 5.8 million tonnes, down 11.6%, while imports declined by 21.9% and transit cargo by 44.4%. The same report identified periods of low water, particularly east of Vienna, as a complicating factor for freight operations. It also reported that inland navigation accounted for approximately 6% of cross-border freight transport volume along the Austrian Danube corridor, compared with 65% for road and 29% for rail. Annual Report on Danube Navigation in Austria 2025 — viadonau — 2026. viadonau.org
This comparison demonstrates why the number of days when navigation is legally or physically open is insufficient as a measure of transport reliability. A river can remain open while vessels operate with reduced payloads, increased travel times or deteriorating commercial competitiveness. The effect of low-water conditions must be evaluated alongside industrial demand, cargo routing and competing transport services. In Austria, the documented decline in freight despite uninterrupted formal navigation shows that physical accessibility is necessary but does not guarantee commercial activity. For Serbia and the Lower Danube, where hydrological conditions can be more restrictive on particular sections, the distinction is even more consequential.
Containerisation: the missing commercial architecture
The relatively limited role of containerised freight in many Balkan river ports should not be attributed solely to an absence of container cranes or suitable berths. Container transport requires a network of complementary services that differs from the commercial organisation of conventional bulk freight. Scheduled inland-waterway container operations depend on predictable shipment volumes, regular vessel departures, efficient terminal transfers, equipment repositioning, customs procedures and access to shipping-company container inventories. The transport operator must attract enough cargo to sustain a regular service even when demand varies by direction and season. The existence of a modernised terminal is therefore insufficient without a stable commercial network.
The cargo composition of the Danube system explains part of this difficulty. Bulk commodities such as grain, petroleum products, construction materials, metals and industrial raw materials often move in large shipments between identifiable industrial or trading locations. These flows can be compatible with barge transport even where scheduled container networks are weak. Containers, by contrast, serve diverse cargo owners, destinations and shipment schedules. Their competitive value is influenced by service frequency and total transit time as well as freight price. If inland-waterway services offer substantial cost savings but require irregular departures or prolonged dwell times, some cargo owners will continue to prefer road or railway transport.
A viable containerisation strategy therefore requires evidence of commercial demand rather than treating container volume as an automatic consequence of new terminal infrastructure. For each proposed Serbian or Croatian inland terminal, investors should establish the location and volume of potential containerised freight, the frequency of feasible vessel departures, the availability of return cargo, rail and road connections, and the conditions imposed by low-water periods. The available official port statistics support the conclusion that bulk traffic remains significant, but they do not provide a complete harmonised series of container lifts, capacity and utilisation for every facility. It would be inappropriate to invent a numerical regional containerisation rate or describe every river terminal as operating at a specified percentage of capacity without such records.
Measuring structural underutilisation correctly
Underutilisation is a central concern in inland-port development, but it requires a precise definition. Annual tonnes handled divided by a nominal design capacity can be a useful starting indicator when the numerator and denominator refer to the same terminal, commodity mix, operating year and infrastructure perimeter. However, nominal capacity can be misleading if it assumes uninterrupted operation, vessel sizes that are not available under actual water conditions, a particular loading technology or an industrial customer that no longer produces the expected cargo. Capacity may also be shared among cargo categories requiring different equipment and operating arrangements. Theoretical berth productivity is therefore not automatically a valid denominator for financial or operational utilisation.
For decision-grade evaluation, each material port investment should distinguish design capacity, technically available capacity under actual operating conditions, commercially available capacity and realised annual throughput. The difference between these concepts can be substantial. A berth may be physically available but unusable for a particular vessel draught. A storage area may exist but be unavailable for an alternative commodity. A terminal may operate below its nominal capacity because demand is insufficient rather than because navigation is restricted. These distinctions matter because the appropriate policy response changes according to the cause. A physical bottleneck calls for engineering investment; weak demand may require commercial redevelopment or restraint in capital spending; and poor service coordination may be addressed through scheduling, contractual integration or digital information systems.
| Utilisation measure | Definition | Required evidence | Principal limitation |
|---|---|---|---|
| Design capacity | Nominal annual handling capability assumed in the project design | Engineering documents and original investment assumptions | May assume ideal operating conditions |
| Technical available capacity | Handling capability under actual equipment and infrastructure conditions | Maintenance, operating and asset records | Does not establish freight demand |
| Navigationally available capacity | Capacity compatible with vessel draught and fairway restrictions | Daily navigation and draught records | Varies by river section and season |
| Commercially available capacity | Capacity supported by staffing, services, cargo systems and customer access | Operating schedules and commercial contracts | Can change with labour and service availability |
| Actual throughput | Cargo handled during the reporting period | Official port statistics | Does not reveal the underlying capacity constraint |
| Effective utilisation | Actual throughput relative to an appropriately defined available-capacity measure | Reconciled throughput and capacity records | Invalid when denominators are inconsistent |
| Financial utilisation | Revenue and contribution generated relative to the costs of the asset | Audited project accounts | High tonnage does not guarantee adequate returns |
The available evidence establishes considerable variation in throughput, but it does not justify a single numerical utilisation rate for Serbian or Balkan river ports. This evidence gap is material rather than incidental. Without a reliable capacity denominator, a government cannot demonstrate that an additional quay, crane or terminal expansion is needed to accommodate economically credible demand. The relevant investment decision should therefore be supported by an operational-capacity audit before major capital allocations are approved.
The Danube’s geopolitical exposure: Black Sea routes, Ukraine and non-EU corridor integration
The Danube’s transport geography creates significant geopolitical exposure because the Lower Danube and Black Sea form an important interface between inland Europe and maritime trade. The consequences of the war in Ukraine demonstrate that trade routes can change rapidly when port access, security conditions or insurance arrangements deteriorate. Alternative Danube facilities acquired greater importance when Ukrainian maritime exports were disrupted, while subsequent changes in Black Sea access altered the distribution of freight. These developments create both strategic value and commercial uncertainty. Infrastructure that provides an alternative route during a disruption can be important for resilience, but demand generated by exceptional conditions should not automatically be extrapolated into a long-term commercial forecast.
For Serbia, non-membership of the European Union introduces an additional institutional dimension. Serbia participates geographically in transport corridors relevant to the EU’s revised TEN-T framework, including the Rhine–Danube corridor, but its national legislation, customs arrangements and investment responsibilities cannot be assumed to be identical to those of EU member states. The commercial benefits of network integration depend on infrastructure standards, cross-border administrative cooperation, customs efficiency and the practical implementation of transport services. A river corridor can be included in European strategic planning while still requiring separate agreements, financing arrangements and national implementation measures before operational integration is achieved. The applicable EU network framework is established by Regulation (EU) 2024/1679. Trans-European Transport Network Policy and Revised Corridor Framework — European Commission — 2024.
The existence of several international institutions concerned with Danube navigation should also not be confused with unified operational control. The Danube Commission, International Sava River Basin Commission, European Commission, national waterway administrations, customs authorities and port operators have different responsibilities. Each can contribute to navigation safety, technical coordination or transport development, but no single institution automatically controls the complete chain of fairway maintenance, customs clearance, freight scheduling and terminal investment. The effectiveness of international coordination must therefore be assessed through observable operational results, particularly the reliability of cross-border navigation information, the speed of administrative procedures and the implementation of infrastructure commitments.
Croatia, Romania and Serbia: the differentiated investment priorities
The evidence indicates that the three systems require different investment responses. In Serbia, the challenge is to improve the commercial reliability of a river-port economy whose traffic remains concentrated in particular industrial and bulk markets. Investment in additional capacity should be selective and tied to documented demand. In Croatia, the smaller scale and uneven distribution of activity increase the importance of matching infrastructure expenditure to identifiable cargo flows, particularly where cross-border services are necessary. In Romania, the scale of the Lower Danube and Black Sea interface creates substantial strategic value, but extraordinary wartime traffic conditions make long-term demand forecasting more uncertain. Port investment must therefore distinguish commercial freight requirements from infrastructure maintained for resilience and strategic redundancy.
The most defensible regional policy priority is the development of an integrated operating system rather than the uniform expansion of terminals. Such a system would involve reliable hydrographic information, targeted maintenance of critical fairway sections, effective river information services, coordinated border procedures and improved connectivity to industrial customers. Its success should be measured through commercially usable navigation days, cargo carried per vessel, service reliability, transport costs and terminal utilisation. These measures would provide a more accurate assessment of corridor development than the nominal number of modernised ports or the aggregate value of approved infrastructure works.
Chapter 4 — Key judgements and residual evidence gaps
High confidence: Official observations establish considerable volatility in Danube-port traffic, a substantial decline among the selected ports during 2025 and severe low-water exposure on parts of the river. Serbia’s major river ports show divergent performance, reflecting the importance of port-specific cargo markets.
High confidence: The Danube’s economic potential cannot be inferred directly from its geographical continuity. Commercial navigation depends on vessel-loading conditions, infrastructure reliability, industrial demand and the costs of alternative transport modes.
Medium confidence: Targeted investment in fairway reliability, existing industrial freight services and multimodal access is more likely to produce measurable benefits than broad terminal-capacity expansion unsupported by cargo contracts.
Evidence gap: Comparable berth-capacity and utilisation data, Serbian port-level container traffic, commercially available vessel draughts, port-specific cargo composition and reconciled transport costs remain necessary for a defensible ranking of investment opportunities.
What would change the assessment: Sustained increases in freight throughput across multiple Serbian and Croatian ports, supported by improved navigability, diversified cargo composition, regular intermodal services and higher measured asset utilisation, would strengthen the outlook for structural growth. Continued hydrological disruption, industrial concentration and declining terminal activity would reinforce the baseline of selective, uneven development.
Chapter 5. Port Energy Transition: From Announced Capacity to Operational and Financeable Projects
Principal judgement — High confidence. The energy transition of European ports is progressing at different speeds across technologies, and its financial credibility depends on distinguishing regulatory obligations, infrastructure construction, industrial production and commercially sustained operations. Shore-side electricity has one of the clearest regulatory foundations because European legislation specifies infrastructure deployment and vessel-connection requirements for defined categories of maritime traffic. Hydrogen production, hydrogen-derived fuels and carbon-management systems have more heterogeneous investment conditions because their viability depends on industrial customers, production costs, contractual commitments and the completion of interconnected facilities. LNG infrastructure occupies a different position as an established energy-supply technology with a continuing role in maritime and industrial energy markets, but its longer-term investment value is exposed to emissions regulation, fuel-market developments and technological change. For river ports, especially in the Balkans, energy-transition strategies face an additional problem: the commercial scale of their cargo activity may be insufficient to support capital-intensive energy infrastructure without shared industrial demand or public financial support.
The analytical problem is not whether energy-transition technologies are technically possible. It is whether individual projects can progress from policy announcement through engineering, permitting, investment commitment and construction to verified operation at a cost that customers are prepared or required to pay. The most consequential distinction is between installed capacity and economically productive capacity. A commissioned shore-power system may supply little electricity if visiting ships cannot connect or operating tariffs remain unattractive. A hydrogen electrolyser may possess substantial nominal production capacity but operate below its design level because electricity prices are high or customers have not contracted its output. A carbon transport system may be substantially constructed while commercial operations remain delayed by dependencies elsewhere in the project. These outcomes require different policy responses and cannot be grouped together as successful energy infrastructure deployment.
The European regulatory framework: legally defined demand for shore power, but not guaranteed utilisation
Regulation (EU) 2023/1804, commonly referred to as the Alternative Fuels Infrastructure Regulation, establishes specific requirements for shore-side electricity in qualifying maritime and inland ports. Article 9 requires member states to ensure that defined categories of TEN-T maritime ports are equipped by 31 December 2029 to provide shore-side electricity for at least 90% of the relevant qualifying port calls, subject to the regulation’s detailed thresholds and exemptions. For example, a TEN-T maritime port falls within the relevant container-ship provision where its average annual number of qualifying calls over the preceding three years exceeds 100. Separate thresholds apply to relevant passenger-ship categories. Article 10 establishes requirements for at least one shore-side electricity installation at TEN-T core inland-waterway ports by 31 December 2024 and at TEN-T comprehensive inland-waterway ports by 31 December 2029. Regulation (EU) 2023/1804, Articles 9–10 — European Parliament and Council — September 2023. EUR-Lex
The complementary demand-side framework is established by Regulation (EU) 2023/1805, known as FuelEU Maritime. Its Article 6 introduces requirements for relevant container and passenger ships to use onshore power or qualifying zero-emission alternatives while berthed under specified conditions. The European Commission’s guidance states that the applicable connection obligation begins on 1 January 2030 in ports covered by Article 9 of AFIR, with further application from 2035 at ports providing relevant facilities. The legislation includes exceptions and detailed operational conditions; the obligation should not be described as applying indiscriminately to every vessel or every berth. Regulation (EU) 2023/1805 — European Parliament and Council — September 2023; FuelEU Maritime: Regulatory Questions and Answers — European Commission. EUR-Lex+1
This combined framework is economically important because it creates a stronger prospective basis for shore-power demand than voluntary policy announcements alone. However, it does not guarantee commercially attractive utilisation at every installed facility. The number and duration of qualifying vessel calls, the electrical load of each vessel, the timing of connections, the ability of the grid to supply electricity and the costs of operating the system will determine the actual service delivered. A port may satisfy the infrastructure requirement while the operator experiences low utilisation during particular periods. Similarly, meeting a regulatory deadline does not automatically establish that the investment generates sufficient revenue to recover its costs without public support or a regulated service arrangement.
Italy’s cold-ironing programme: financing allocations versus operating infrastructure
Italy provides a particularly revealing example because the scale of public funding is significant and the implementation record contains distinct stages that must not be conflated. Decree-Law No. 59/2021 and its subsequent implementation allocated €700 million under the complementary national investment programme for port electrification. The allocation was distributed across annual budget provisions, with €80 million assigned to 2021, €150 million to 2022, €160 million to 2023, €140 million to 2024, €160 million to 2025 and €10 million to 2026. These allocations establish the financial programme’s original scale and scheduling, but they do not establish that the entire amount had been disbursed to completed and operational installations by the relevant dates. The official legal record is important because budget allocations, financing decrees, procurement awards, certified expenditure and electricity delivered to ships represent different stages of implementation. Italian Cold-Ironing Investment Programme — Official Gazette, Ministerial Decree of 2025. Gazzetta Ufficiale
Italy’s PNRR monitoring framework provides additional detail. The sixth report to Parliament identified a €400 million cold-ironing investment measure under M3C2, Investment 2.3, including infrastructure for supplying electricity at berths and associated grid connections. The report recorded a milestone concerning the award of procurement contracts and a subsequent operational target. It identified a programme involving 24 installations in 16 ports within 10 port-system authorities, while the procurement milestone was supported by awards concerning 20 installations in 13 ports. These figures refer to different aspects of programme implementation and must not be added together. Nor should the €400 million PNRR measure automatically be summed with the €700 million complementary programme without reconciling the formal financing perimeters and possible reallocations. Sixth Report to Parliament on PNRR Implementation, M3C2 Investment 2.3 — Italian Government — 2025. Investimento 2.3: Cold ironing
| Italian cold-ironing indicator | Verified figure or status | Reference | Economic meaning |
|---|---|---|---|
| Complementary national programme | €700 million | 2021–2026 allocation framework | Budget allocation, not equivalent to operational expenditure |
| PNRR M3C2 Investment 2.3 | €400 million | Government monitoring report | Programme financial perimeter requiring reconciliation with other measures |
| Original planned installations identified in report | 24 | Programme implementation | Planned project portfolio |
| Ports in the identified portfolio | 16 | Government report | Geographic distribution of planned works |
| Port-system authorities | 10 | Government report | Implementing institutional perimeter |
| Procurement-awarded installations supporting milestone | 20 | Monitoring report | Procurement progress, not commissioning |
| Ports associated with awarded installations | 13 | Monitoring report | Award-stage geographic coverage |
| Shore-power operating service | Separate concession and commercial arrangements required | 2026 regulatory implementation | Necessary for service delivery and financial sustainability |
| Actual electricity supplied to vessels | No harmonised national figure established here | Evidence gap | Principal operational-performance measure |
The distinction between procurement and operation became politically material in October 2026. A parliamentary question presented in the Italian Senate on 27 October referred to the completion or testing of several installations and raised concerns about the regulatory arrangements governing the award of shore-power services. The parliamentary text also referred to the Ministry’s Decree No. 10 of 22 January 2026, which it described as classifying the service as one of general economic interest and requiring prior identification of appropriate management areas and lead port authorities before concessions could be awarded. These statements establish the content of the parliamentary scrutiny, not an independently verified count of fully operational installations. Nevertheless, they identify a commercially consequential problem: the construction of an electrical installation and the establishment of an entity legally and economically capable of selling electricity to ships are separate implementation requirements. Senate of the Italian Republic, Parliamentary Question No. 4-03476 — 27 October 2026. Senato della Repubblica
Electricity-price support: €570 million is not proof of commercial demand
The European Commission approved an Italian state-aid scheme with a total budget of €570 million for reducing general electricity-system charges associated with shore-side electricity supplied to ships. The decision, adopted on 17 June 2024 under case SA.105117, identifies an annual budget of €57 million and a duration extending to 31 December 2033. Its objective is environmental protection through a reduction in the financial burden associated with using electricity while ships are berthed. This is a materially different form of support from the financing of physical berth-electrification infrastructure. The former influences the operating economics of electricity consumption; the latter contributes to the capital cost of the installation. State Aid SA.105117, Italian Aid Scheme for Shore-Side Electricity — European Commission — June 2024. EUR-Lex
The distinction is essential for investment analysis. A publicly funded shore-power installation may have relatively low construction-cost exposure for its operating concessionaire, but its revenues remain dependent on the electricity actually supplied to ships and the terms governing service charges. Reducing system charges can improve the competitiveness of shore power relative to onboard electricity generation, but it cannot independently guarantee vessel calls, electrical demand, grid reliability or appropriate commercial arrangements. Moreover, state-aid approval establishes that a scheme is legally authorised under the applicable decision; it should not be treated as evidence that the entire approved budget has been disbursed or that all qualifying users have received the maximum possible benefit.
The effect on a commercial project depends on who ultimately benefits from the support and how the charges are allocated among electricity suppliers, port-service operators and shipping companies. If the support reduces prices paid by shipowners, it may strengthen demand for shore-power connections. If operating concessions remain uncertain or network charges are high, the overall commercial effect may be smaller than the nominal programme value suggests. The most useful indicators would be the delivered electricity price, the number of vessel connections, the average electrical load, annual megawatt-hours sold and the proportion of costs recovered through commercial revenues. Without these data, claims of success based solely on the existence of the €570 million programme would be premature.
Cold-ironing economics: capacity, connection frequency and service revenue
The financial structure of shore power is closely linked to utilisation. The infrastructure requires an electricity connection, transformers and conversion equipment, appropriate safety and control systems, berth-level electrical equipment and arrangements for connecting vessels. Depending on the installation, a significant part of capital expenditure may be incurred before substantial revenues are generated. Operating costs include electricity procurement, distribution charges, maintenance, technical personnel and administrative expenses. A commercially successful installation must generate sufficient electricity sales or contractually secured payments to cover the costs assigned to its operator, while satisfying the regulatory obligations applicable to the service.
The scale of the utilisation problem can be illustrated through a transparent hypothetical example. Assume a shore-power facility possesses an available connection capacity of 20 MW. If it operates at the equivalent of full capacity for 1,000 hours annually, it supplies 20,000 MWh. At 2,500 equivalent full-load hours, it supplies 50,000 MWh. At 4,000 hours, it supplies 80,000 MWh. These are not reported operating outcomes for any European port; they are engineering calculations showing the relationship between installed capacity, connection demand and delivered electricity. A higher installed-capacity figure is not evidence of greater environmental or financial benefit unless electricity is actually supplied under suitable conditions.
| Illustrative shore-power facility | Assumption or result |
|---|---|
| Available power connection | 20 MW |
| Equivalent full-load hours — low case | 1,000 h/year |
| Electricity delivered — low case | 20,000 MWh/year |
| Equivalent full-load hours — intermediate case | 2,500 h/year |
| Electricity delivered — intermediate case | 50,000 MWh/year |
| Equivalent full-load hours — high case | 4,000 h/year |
| Electricity delivered — high case | 80,000 MWh/year |
| Maximum theoretical annual output at continuous full load | 175,200 MWh/year |
Illustrative calculation: electricity delivered equals available power multiplied by equivalent full-load hours. It does not account for maintenance, conversion losses, grid restrictions or vessel-connection availability.
These calculations demonstrate why the commercial assessment of shore power should focus on delivered energy rather than nominal electrical capacity alone. Two installations of identical rated power can produce very different annual revenues if one serves regular container or passenger traffic and the other experiences irregular calls or long periods without connections. Public authorities should therefore assess each proposed installation against qualifying vessel traffic, berth occupancy, actual auxiliary-power requirements and the expected cost of electricity delivery. The presence of a legal obligation increases the probability that the technology will be used, but it does not remove the need for a detailed operating model.
Port energy communities: institutional potential and the limits of physical electricity sharing
Port energy communities are frequently presented as instruments for lowering energy costs, increasing local renewable generation and integrating industrial electricity demand. Their potential relevance arises from the geographical proximity of electricity users, available industrial surfaces and possible renewable generation sites. In principle, collective arrangements may support local production, consumption coordination and investment in distributed electricity infrastructure. However, the legal and economic feasibility of a particular energy-community structure depends on the applicable national framework, the participating entities, grid arrangements, eligibility requirements and the method through which electricity and associated benefits are allocated.
Ports create additional complexities because their participants may include public authorities, private terminal operators, industrial companies, utilities and commercial service providers with different electricity consumption profiles. A terminal operator may require intermittent high electrical capacity, while an industrial facility may have relatively continuous demand. A shore-power installation may experience concentrated demand during vessel calls. Local renewable generation may not coincide temporally with these loads, creating continuing dependence on the external grid. The term energy community should therefore not be used as a substitute for an analysis of electricity balancing, network charges, contractual responsibilities and the financial position of the participating entities.
The economic case is strongest where participants possess complementary demand profiles, legally workable sharing arrangements and a credible plan for generation and storage. It is weaker where the project relies mainly on nominal installed renewable capacity without establishing when electricity will be produced, who will consume it and how the financial benefits will be distributed. The appropriate measure of success is not the number of communities announced, but the electricity actually generated and consumed under the relevant arrangements, the resulting cost savings and the durability of the contractual structure.
Hydrogen valleys and electrolysers: the gap between nominal production capacity and industrial demand
Hydrogen projects introduce a more complex financial structure than shore-side electricity because they require production infrastructure, electricity supply, potentially water treatment, compression or conversion, storage, distribution and identifiable customers. The cost of hydrogen produced through electrolysis is strongly influenced by electricity expenditure, equipment utilisation, capital cost and the additional infrastructure needed to deliver the product. These variables interact. A low-cost electricity contract may improve production economics, but restricted operating hours can reduce electrolyser utilisation and increase the capital cost allocated to each kilogram of hydrogen. Conversely, high utilisation may be technically achievable but commercially unattractive when electricity prices are elevated.
For a simple engineering illustration, a 100 MW electrolyser operating for 4,000 equivalent full-load hours annually consumes 400,000 MWh of electricity. If the assumed electricity requirement is 52 kWh per kilogram of hydrogen produced, output would be approximately 7,692 tonnes of hydrogen annually, before adjustments for availability and additional system losses. At 2,000 operating hours, output would fall to approximately 3,846 tonnes under the same assumption. These are hypothetical engineering calculations, not reported results for any European hydrogen valley. They demonstrate the sensitivity of output to operating hours and the importance of distinguishing electrical capacity from actual hydrogen production.
| Illustrative electrolyser variable | Lower utilisation | Higher utilisation |
|---|---|---|
| Installed electrical capacity | 100 MW | 100 MW |
| Equivalent full-load hours | 2,000/year | 4,000/year |
| Electricity consumed | 200,000 MWh | 400,000 MWh |
| Assumed electricity requirement | 52 kWh/kg H₂ | 52 kWh/kg H₂ |
| Calculated hydrogen output | Approximately 3,846 t/year | Approximately 7,692 t/year |
| Electricity cost at hypothetical €60/MWh | €12m/year | €24m/year |
| Electricity expenditure per kilogram | Approximately €3.12/kg | Approximately €3.12/kg |
The electricity expenditure excludes electrolyser capital recovery, network charges, maintenance, labour, water treatment, compression, storage, transport, financing and any other project expenses. The assumed price and efficiency are illustrative, not current port-specific market quotations.
The calculation reveals why nominal hydrogen capacity is an inadequate measure of economic progress. The electricity input alone can represent a substantial production expense before the capital and operating costs of the remaining system are included. A financially credible hydrogen project therefore requires more than a grant award or a procurement contract for electrolysers. It requires a realistic electricity procurement arrangement, a defined operational profile, appropriately structured financing and a customer willing to purchase the output under economically sustainable conditions. Where hydrogen is intended for conversion into ammonia or synthetic fuels, additional equipment, energy losses and production costs must be included. The resulting fuel may be technically feasible yet commercially unattractive without specific demand obligations, carbon-related pricing mechanisms or other policy support.
Rotterdam and Porthos: advanced project development does not eliminate execution risk
The Porthos carbon transport and storage project provides a particularly important empirical example because it has progressed well beyond the stage of general policy announcement. The project is designed to transport carbon dioxide captured from industrial facilities in the Rotterdam port area and store it in depleted gas reservoirs beneath the North Sea. It involves several technically interdependent components, including industrial capture arrangements, a transport pipeline, compression infrastructure, injection wells and offshore storage. Its planned injection capacity is approximately 2.5 million tonnes of CO₂ annually, a substantial industrial-scale undertaking rather than a limited laboratory demonstration.
The project’s official April 2026 announcement revised its implementation schedule. Porthos stated that operations were not expected to commence before the second half of 2027, replacing an earlier anticipated start by the end of 2026. The developer attributed the revised timetable to the interdependence of project components and longer material-delivery periods, rather than identifying one isolated cause. It reported that the pipeline across the Rotterdam port area and beneath the seabed had been completed, the injection wells had been converted and construction of compressor-station buildings was well advanced. These are substantial implementation milestones, but they do not establish that commercial injection had commenced. Schedule for the Porthos CO₂ Transport and Storage Project Revised — Porthos — April 2026. Porthos
The significance extends beyond carbon storage. Porthos demonstrates that a technically advanced and institutionally supported project can encounter delays because its elements must be delivered and commissioned as an integrated system. The financial consequences depend on the allocation of delay risk, contractual payments, financing arrangements and the obligations of industrial customers. The public announcement does not disclose enough information to quantify the project’s additional financing costs or determine which party bears each delay-related expense. It does, however, establish the inadequacy of treating an advanced construction milestone as an operational outcome.
The experience is relevant to Mediterranean ports contemplating shared energy infrastructure. A dedicated investment vehicle may improve coordination, but it cannot eliminate dependencies among industrial customers, utility networks, storage facilities and external contractors. The stronger institutional model is one in which those dependencies are identified before financial close, construction responsibilities are contractually allocated and the project’s operating timetable is supported by a realistic assessment of technical interfaces.
LNG and fossil-energy infrastructure: residual commercial functions under transition uncertainty
The future role of LNG and other conventional energy infrastructure requires a more differentiated analysis than a simple assumption of rapid replacement. Ports remain essential for the import, storage, redistribution and handling of energy commodities consumed by industries, power systems and vessels. LNG infrastructure can provide established commercial services where demand exists and where the facilities are integrated with national energy networks. Nevertheless, long-duration investment decisions must account for evolving emissions regulation, competing fuels, utilisation uncertainty and the potential divergence between near-term energy-security requirements and long-term decarbonisation objectives.
The commercial economics of LNG facilities differ from those of hydrogen production or shore-power infrastructure. An LNG import facility may receive revenues through capacity reservations, terminal services or associated contractual arrangements, while an electrolyser depends on producing and selling hydrogen at a viable cost. A shore-power operator sells an electricity service to vessels subject to specific technical and regulatory requirements. These distinctions matter because the mechanisms that support financeability are different. A long-term LNG capacity contract may provide revenue visibility even if actual throughput varies, while a hydrogen project without committed customers may face substantial demand risk despite receiving public support.
The residual role of fossil fuels should therefore be assessed through existing demand, industrial production, energy-security requirements and the economic lives of installed assets. It would be methodologically unsound to assume either that LNG infrastructure becomes commercially obsolete by 2030 or that current utilisation necessarily persists throughout the full life of a new asset. For each investment, the appropriate analysis should examine contracted capacity, expected throughput, tariff arrangements, conversion possibilities and the financial consequences of future demand decline. A facility described as adaptable to alternative fuels should not be assigned a positive conversion value without engineering evidence and a credible estimate of the additional investment required.
Energy-import terminals and hydrogen derivatives: distinguishing shared infrastructure from product-specific investment
The development of multi-energy port systems is often presented as a logical extension of existing maritime energy infrastructure. In practice, the economic benefits of shared infrastructure are constrained by technical compatibility. Different energy carriers require different handling temperatures, pressures, materials, storage conditions and safety arrangements. Infrastructure developed for conventional petroleum products cannot automatically be used for ammonia, hydrogen or other energy carriers without engineering modifications and regulatory approvals. Similarly, a port may possess available industrial land and pipeline corridors but lack sufficient electricity capacity, water supply or external distribution infrastructure to support a proposed production or import facility.
The financial significance of these constraints is substantial. A proposed hydrogen-import terminal may require investments extending well beyond the maritime installation, including storage, conversion, distribution and industrial customer connections. If downstream infrastructure is delayed, the maritime facility may remain underutilised. If upstream production costs increase, the delivered energy product may become commercially unattractive. If industrial customers postpone conversion to new fuels, the anticipated demand may not emerge on schedule. The project should therefore be evaluated as an integrated supply chain with multiple contractual dependencies rather than as a stand-alone terminal investment.
Dedicated project companies may help organise this structure by separating the financial risks of individual facilities from those of the wider port authority. However, a project company does not create demand or eliminate technical risk. Its usefulness depends on shareholder capital, debt arrangements, contracts with customers and clear responsibilities for construction and operation. Public ownership or participation can support infrastructure serving collective purposes, but should not obscure the commercial exposure associated with industrial production and fuel markets.
The Balkan river-port energy transition: scale, economics and prioritisation
The energy transition of Balkan river ports presents different priorities from those of large maritime industrial clusters. The annual throughput of many individual river terminals is substantially smaller than that of major European seaports, and their cargo composition is concentrated in bulk and industrial commodities. This affects the commercial viability of electricity infrastructure, alternative-fuel supply and industrial energy projects. A port serving relatively few vessels cannot automatically justify the same fixed investment as a terminal handling a large and regular flow of maritime traffic. Infrastructure expenditure must therefore be calibrated to identifiable electricity demand, vessel activity and industrial customers.
For inland-waterway vessels, shore-side electricity can reduce the need for onboard auxiliary generation while vessels are berthed. Article 10 of AFIR establishes infrastructure obligations for EU TEN-T inland ports, but the existence of an installation does not guarantee high annual utilisation. A river terminal with irregular vessel calls may experience substantial variation in demand. This increases the importance of matching electrical equipment to actual operating patterns and exploring whether the same connection can serve compatible port or industrial electricity loads. Such arrangements require detailed technical and commercial analysis, particularly where electrical capacity is limited or network charges are material.
Hydrogen and other alternative fuels may have potential applications in inland navigation and port-related industry, but the evidence does not support treating large-scale production or bunkering as an inevitable near-term development throughout the Balkan river network. A credible project would require a defined fleet or industrial customer base, a suitable supply chain, safety arrangements, commercially acceptable fuel costs and sufficient demand to justify the fixed infrastructure. The investment case may be stronger where energy services can support several industrial activities than where they depend exclusively on an uncertain future fleet of alternative-fuel vessels.
For Serbia, non-EU regulatory status adds an implementation consideration. European regulations influence corridor development and the technical expectations of operators participating in international transport, but an EU legal obligation should not automatically be described as directly binding every Serbian river port in the same manner as an EU member-state port. National legislation, international agreements and actual project arrangements determine the operative responsibilities. Investment strategies should therefore distinguish between compliance obligations, voluntary alignment with European standards and commercial reasons to adopt particular technologies.
Comparative investment-stage audit: energy projects and infrastructure classes
The following matrix distinguishes the investment stages supported by the evidence from conditions that remain necessary for a project to generate sustained commercial output. It deliberately avoids converting announced or planned capacities into fictitious operating volumes.
| Infrastructure or project | Verified status or regulatory position | Main remaining commercial dependency | Principal execution risk | Confidence |
|---|---|---|---|---|
| EU maritime shore power | Binding AFIR infrastructure requirements for qualifying ports; FuelEU Maritime connection requirements | Electricity price, vessel compatibility, delivered MWh | Grid connection and commercial operation | High |
| EU inland-port shore power | AFIR Article 10 defines installations at qualifying TEN-T inland ports | Vessel calls and actual electricity consumption | Limited utilisation at smaller ports | High |
| Italian cold-ironing programme | Public financing allocations and documented procurement milestones | Operating concessions, electricity sales, tariffs | Delay between construction and service operation | High |
| Italian shore-power electricity-charge support | €570m state-aid scheme approved through 2033 | Application of support and actual electricity purchases | Tariff and implementation uncertainty | High |
| Port energy communities | Potential organisational and commercial model | Eligible participants, demand matching and grid arrangements | Weak savings or unsuitable electricity profiles | Medium |
| Rotterdam Porthos | Advanced construction; operational start revised to no earlier than H2 2027 | Integrated commissioning and subsequent operation | Technical-interface and schedule risk | High |
| Industrial electrolysers | Project-specific development; nominal capacity not equal to output | Electricity costs and binding hydrogen offtake | Underutilisation and cost escalation | High for the mechanism |
| Hydrogen valleys | Heterogeneous project maturity | Integrated production, customers and distribution | Failure to achieve commercial scale | Medium |
| LNG facilities | Established technology with project-specific commercial use | Contracted capacity and long-term energy demand | Future utilisation and emissions-policy exposure | High for the mechanism |
| Hydrogen-derived fuel terminals | Technology- and commodity-specific development requirements | Product supply, storage, conversion and customers | Complex integrated supply-chain delivery | Medium |
| Serbian river-port alternative-energy services | Commercial-scale deployment not established in the cited evidence | Fleet demand and industrial users | Insufficient operating scale | Medium |
| Croatian and Romanian inland-port energy projects | EU framework applies to relevant qualifying ports | Project-level financing and actual service demand | Uneven deployment and utilisation | Medium |
The matrix should not be interpreted as a ranking of the environmental merits of the technologies. It measures the maturity of the observed implementation framework and the principal conditions affecting commercial viability. A technology can offer substantial environmental benefits while remaining financially unattractive under present market conditions. Conversely, commercially established infrastructure can remain exposed to substantial long-term policy or demand risk.
The financing problem: who should bear the commercial risk?
Energy infrastructure located within ports often produces benefits for multiple parties, which complicates the allocation of investment responsibility. A shore-power installation may benefit the port community through reduced local emissions, while the direct electricity customer is the ship operator. A hydrogen pipeline may be valuable to several industrial producers, but its commercial revenue depends on the quantities transported under enforceable contracts. A carbon-management network can provide a shared service while relying on industrial emitters to deliver sufficient volumes. These structures create potential grounds for public participation, particularly where benefits are not fully captured by private revenues, but the justification for such support must remain explicit.
Public finance is most defensible when it addresses a clearly identified infrastructure or coordination problem that private parties cannot efficiently resolve on their own. Such investments may include shared grid connections, access infrastructure, navigation safety, common utility corridors or facilities providing broader environmental benefits. Private capital is generally better positioned to evaluate commercially specific production, processing and customer-demand risks when the necessary contractual and regulatory conditions are available. These boundaries are not absolute; joint ventures, concession structures and mixed financing may be appropriate. The central requirement is that each party’s financial exposure reflects the responsibilities and risks it can manage.
A recurring danger is that public spending may finance infrastructure whose productive use depends on additional private investments that never reach financial close. The result can be an installation that is technically complete but commercially inactive. Avoiding this outcome requires an integrated investment timetable, with binding milestones for customer commitments and complementary infrastructure. It also requires transparency over capital expenditure, operating subsidies and long-term maintenance obligations. The cost of an energy-transition project cannot be evaluated solely through its construction budget when the public sector may also bear continuing operating or revenue-support responsibilities.
The indicators that distinguish policy success from physical completion
A rigorous monitoring system should classify projects by their actual stage of development and require different evidence at each stage. Announcements should be supported by identified sponsors and technical objectives. Approved projects should possess the necessary planning and regulatory permissions. Financially committed projects should have disclosed investment responsibilities and credible financing arrangements. Commissioned projects should be technically accepted and capable of providing the intended service. Operational projects should report actual output, utilisation and reliability. Commercially sustainable projects should demonstrate the revenues or legally authorised support mechanisms necessary to maintain operations.
| Project stage | Required documentary evidence | What the stage establishes | What it does not establish |
|---|---|---|---|
| Announced | Official project declaration | Intent to develop | Financing or operational capability |
| Feasibility completed | Technical and economic assessments | Defined project concept | Final commercial viability |
| Authorised | Applicable permits and approvals | Legal permission to proceed | Funding or construction |
| Financially committed | Binding equity, debt or public financing decisions | Investment capital committed | Completed infrastructure |
| Under construction | Verified physical progress and contracts | Construction activity | Commissioned service |
| Commissioned | Technical acceptance and operational authorisations | Facility capable of operation | Sustained utilisation |
| Operational | Metered output or delivered services | Actual service provision | Full cost recovery |
| Commercially sustainable | Audited revenues, contracts, costs and financing performance | Evidence of continued financial viability | Immunity from future market change |
This classification is especially important for projects whose expected completion dates are incorporated into national decarbonisation plans. A target expressed in megawatts, tonnes of hydrogen or annual carbon-storage capacity should be attributed to the appropriate development stage. Combining operational output with announced future capacity would overstate implementation progress. Likewise, measuring the success of shore-power programmes through awarded public contracts rather than delivered megawatt-hours would risk confusing administrative compliance with the environmental and economic outcomes the investment was intended to produce.
Chapter 5 — Key judgements and residual evidence gaps
High confidence: EU legislation provides a materially stronger regulatory foundation for shore-side electricity than exists for many project-specific hydrogen or carbon-management investments. The requirements are legally defined, but their financial and environmental effectiveness depends on operational delivery and utilisation.
High confidence: Italy has allocated substantial public resources to cold ironing, and official records identify procurement progress. Those facts do not establish that every financed installation is commercially operating or delivering electricity at economically sustainable tariffs.
High confidence: Porthos demonstrates that advanced industrial energy infrastructure remains exposed to technical-interface and construction-schedule risks. The revision of its expected operational date to no earlier than the second half of 2027 is material to any assessment of deployed carbon-storage capacity.
Medium confidence: Hydrogen and energy-community projects can contribute to port decarbonisation where electricity supply, industrial demand, infrastructure integration and investment contracts are sufficiently developed. Their commercial prospects cannot be established through nominal installed capacity or political designation alone.
Medium confidence: Smaller Balkan river ports are more likely to benefit initially from appropriately scaled electrification and industrially supported energy services than from speculative large-scale alternative-fuel infrastructure unsupported by documented demand.
What would change the assessment: Verified annual electricity deliveries to ships, sustained high utilisation of operational electrolysers, binding industrial hydrogen purchases, commercially operating carbon-management networks and audited project financial performance would strengthen the outlook for scaled deployment. Persistent delays, uncontracted production capacity, weak electricity demand and recurring operating subsidies without corresponding service utilisation would weaken it.
Open official record: Port-by-port electrical connection capacity and grid activation; actual annual shore-power electricity sales; service-concession terms; electrolyser operating hours and hydrogen production; industrial offtake agreements; carbon dioxide transported and injected; public support disbursements; and audited operating costs for energy facilities in maritime and inland ports.
Pillar II — Integrated Operational and Energy Assessment
The evidence assembled for the Balkan–Danube network and European port-energy investments identifies two distinct forms of infrastructure risk that increasingly interact. Inland navigation is vulnerable when physical capacity cannot be relied upon under changing water conditions or when commercial freight flows shift away from river transport. Energy infrastructure is vulnerable when announced or installed capacity cannot be converted into sustained output because complementary facilities, customer demand or operating arrangements are incomplete. In both cases, the economic problem arises from a difference between theoretical capability and dependable service delivery. A river terminal can possess modern handling infrastructure yet remain commercially unattractive during periods of restricted vessel loading. A shore-power installation can possess substantial electrical capacity yet generate little revenue until ships connect and purchase electricity. A carbon-management network can be physically advanced while remaining unavailable for commercial injection. These are not equivalent operational problems, but they share a common requirement for project evaluation: capital expenditure must be assessed against the quantity, reliability and economic value of the service ultimately delivered.
The Danube data provide especially strong evidence against extrapolating commercial growth from geographical potential. Among the selected major ports, 2025 handling fell by 22.8%, while individual Serbian ports displayed sharply different trajectories and severe low-water conditions were recorded on the Bulgarian section. These observations establish the importance of climate resilience and demand diversification, but they also demonstrate why annual declines cannot be assigned exclusively to drought. The energy evidence provides a parallel warning. Italy’s cold-ironing programmes and state-aid arrangements show substantial public commitment, while Porthos illustrates advanced industrial development accompanied by a consequential delay. Neither type of evidence should be interpreted as proof of realised commercial output before operational statistics are available.
The forward implication is differentiated rather than uniform. For the Danube, the most consequential improvements are likely to involve the reliability of navigation, commercially useful multimodal connections and infrastructure matched to identifiable cargo demand. For maritime energy systems, the essential requirement is integration between facilities, electricity networks, operators and paying customers. Across both domains, new public spending is most valuable when it resolves a documented constraint on productive activity. Projects that expand theoretical capacity without addressing those constraints risk producing financially burdensome assets whose operational contribution remains below the level anticipated in their original investment plans.
Pillar III — Reform Choices, Financial Resilience and Strategic Outlook
Chapter 6. Governance Reform and Investor Certainty: The State as Regulator, Enabler or Operator
Principal judgement — High confidence. The most consequential reform available to European port systems is not the replacement of public institutions with private corporations, nor the concentration of investment powers within a new national authority. It is the creation of a legally enforceable framework in which commercial rights, infrastructure obligations, financing commitments and risks are aligned over the economic life of individual assets. The distinction between the state as operator, regulator and investment enabler is therefore best understood as a question of institutional responsibility rather than public ownership. A state can retain ownership of strategic maritime land, navigation infrastructure and essential transport connections while allowing private operators to assume the commercial risks associated with terminal operations, industrial facilities and specialised energy services. Conversely, a publicly owned commercial corporation can participate effectively in infrastructure development when it possesses appropriate financial autonomy, accountable management, recurrent revenues and transparent relations with public shareholders. Neither arrangement eliminates the need for competition safeguards, environmental obligations, contractual discipline or fiscal scrutiny. The decisive factor is whether an investor can determine, before committing capital, which authority will deliver each essential component, when operations may commence, which commercial rights will remain enforceable, how unforeseen regulatory changes will be treated and whether the projected revenues can support financing throughout the asset’s operating life.
The legal distinction between contractual protection and an unconditional right to operate
The European concession framework imposes a more demanding test than simply matching the nominal concession period to an engineering estimate of asset life. Article 18 of Directive 2014/23/EU states that concession duration must be limited and that, for concessions exceeding five years, the maximum duration cannot exceed the period reasonably expected for the concessionaire to recover the investments undertaken in operating the works or services together with a return on invested capital. The calculation must consider both initial investments and investments made during the concession. This provision is especially important for port infrastructure because concession duration cannot legitimately be extended indefinitely merely to make a weak business model financially attractive. The applicable legal assessment must also consider whether a particular port-land or operational arrangement falls within the directive’s scope, since not every maritime-land authorisation is necessarily a concession contract governed by the directive. The legal distinction must be resolved before its duration principles are applied to an individual project. Directive 2014/23/EU on the Award of Concession Contracts, Article 18 — European Parliament and Council — February 2014. EUR-Lex
This framework has two implications that are frequently overlooked in infrastructure debates. First, the investment recovery period must be established through a defensible financial assessment, not through an arbitrary political preference for concessions of 20, 30 or 40 years. Second, contractual protection should not be confused with the absence of public oversight. A long-duration concession may remain subject to enforceable performance obligations, environmental requirements, competition rules and appropriately designed contractual modification mechanisms. The objective is not to remove the state’s capacity to regulate. It is to prevent changes in public requirements, infrastructure delivery or contractual responsibilities from creating unallocated financial exposures that discourage otherwise viable investments. A sophisticated concession should therefore provide a clear investment programme, measurable service obligations, procedures governing material changes, lawful termination arrangements and transparent rules for the treatment of capital expenditure that remains unrecovered when the contract ends.
The importance of these provisions becomes greater when an investment combines assets with different lifetimes. A modern terminal development can involve civil works, handling equipment, buildings, digital infrastructure, energy facilities and external transport connections. Each component has its own depreciation schedule, replacement cycle and operating risk. The concession’s economic duration must account for the interaction between these assets rather than assuming that the life of the longest-lived physical structure determines the appropriate contractual term. Similarly, a concessionaire may undertake additional investments during the life of the contract to comply with new environmental requirements or accommodate changes in shipping technology. The contract must establish how such investments are authorised, valued and treated within the remaining concession period. Without a transparent mechanism, investors may defer necessary modernisation because the remaining commercial term does not support an adequate return.
The financial consequences of permitting delays: evidence from European transport megaprojects
The strongest recent evidence that administrative and project-execution delays have material economic consequences comes from the European Court of Auditors. Its Special Report 02/2026, published on 19 January 2026, updated an earlier examination of eight major transport infrastructures supporting the trans-European network. The auditors found additional implementation delays and concluded that the 2030 completion deadline for the EU core network would not be met. For five projects with sufficient information, the average delay had increased by a further four years since the previous review, reaching an average of 17 years relative to the original implementation plans. The report also identified continuing cost increases, weaknesses in coordination and limitations in the effective use of cost-benefit analysis. This evidence does not measure the average delay of European port investments specifically, but it provides an authoritative warning about the risks affecting large transport infrastructures on which maritime gateways and inland corridors depend. Special Report 02/2026: EU Transport Infrastructure — European Court of Auditors — January 2026. European Court of Auditors
The audit’s project-level evidence illustrates the scale of the problem. The Lyon–Turin rail connection, of particular relevance to transalpine freight connectivity, had an original estimated opening year of 2015 and a revised estimated opening year of 2033, representing an 18-year delay against the original plan. The Brenner Base Tunnel, relevant to major North–South transport movements, had an original estimated opening year of 2016 and a revised estimated opening year of 2032, a 16-year delay. These are not port projects, and their costs or construction schedules should not be used to estimate the cost of a port concession. Their relevance is systemic: maritime gateway investments depend on external transport infrastructure whose delivery may fall outside the control of the port authority or terminal operator. Where the business case for a terminal expansion depends on an external rail project, the investor’s exposure includes the possibility that the terminal becomes operational long before the connecting infrastructure is ready. European Court of Auditors, Special Report 02/2026, Table 2: Delays Affecting Major Transport Infrastructures — January 2026. European Court of Auditors
| Audited infrastructure | Original planned opening | Revised opening estimate, November 2025 | Delay against original plan | Relevance to port investment |
|---|---|---|---|---|
| Lyon–Turin rail connection | 2015 | 2033 | 18 years | Transalpine freight connectivity and corridor sequencing |
| Brenner Base Tunnel | 2016 | 2032 | 16 years | North–South rail capacity and inland market access |
| Five projects with comparable delay information | Varying original dates | Varying revised dates | 17-year average delay | Systemic exposure to infrastructure execution risk |
The five-project average is an audit finding, not a statistical estimate for every European transport or port project. Source: European Court of Auditors — Special Report 02/2026, 19 January 2026.
This evidence has an immediate consequence for concession design. Where a private terminal investment depends on publicly financed rail infrastructure, the financial model should not assume that both facilities become operational simultaneously unless their delivery schedules and responsibilities are adequately secured. A terminal operator cannot manage the construction risks of a railway project controlled by another institution. The allocation of risk should therefore recognise the limits of each party’s authority. A public authority may be better positioned to assume certain interface risks associated with publicly controlled infrastructure, while a terminal operator should normally remain responsible for its own equipment, operating performance and commercially manageable construction obligations. If these risks are transferred indiscriminately to the private party, investors may demand greater expected returns, reduce the scale of their proposed investments or decline participation.
Fixed procedural timelines: what European law already provides
The principle of time-limited infrastructure authorisation is not merely a proposed administrative innovation. Directive (EU) 2021/1187 establishes measures to streamline the realisation of the trans-European transport network. Article 5 requires member states to provide a permit-granting procedure whose duration should not exceed four years from the start of that procedure, subject to the directive’s specified legal qualifications and exceptions. The period does not include time required for administrative and judicial appeals or the implementation of resulting decisions. The instrument also provides a framework for identifying a designated authority and coordinating relevant procedures. Consequently, an assertion that Europe has no legal basis for fixed authorisation timelines would be incorrect. The more important issue is whether the framework applies to the project concerned and whether national implementation achieves predictable outcomes in practice. Directive (EU) 2021/1187 on Streamlining Measures for Advancing the Realisation of the TEN-T — European Parliament and Council — July 2021. EUR-Lex
The legal existence of a deadline must be distinguished from an enforceable guarantee of project completion. The four-year rule relates to the defined permit-granting procedure, not to the entire period between the initial project concept and the beginning of commercial operations. Preliminary planning, financial structuring, procurement, judicial disputes, construction and commissioning can extend beyond the formal authorisation window. Moreover, complex projects frequently involve several interdependent permissions and separate environmental requirements. A single coordinating authority may improve procedural transparency without having the legal power to override every other competent institution. For investors, the effective value of a fixed timeline depends on clarity regarding the beginning and end of the procedure, the documents required, the treatment of incomplete applications, the circumstances permitting an extension and the remedies available when deadlines are not respected.
A credible procedural reform should therefore operate through an integrated investment timetable rather than a nominal maximum number of days. The timetable should identify the legal authority responsible for each approval, the documents required from the developer, the deadline for administrative action, the conditions under which further information may be requested and the consequences of delays. Environmental review and judicial protection must remain effective, but investors should be able to distinguish the time required for substantive scrutiny from administrative inactivity or repeated requests for substantially identical information. The objective is to improve predictability without substituting procedural shortcuts for valid technical and environmental assessment.
The appropriate division of public and private responsibilities
The distinction between public infrastructure and private commercial investment is particularly important in ports because different assets generate different types of economic benefit. Navigation channels, maritime safety facilities and common access infrastructure often support multiple operators and may generate substantial public benefits that cannot be recovered efficiently through direct user charges. Cargo-handling equipment, specialised storage, processing facilities and other commercially specific assets may generate identifiable revenues and can therefore be financed through private operators when the contractual conditions are suitable. Energy infrastructure occupies an intermediate position: shared electricity connections, pipeline corridors and certain network facilities can provide collective benefits, while hydrogen production, fuel processing and industrial conversion projects may be more directly linked to commercial customers.
The allocation of responsibilities should follow economic characteristics rather than an inflexible ideological preference for either public or private ownership. Public financing may be justified when benefits are widely distributed or when essential infrastructure would otherwise be underprovided. Private financing becomes more appropriate when services have identifiable customers, revenues are reasonably predictable and operators can manage the associated risks. However, assigning an asset to the private sector is not equivalent to transferring all its underlying risks. If the state requires a terminal operator to construct a facility whose revenue depends on public rail infrastructure that may be delayed indefinitely, the private concession may remain economically unattractive. Conversely, placing every investment responsibility on the public authority can weaken commercial discipline and expose taxpayers to demand risks that private operators are better equipped to assess.
A sound division of responsibilities therefore requires a project-specific analysis of risks and financing. The concession or investment agreement should identify the assets involved, their ownership, expected revenues, operating obligations, maintenance arrangements and eventual transfer or termination provisions. Infrastructure shared among several users may require transparent access and charging arrangements. Where a project receives public support, the financial structure should identify the benefit being purchased or the market failure being corrected. These requirements are consistent with the broader European emphasis on transparent port financing and economic accountability under Regulation (EU) 2017/352. Regulation (EU) 2017/352 Establishing a Framework for the Provision of Port Services and Common Rules on the Financial Transparency of Ports — European Parliament and Council — February 2017.
Contractual risk allocation: an operational framework for long-duration port assets
The commercial outcome of a port investment can depend more strongly on risk allocation than on the formal ownership of the infrastructure. Construction risk, demand risk, regulatory risk, environmental risk, financing risk and climate risk have different economic characteristics and should not automatically be assigned to one party. A private operator normally has greater control over equipment procurement, personnel management and terminal productivity than over the delivery of a national railway line. A public authority may have legal authority over planning and infrastructure interfaces but cannot guarantee that a shipping company will continue calling at a terminal or that an industrial customer will remain commercially viable. The contract must recognise these distinctions.
| Risk category | Typical event | Party best positioned to manage the risk | Potential contractual instrument | Main failure mechanism |
|---|---|---|---|---|
| Terminal construction | Cost overrun or contractor delay | Project company and construction contractor | Fixed-price or appropriately structured construction contract | Cost escalation and delayed revenues |
| Public access infrastructure | Rail, road or maritime access not ready | Competent public infrastructure authority | Interface agreement and binding delivery milestones | Commercial facility completed before access infrastructure |
| Commercial demand | Lower cargo volumes or customer demand | Operator and commercial investors | Minimum-volume contracts, diversified customers, prudent financing | Insufficient cash flow |
| Regulatory change | Material change in legally applicable obligations | Shared according to authority and contract | Lawful change-in-law provisions | Unallocated compliance costs |
| Concession termination | Early termination or expiry | Contractual parties and competent authorities | Clear valuation and compensation provisions | Loss of unrecovered investment value |
| Electricity supply | Network delay or cost escalation | Grid operator, supplier and project sponsor | Connection agreement, supply contract and scheduling provisions | Idle energy infrastructure |
| Industrial offtake | Customer cancels or reduces purchases | Producer and customer | Purchase commitments and credit protections | Production assets operate below capacity |
| Hydrological restrictions | Reduced vessel loading or navigation interruption | Cannot be eliminated by one party | Adaptive operations, maintenance coordination and suitable insurance where available | Reduced freight reliability |
| Procurement challenge | Tender or award disputed | Awarding authority and bidders within applicable law | Transparent award criteria and procedural safeguards | Delayed financial close |
| Financing conditions | Higher interest rates or unavailable debt | Project sponsors and lenders | Financing commitments and prudent capital structure | Investment postponement |
| Environmental obligations | Additional assessment or mitigation required | Competent authorities and developer according to law | Early assessment and allocated compliance obligations | Construction delay or redesign |
This matrix is an analytical allocation framework, not a statement that every risk can legally be transferred to the preferred party. Contractual arrangements must comply with the applicable jurisdiction’s concession, procurement, environmental, competition and public-finance rules. The allocation of commercial operating risk is particularly significant because an arrangement that removes substantially all meaningful operating risk from a supposed concessionaire may require different legal classification and scrutiny. The objective is not to construct an unconditional public guarantee of private returns, but to ensure that projects are financed against risks that investors can identify, price and manage.
Dedicated energy-investment vehicles and the conditions for genuine bankability
The development of shared electricity infrastructure, hydrogen networks, carbon-management systems and alternative-fuel facilities creates a strong case for considering dedicated investment companies or special-purpose vehicles. Such structures can separate a specific project’s assets, liabilities and contractual relationships from the general finances of the port authority. They may also permit participation by industrial companies, infrastructure investors, utility operators and public institutions with different financial objectives. Nevertheless, the formation of a project company should not be regarded as evidence that a project is bankable. A company without committed customers, enforceable financing arrangements, adequate equity and credible infrastructure access remains commercially weak regardless of its legal form.
For a project involving shared energy infrastructure, the decisive financial relationships typically include an agreement granting rights to the land or infrastructure corridor, construction contracts, utility connections, customer purchase or capacity commitments, debt agreements and procedures governing the consequences of delays or changes in operating conditions. If one essential contract is missing, the project may remain unable to reach financial close. The financial structure should therefore be evaluated through the enforceability and interaction of its contracts rather than the nominal amount of investment announced by its sponsors. This is particularly relevant to hydrogen projects, where production economics, electricity procurement and industrial demand are closely interconnected, and to carbon-management projects whose components must operate as a coordinated system.
The broader European experience provides evidence that legally defined financial frameworks and public investment support can coexist with dedicated project organisations. However, no uniform financing model can be assumed to work equally well for shore power, hydrogen production, carbon storage and cargo-handling terminals. These investments have different revenue profiles, customer risks and regulatory conditions. A shore-power project may benefit from a legally supported demand framework, while a hydrogen project may require long-term industrial purchase commitments. A carbon transport network may rely on industrial capacity reservations, while a terminal concession may depend predominantly on freight throughput and handling charges. The financing vehicle must be designed around the underlying economics rather than selected as a substitute for them.
The state as investor: public balance-sheet exposure and contingent liabilities
A major weakness in discussions of port reform is the treatment of public expenditure as if its financial effects ended when the initial investment was made. Large infrastructure projects can create continuing liabilities through maintenance, operational support, guarantees, debt obligations and future replacement expenditure. A publicly owned investment corporation may also accumulate financing commitments whose economic risks ultimately remain linked to the state, depending on the company’s legal arrangements and the applicable public-accounting treatment. The existence of a corporate balance sheet does not automatically remove public fiscal exposure. Similarly, a public-private partnership may involve long-term public payment obligations or guarantees that are not visible in the initial construction budget.
A serious reform programme should therefore report the complete expected fiscal exposure of its investments. This includes capital grants, loans, guarantees, operating support, maintenance obligations and the consequences of termination or restructuring. The appropriate financial measure is not only the nominal value of approved investments but the expected public expenditure and contingent liabilities over the relevant period. Projects should also be tested against scenarios involving construction delays, weaker demand, increased operating costs and changes in financing conditions. Such analysis can reveal that a project appearing affordable at the time of approval becomes fiscally burdensome when several adverse conditions occur simultaneously.
For Italy, this issue is central to assessing the proposed national port investment company. A centrally coordinated investment programme may improve efficiency if it consolidates project evaluation, financing expertise and implementation monitoring. It may create additional fiscal risks if investment decisions become less transparent or if project liabilities are separated from the public institutions ultimately responsible for supporting them. The decisive evidence will be the operative corporate governance, financing arrangements, allocation of liabilities and audited investment outcomes. The Italian Ministry’s September 2026 announcement documented the parliamentary process surrounding Porti d’Italia S.p.A., but it did not establish the eventual financial performance of that proposed institution. Italian Port Governance Reform — Ministry of Infrastructure and Transport — September 2026. Ministero delle infrastrutture e dei trasporti
Reform instruments ranked by economic mechanism and feasibility
| Instrument | Responsible authority or parties | Expected economic effect | Implementation burden | Principal downside | Analytical confidence |
|---|---|---|---|---|---|
| Standardised concession-investment evaluation | Port authority and competent national regulator | Better alignment between duration, investment and returns | Medium | Standardisation may overlook local differences | High |
| Lawful change-in-law and termination provisions | Contracting authority and investor | Reduction of unallocated regulatory risk | Medium | Excessive guarantees can shift risk to taxpayers | High |
| Coordinated infrastructure interface agreements | Port authority, rail and utility infrastructure managers | Fewer mismatches between connected assets | Medium to high | Multiple parties can still miss deadlines | High |
| Single coordinating permit authority | National and territorial competent authorities | Greater procedural predictability | Medium | Limited benefit without clear legal powers | High |
| Transparent public-project financial reporting | Public investment entity and audit bodies | Better allocation and monitoring of public funds | Medium | Reporting burden without effective enforcement | High |
| Dedicated energy-project companies | Industrial sponsors, utilities and investors | Separation of project financing and risks | Medium to high | Corporate form does not create customers | High |
| Long-term industrial offtake contracts | Producers and industrial buyers | Greater revenue visibility | Commercially demanding | Customer default and renegotiation risk | High |
| Multiannual fiscal incentives | Parliament and government | Improved visibility over eligible investment support | High fiscal and political burden | Subsidy dependence | Medium |
| National investment centralisation | Parliament, government and port institutions | Potential coordination of strategic works | High | Concentration of discretion and additional approval layers | Medium |
| Corridor-wide hydrological service commitments | Waterway administrations and international partners | Greater inland-navigation reliability | High cross-border burden | Climate variability remains | Medium |
The table distinguishes the expected mechanism from the certainty of its implementation. Some instruments offer direct improvements in contractual clarity but require careful legal drafting. Others, such as national investment centralisation, can affect a larger number of projects but are institutionally more complex and may generate ambiguous outcomes. The preferred policy should therefore depend on the specific problem being addressed. Where the principal constraint is uncertainty over a concession’s financial treatment, creating a new public investment institution may not resolve it. Where the constraint is the failure to coordinate several nationally significant projects, central investment planning may be more relevant. Where demand is insufficient, neither legal simplification nor public expenditure can guarantee that commercial investment will be viable.
Fiscal-policy durability: stabilising expectations without promising permanent subsidies
Fiscal incentives can alter the financial attractiveness of an investment by reducing initial capital cost, improving after-tax returns or supporting early operations. Their value depends on their legal durability, eligibility conditions, administrative procedures and interaction with other forms of public support. A tax credit available during a limited investment window may be useful for equipment purchases or industrial construction, but it cannot be treated as equivalent to a guaranteed revenue stream extending throughout the life of the facility. The financial model must therefore distinguish between an incentive received during investment, operating support available for a defined period and recurring market revenues generated by customers.
Long-term regulatory and fiscal certainty does not require guaranteeing that a particular tax rate or subsidy will remain unchanged indefinitely. It requires transparent rules governing existing commitments, predictable implementation and reasonable protection against arbitrary retroactive changes. Governments may need to modify incentive programmes as markets mature or budgetary circumstances change. The challenge is to manage those changes without undermining legally established expectations or encouraging investors to defer projects in anticipation of more favourable future schemes. Appropriate transition provisions, clearly defined eligibility dates and consistent treatment of authorised investments can improve predictability while preserving the state’s fiscal responsibilities.
The risk of dependence on temporary incentives is particularly significant for energy projects whose operating economics remain weak without public support. If a facility is viable only while receiving a subsidy, the expiration or reduction of that support can impair its ability to service debt or maintain operations. The financial appraisal should therefore distinguish the base case with authorised support from a sensitivity case in which support expires according to the relevant statutory provisions. This does not imply that every project receiving support is inefficient. Environmental infrastructure may generate public benefits not fully reflected in private revenues. It does, however, require the policy authority to identify the benefit being financed and to evaluate whether continuing support remains proportionate.
Chapter 6 — Key judgements
The evidence supports a high-confidence assessment that contractual clarity, commercially appropriate risk allocation and reliable infrastructure interfaces are necessary conditions for mobilising private capital into long-duration port investments. Directive 2014/23/EU establishes that relevant concession duration must be justified by investment recovery rather than selected arbitrarily, while Directive (EU) 2021/1187 provides a legally defined framework for streamlining authorisations for qualifying transport infrastructure. The European Court of Auditors’ 2026 findings show that project delays remain materially consequential despite existing legislation and institutional coordination mechanisms.
The proposition that greater centralisation will improve Italian investment outcomes remains a medium-confidence conditional judgement. It could strengthen strategic coordination if the final framework provides clear financial responsibilities, transparent project selection and enforceable implementation obligations. It could weaken investor certainty if it adds administrative layers without resolving contractual and operational dependencies. The distinction between the state as owner, regulator and investor is therefore less important than the allocation of responsibility for each material financial and operational risk.
What would change the assessment: Verified reductions in permitting and construction delays, increased project-level private financial closes and transparent improvements in completed-asset utilisation would strengthen the case for the adopted reforms. Continued schedule slippage, rising public contingent liabilities or weak private participation despite institutional restructuring would weaken it.
Open official record: Final enacted port reform provisions; representative concession contracts; public-private project financing agreements; national authorisation-time statistics; audited investment-vehicle accounts; and project-level public fiscal exposure.
Chapter 7. The European Port Outlook: Realistic Scenarios for 2027, 2028–2030 and 2031–2035
Principal judgement — High confidence for the direction of structural constraints; medium confidence for the distribution of outcomes. The most probable development of European port systems through 2035 is a differentiated transition in which established commercial gateways improve selected infrastructure and energy functions, while weaker systems remain constrained by execution delays, limited industrial demand and uneven transport connectivity. The regulatory calendar creates identifiable milestones, particularly for TEN-T infrastructure and shore-side electricity, but it does not establish that every investment will be completed on time or operate at commercially sustainable levels. In January 2026, the European Court of Auditors explicitly concluded that the completion deadline for the EU core TEN-T network would not be met, based on delays affecting major transport projects. The revised TEN-T framework retains the 2030 deadline for the core network, introduces 2040 for the extended core network and provides a 2050 horizon for the comprehensive network. These dates should therefore be understood as legal and planning milestones, not unconditional forecasts of achieved infrastructure availability. Regulation (EU) 2024/1679 on the Development of the Trans-European Transport Network — European Parliament and Council — June 2024; Special Report 02/2026 — European Court of Auditors — January 2026. Eur-Lex+1
The scenario analysis distinguishes two institutional conditions. The baseline assumes that the legal and financial structures documented at the assessment date evolve incrementally, without assuming a comprehensive transformation of national port governance, concessions or cross-border investment coordination. The reform scenario assumes that relevant authorities introduce and implement stronger contractual protections, coordinated authorisation procedures, financially credible project structures and investment programmes tied to demonstrable commercial demand. These are conditional pathways rather than mutually exclusive predictions for the whole of Europe. Individual ports may adopt effective reforms while neighbouring systems remain under existing arrangements. For that reason, the assessment does not assign artificial numerical probabilities to the pathways. The qualitative terms more likely, conditional and less likely refer to the strength of the underlying mechanisms and the maturity of the observed evidence, not to a statistical forecasting model.
The 2027 horizon: delivery discipline rather than structural transformation
The first forecast period is dominated by investments and regulatory arrangements that are already substantially determined by decisions taken before 2027. Major maritime civil works, railway connections, electrical infrastructure and industrial-energy projects generally require extended planning and construction periods. As a result, the principal changes observable by the end of 2027 will be influenced more by the implementation of existing projects than by entirely new investment policies introduced during the year. A governance reform enacted in late 2026 or during 2027 may improve future project preparation, but it cannot automatically eliminate engineering, procurement and construction requirements for facilities already being developed. This temporal distinction is important because governments frequently evaluate reform success through announcements or allocations that precede the emergence of commercial results by several years.
Under the baseline, Italian port investment is likely to remain uneven across projects and territories. Some infrastructure programmes will continue towards completion, while others may face delays linked to public works, procurement procedures or dependencies outside the port authority’s direct control. The proposed national investment-coordination framework, if enacted, may begin to influence institutional arrangements, but substantial improvements in private investment cannot be assumed before the operative rules and their commercial consequences become observable. The more defensible near-term indicators will be the publication of implementing instruments, clarification of financial powers, execution of major project agreements and evidence that investors can rely on the revised framework when committing capital.
In Northern Europe, the 2027 horizon will be shaped by industrial investment decisions and the commissioning of energy-related facilities already in development. The Porthos project’s revised operational expectation of no earlier than the second half of 2027 provides a concrete example of the importance of construction sequencing. Even if the project begins operations during the forecast period, its initial commissioning should not be equated with immediate sustained operation at full planned capacity. Similar distinctions apply to electrolysers, pipelines and other industrial facilities. The relevant indicators will be operational acceptance, actual output and contracted use, not merely the formal completion of construction.
For the Danube, 2027 is unlikely to produce a comprehensive transformation of the transport system. River navigation will remain influenced by seasonal conditions, while port throughput will depend on industrial production, commodity markets and the continuation or reconfiguration of freight flows associated with the Black Sea. Targeted improvements in navigation information, maintenance and port operations may create benefits within a relatively short period, but major changes in river-port market share would require the development of sustained commercial services. The physical and commercial constraints identified in Chapter 4 therefore remain material in the near term.
The 2028–2030 horizon: regulatory convergence without guaranteed commercial convergence
The period from 2028 to 2030 is the most consequential regulatory interval in the forecast because several transport and energy obligations approach defined implementation deadlines. The revised TEN-T framework retains 2030 as the completion target for the core network, while AFIR requires qualifying maritime ports to provide relevant shore-side electricity coverage by 31 December 2029. FuelEU Maritime introduces the corresponding connection requirements for relevant vessels from 1 January 2030 under the applicable conditions. These measures create a stronger legal incentive for maritime electrification, but their economic consequences will depend on the interaction between port infrastructure, vessel readiness, electricity supply and service arrangements. Alternative Fuels Infrastructure Regulation, Articles 9–11 — European Parliament and Council — September 2023, consolidated January 2026; FuelEU Maritime — European Commission. EUR-Lex+1
The baseline scenario anticipates increased physical availability of shore-power infrastructure at qualifying major ports, accompanied by differences in actual commercial utilisation. Large container and passenger ports may benefit from relatively predictable vessel demand and regulatory requirements, while smaller or more specialised installations may face irregular usage patterns. Electricity prices, grid constraints and the legal organisation of service provision will remain important. The presence of installed electrical capacity should therefore be treated as a compliance and infrastructure indicator rather than a sufficient measure of successful decarbonisation.
Mediterranean competitiveness is likely to remain differentiated over this period. Ports possessing reliable inland transport services, established industrial customers and commercially strong terminal operations may strengthen their positions in particular cargo markets. However, the evidence from long-delayed European transport projects weakens the assumption that all major corridor improvements will be available by 2030. Ports depending on infrastructure scheduled beyond that date may continue to face limitations on the total transport service they can offer. The result is likely to be selective improvement rather than a uniform shift of European cargo from Northern to Southern gateways.
Under the reform scenario, the principal difference would not necessarily be a dramatic increase in total throughput by 2030. It would be an improvement in the conditions under which future investments are approved, financed and implemented. Clearer concession rules could reduce uncertainty for investors, better infrastructure coordination could prevent incompatible project schedules, and transparent contractual structures could attract industrial participants into energy projects. These changes may become visible initially through project financing and investment commitments rather than completed facilities. Their commercial effects would then appear progressively as assets are commissioned and utilised.
The 2031–2035 horizon: concentration of capital and the possibility of structural divergence
Beyond 2030, the distinction between stronger and weaker port systems may become more pronounced because the cumulative effects of investment choices will become increasingly visible. Ports that have secured commercially credible infrastructure development, reliable inland access and industrial demand may attract further investment because existing services reduce the costs and risks of complementary projects. Ports whose infrastructure remains fragmented or underutilised may experience the opposite effect: weak commercial results reduce confidence in future investment, making it more difficult to finance the improvements needed to restore competitiveness. These cumulative processes can produce divergence even when national public-investment programmes are similar in nominal size.
Northern Europe’s established industrial clusters may retain advantages in logistics integration and specialised infrastructure, but their future energy role is conditional on the competitiveness of European industry. If high energy costs and international competition continue to weaken major industrial customers, some emerging energy projects may face difficulty reaching sustained utilisation. In this case, the presence of sophisticated governance and extensive infrastructure would not prevent investment postponements or industrial restructuring. Conversely, if industrial conditions improve and low-carbon infrastructure reaches operational maturity, established clusters could benefit from the concentration of customers, technical expertise and shared networks.
For Italy, the post-2030 outlook depends partly on whether reforms undertaken earlier in the decade have generated a more reliable investment environment. If concession provisions, public infrastructure interfaces and financial responsibilities become predictable, private operators may be more willing to undertake long-duration investments. If reform remains principally administrative, the economic effects may be limited. The distinction will be observable through financing agreements, infrastructure completion and productive asset use, rather than through the number of entities reorganised or the nominal value of announced projects.
The Danube’s post-2030 outlook is more directly exposed to climate adaptation and the competitiveness of inland navigation. Recurrent low-water conditions can reduce the reliability of freight services and discourage cargo owners from depending on river transport for time-sensitive operations. Targeted infrastructure maintenance, improved hydrological forecasting and vessel technologies may mitigate some effects, but adaptation cannot remove the underlying variability of the river. Commercial resilience will depend on the capacity to maintain economically acceptable services during adverse conditions and to integrate river freight with rail and road alternatives when necessary. Without these improvements, the geographical potential of the corridor is unlikely to translate into a sustained expansion of diversified freight markets.
Scenario comparison by system and horizon
| System | 2027 baseline | 2028–2030 baseline | 2031–2035 baseline | Conditional effect of effective reform |
|---|---|---|---|---|
| Italian port governance | Implementation of existing works and possible institutional transition | Uneven concession and investment outcomes | Divergence between commercially strong and weaker gateways | Greater predictability in financing and project delivery |
| Rotterdam and Northern industrial clusters | Energy-project commissioning and industrial adjustment | Selective operational expansion | Industrial restructuring may alter energy and freight demand | Stronger integration where customers remain competitive |
| Antwerp-Bruges and Hamburg | Operational and connectivity improvements | Continued investment in established freight networks | Potential consolidation around efficient industrial and logistics services | Greater efficiency from targeted infrastructure coordination |
| French ports | Selective modernisation | Corridor-dependent performance | Different outcomes by industrial and freight market | Improved inland-service reliability and project selection |
| Spanish Mediterranean gateways | Consolidation of existing commercial activity | Targeted terminal and inland investment | Competition between gateway and transshipment functions | Stronger gateway performance where inland demand supports investment |
| Greek and Eastern Mediterranean ports | Corridor and shipping-network dependence | Selective opportunities in Southeast European freight | Continued geopolitical and intermodal exposure | Improved cross-border service integration |
| Serbian Danube ports | Industrial-demand and water-level sensitivity | Limited structural diversification under current conditions | Climate and customer concentration remain material | Better service reliability and selective diversification |
| Croatian river ports | Uneven local cargo demand | Targeted infrastructure improvements | Commercial scale remains a constraint | Cross-border coordination and demand-based investment |
| Romania and Lower Danube | Adjustment to changing Black Sea freight flows | Infrastructure and navigation resilience challenges | Strategic role remains sensitive to geopolitics and hydrology | Better resilience and commercially appropriate capacity |
The scenarios are qualitative and do not imply identical performance among all ports within each category. Their purpose is to identify mechanisms that could influence the direction of development. Differences in national legislation, industrial conditions and project maturity mean that the outcome of a reform in one jurisdiction cannot be transferred mechanically to another.
Commercial demand and the risk of overcapacity
One of the principal forecast risks is that public infrastructure investment will increase nominal capacity faster than commercially available demand. This risk is particularly relevant to transshipment terminals, inland ports with limited freight diversification and emerging energy infrastructure. The presence of new quay length, handling equipment or industrial land does not generate additional throughput unless customers use the facilities. Similarly, a hydrogen production plant does not generate sustained output merely because its nominal capacity has been installed. Investment programmes should therefore distinguish the commercial demand required to support a project from the infrastructure capacity that the project can theoretically provide.
The risk can be amplified by competition among neighbouring ports. If several ports invest simultaneously in similar facilities while serving overlapping customer markets, the combined increase in capacity may exceed the growth in available demand. Operators may then compete more aggressively on tariffs, reducing returns and weakening the financial position of the investments. This does not mean that capacity competition is necessarily undesirable; it can improve services and prices for customers. It does mean that public authorities should avoid assuming that every project will achieve its forecast market share independently of competing investments.
For river ports, the overcapacity problem may take a different form. A terminal designed for high annual throughput may operate below its engineering capacity because the river is not sufficiently navigable during critical periods or because the relevant industrial customer reduces production. In such circumstances, the appropriate response may be greater operating flexibility rather than additional construction. Commercial capacity should therefore be defined in relation to the service that can reliably be provided under realistic conditions, not only the maximum output achievable in favourable circumstances.
Climate amplification: forecasting exposure without inventing drought probabilities
The hydrological record supports the conclusion that low-water conditions are a material and recurring risk for inland navigation, but it does not support a precise probability distribution for Danube freight disruption through 2035 without a dedicated hydrological model. Forecasting the number of days below critical navigation levels would require a consistent historical record, river-section characteristics, climate scenarios, hydrological modelling and assumptions about infrastructure maintenance. Such a model would also need to distinguish water level from actual navigable depth and consider changes in vessel design and operating practices. The available evidence is sufficient to justify climate-resilience investment and operational planning, but not to assign invented annual drought probabilities.
The relevant strategic forecast should therefore be conditional. If low-water episodes recur at high frequency or duration, inland navigation will face higher transport costs, reduced carrying capacity and potential loss of commercial reliability. If targeted adaptation and operational improvements increase the ability of vessels to navigate during adverse conditions, some of these effects may be mitigated. Neither outcome can be expressed credibly as a fixed percentage increase or decrease in total Danube throughput without additional modelling. Decision-makers should instead monitor the relationship between critical water levels, vessel-loading restrictions, freight rates and actual cargo movements.
Geopolitical dependencies and the limits of transport forecasts
European port systems remain exposed to geopolitical developments that can alter maritime routes, industrial demand and energy imports. The war in Ukraine has already demonstrated the capacity of security disruption to redirect freight through Danube and Black Sea facilities. Changes in shipping security, trade policy, sanctions, industrial production or energy markets could also alter the relative attractiveness of Mediterranean and Northern European routes. These factors introduce uncertainty that cannot be eliminated through domestic port reform alone.
The appropriate forecasting approach is to identify the mechanisms through which geopolitical conditions affect transport demand and infrastructure use. A change in shipping routes can alter vessel calls and transshipment volumes. Industrial sanctions or trade restrictions can reduce demand for particular commodities. Energy-market changes can influence refinery activity, LNG imports and investment in new fuel infrastructure. Disruption to rail or maritime corridors can increase the strategic value of alternative routes while generating traffic patterns that may not persist under normal conditions. The economic significance of these changes depends on duration, magnitude and the availability of substitutes.
Forecast confidence and falsification criteria
| Forecast judgement | Confidence | Principal supporting mechanism | Observation that would weaken it |
|---|---|---|---|
| Shore-power infrastructure deployment increases at qualifying EU maritime ports by 2030 | High | Binding regulatory obligations | Widespread failure to commission required installations |
| Actual shore-power utilisation remains uneven | Medium | Different vessel traffic, costs and operating arrangements | Consistently high utilisation across diverse port categories |
| Hydrogen deployment concentrates around commercially supported industrial demand | High | Electricity and offtake economics | Widespread profitable operation without long-term industrial customers |
| Mediterranean gateway performance remains differentiated | High | Hinterland and cargo-market differences | Broad convergence in measured end-to-end service competitiveness |
| Port governance reform improves investment only when contractual certainty changes | High | Relationship between risk allocation and financing | Sustained capital mobilisation without corresponding contractual improvements |
| Danube freight remains vulnerable to hydrological restrictions | High | Documented low-water exposure | Long periods of reliable operation under adverse conditions without significant cost penalties |
| Serbian river-port diversification remains selective under current conditions | Medium | Concentrated cargo markets and limited comparable evidence of container services | Sustained diversified cargo growth and regular intermodal operations |
| Public infrastructure spending creates some risk of underutilised assets | High | Capacity can exceed commercially viable demand | Consistently high measured utilisation across newly completed assets |
| Large-scale restructuring of European port competition occurs by 2030 | Low | Long project cycles and established transport networks oppose rapid shifts | Major sustained changes in freight routing and inland market penetration |
Chapter 7 — Key judgements
The evidence supports a high-confidence forecast of continued differentiation among European port systems and a medium-confidence assessment that institutional reform could improve investment outcomes where it produces enforceable contractual and implementation changes. It does not support a numerical forecast of national throughput, hydrogen production or Danube freight growth through 2035 without additional harmonised data and explicit modelling assumptions.
The most probable 2027 outcome is continued implementation of existing projects, accompanied by uneven regulatory and commercial progress. The 2028–2030 period will be shaped by legally defined infrastructure milestones, but the European Court of Auditors’ findings make comprehensive on-time network completion an unreliable assumption. From 2031 to 2035, the cumulative effects of industrial competitiveness, investment execution and climate adaptation are likely to produce greater divergence between strong and weak systems.
What would change the assessment: Sustained growth in commercially viable private investment, completed infrastructure operating at high utilisation, reliable Danube freight services despite hydrological extremes and measurable convergence in inland transport costs would support a more positive scenario. Further infrastructure delays, industrial closures, weak energy demand and repeated navigation restrictions would reinforce the baseline.
Chapter 8. Strategic Net Assessment: Residual Risks, Monitoring Indicators and Policy Decisions
Principal judgement — High confidence. European port policy should move from a system primarily assessed through expenditure authorisations, construction milestones and nominal transport capacity towards one assessed through economically productive infrastructure, enforceable investment commitments, reliable transport services and measurable resilience. The evidence does not support a single institutional solution applicable to all maritime and river ports. Italy’s contractual and administrative challenges differ from Northern Europe’s industrial competitiveness problem, while Mediterranean hinterland integration and Danube navigability require additional, specialised responses. Nevertheless, these different conditions create a common decision requirement: governments must distinguish investments justified by commercial revenues from infrastructure justified by wider public benefits, and they must ensure that each project has a clear operational purpose, financial structure and measurable outcome. The strategic risk of failing to make this distinction is not simply inefficient spending. It is the accumulation of infrastructure assets that create maintenance and financing obligations while remaining unable to provide the transport or energy services originally expected.
The failure of expenditure-based infrastructure governance
The central weakness of an expenditure-based approach is that it treats the commitment or disbursement of public funds as evidence of progress towards economic outcomes. Budget allocations are necessary for publicly financed works, but they do not establish that a facility has been constructed, commissioned or used. Similarly, awarding a contract establishes a procurement milestone but does not guarantee delivery according to the agreed timetable. The European Court of Auditors’ January 2026 report provides authoritative evidence that major European transport infrastructure has continued to experience substantial delays and cost increases, notwithstanding the existence of European financing and institutional oversight. Its conclusion that the core TEN-T network will not meet the 2030 completion deadline is especially important because it demonstrates the limits of planning milestones as predictors of actual operational availability. Special Report 02/2026: EU Transport Infrastructure — European Court of Auditors — January 2026. European Court of Auditors
A more rigorous investment system would classify projects according to the public benefit they are intended to produce. Some infrastructure is necessary for navigation safety or territorial connectivity even when direct commercial revenues are insufficient to recover costs. Other projects are expected to generate revenues through terminal services, energy sales, industrial activity or long-term capacity agreements. Both categories can be legitimate, but their financial evaluation should differ. A strategic navigation channel should be assessed through reliability, safety and transport-system benefits, whereas a specialised commercial terminal should also demonstrate a credible relationship between investment cost, customer demand and expected operating revenues. Where a project combines public and commercial benefits, the financing structure should specify which benefits justify public expenditure and which risks remain with commercial participants.
This distinction is especially important for climate resilience. The maintenance of a navigable waterway may generate benefits distributed across several countries and commercial sectors, making full recovery through individual port charges difficult. Yet investment in a large specialised terminal serving one industrial customer has a more concentrated commercial beneficiary. Treating both projects as interchangeable items within a general infrastructure budget can weaken accountability and encourage the development of assets whose expected demand has not been demonstrated.
An investment decision framework based on service outcomes
A decision-grade assessment should begin with the service that the proposed asset is intended to provide. For a maritime gateway, this may be additional commercially reliable container handling linked to inland transport. For a river port, it may be improved access for industrial bulk shipments under realistic navigation conditions. For shore-side electricity, it is electricity delivered to qualifying vessels. For hydrogen infrastructure, it is production and delivery to identified customers. For carbon-management infrastructure, it is the transport and storage of verified quantities of carbon dioxide under applicable regulatory requirements. The project should then be evaluated against alternative ways of providing the same service, including improvements to existing infrastructure, better operating coordination and the use of other transport or energy technologies.
The economic importance of alternatives is frequently underestimated. A port authority considering terminal expansion may be able to improve effective capacity through changes in operating hours, equipment availability or inland freight coordination. A river-port operator facing irregular cargo volumes may obtain greater benefit from flexible handling arrangements than from new fixed infrastructure. A shore-power project may require a stronger electricity connection rather than additional berth-level equipment. These alternatives must be assessed according to their costs, benefits, technical feasibility and implementation times. The objective is not to avoid infrastructure construction, but to ensure that construction addresses the constraint actually limiting performance.
A rigorous project appraisal should also account for the possibility that future commercial conditions differ from those assumed at approval. Traffic forecasts may be affected by changes in industrial production, carrier networks, energy costs and competing infrastructure. Climate conditions may alter the reliability of navigation. Regulatory requirements may create additional investment obligations. Financing costs may increase. The project should therefore be tested against adverse conditions that are materially relevant to its operating model, without introducing unsupported probability distributions. Where a project’s commercial viability disappears under modest, plausible deviations from its central assumptions, the investment authority should consider a different contractual structure, a reduced scale or the postponement of expenditure until additional demand evidence becomes available.
A proposed European port investment-screening matrix
The following framework is a policy and investment recommendation derived from the preceding evidence. It is not presented as an existing EU-wide legal scoring system, and no arbitrary composite scores are assigned.
| Decision dimension | Minimum evidence before commitment | Indicator after commissioning | Decision consequence if evidence is insufficient |
|---|---|---|---|
| Commercial demand | Cargo contracts, customer forecasts with documented assumptions, identifiable market | Actual throughput and customer retention | Reconsider capacity or financing structure |
| Concession rights | Operative contract, duration basis, investment obligations, termination provisions | Compliance and investment delivery | Do not commit irrecoverable capital before material rights are clarified |
| Public infrastructure interfaces | Coordinated access and utility delivery programme | Availability of connected infrastructure | Require enforceable interface milestones |
| Financial structure | Committed funding, debt terms, equity and disclosed public exposure | Debt service and cash generation | Redesign financing or project scale |
| Construction readiness | Completed studies, permits and procurement arrangements | Schedule and cost performance | Delay financial commitment or resolve dependencies |
| Environmental compliance | Applicable approvals and mitigation obligations | Verified compliance and operating performance | Do not proceed without lawful authorisation |
| Energy demand | Electricity or fuel purchase commitments and credible operating profile | Delivered MWh, tonnes or other service output | Avoid unsupported production capacity |
| Climate exposure | Site-specific hazard and operational assessment | Reliability during extreme conditions | Require adaptation or alternative operating arrangements |
| Multimodal integration | Scheduled rail, road or waterway services and capacity evidence | Effective intermodal movements | Prioritise connectivity over terminal expansion |
| Public value | Documented external benefits and justification for support | Measurable public-service outcomes | Reassess subsidy or expenditure rationale |
The matrix should be applied proportionately. A relatively small equipment replacement project does not require the same financial and technical analysis as a multi-billion-euro infrastructure programme. Nevertheless, the core principles remain applicable: the decision-maker must understand what service will be delivered, who will use it, how it will be financed, which risks remain unresolved and what evidence will establish whether the investment achieved its purpose.
Investment thresholds: practical triggers rather than invented universal ratios
It would be misleading to prescribe one minimum utilisation rate, debt coverage ratio or concession duration for every European port project. Different cargo markets, asset types and financial structures require different thresholds. A dry-bulk terminal may have seasonal utilisation patterns, while a container facility may operate continuously with different equipment requirements. A navigation-safety investment may have a weak direct revenue case but substantial public benefits. An energy facility may depend on long-term purchase commitments rather than daily spot-market demand. Consequently, universal numerical thresholds could encourage inappropriate investment decisions.
What can be specified more defensibly is the evidence required before particular stages of investment. A project should not be classified as commercially committed until the necessary financing agreements are binding. It should not be classified as operational before applicable commissioning requirements are satisfied. It should not be described as operating at commercial scale without measured service output. It should not be described as financially self-sustaining without evidence that revenues and authorised support are sufficient to cover the relevant obligations. These are verification thresholds rather than arbitrary performance targets.
For public authorities, the appropriate response to inadequate evidence is not always project cancellation. Some projects may require additional technical study, contractual restructuring, revised financing or phased construction. Others may warrant public support because they provide strategic services that commercial users cannot fully finance. The decision must remain linked to the identified public or commercial objective rather than the desire to maintain an announced investment programme.
A three-stage public investment authorisation system
A useful institutional reform would divide major infrastructure decisions into distinct authorisation stages. The first would establish the public or commercial need and examine alternative ways of meeting it. The second would confirm legal rights, technical feasibility, environmental compliance and the financing structure. The third would authorise substantial construction expenditure only when the principal implementation dependencies are sufficiently resolved. This would not eliminate all uncertainty, but it could reduce the risk that projects proceed into expensive construction phases before critical external infrastructure, customers or contractual arrangements are available.
The effectiveness of such a system would depend on genuine decision-making discipline. If each authorisation stage becomes a procedural formality, the framework would merely add bureaucracy. If authorities can reject or redesign projects when evidence is inadequate, it can improve capital allocation. Independent audit and public reporting are especially important where projects are financed partly through public funds and partly through commercial investment. They can help establish whether investment assumptions were reasonable, whether risks were disclosed and whether completed assets generate the intended outcomes.
A risk register for 2027–2035
| Material risk | Affected systems | Observable warning indicator | Principal consequence | Potential response |
|---|---|---|---|---|
| Concession uncertainty | Italy and other concession-based systems | Disputes, delayed awards, unclear investment recovery | Private investment postponement | Clarify enforceable rights and obligations |
| Public project delays | EU-wide | Repeated schedule revisions | Higher costs and delayed benefits | Stronger coordination and staged authorisation |
| Industrial demand decline | Northern Europe and industrial ports | Plant closures, cancelled offtake commitments | Underused infrastructure | Reassess demand and diversify where feasible |
| Electricity-price volatility | Major maritime and energy hubs | Rising delivered electricity cost | Weak shore-power or hydrogen economics | Procurement strategies and appropriate contractual allocation |
| Grid-connection delays | Electrification and industrial-energy projects | Missed utility milestones | Commissioned but unusable assets | Binding interface agreements |
| Low-water recurrence | Danube and Sava | Increasing days of restricted draught | Higher freight costs and reduced reliability | Fairway management, adaptive operations and fleet suitability |
| Maritime network restructuring | Transshipment ports | Loss or relocation of major services | Rapid traffic decline | Diversification and prudent capacity planning |
| Incomplete corridor integration | Mediterranean and Balkan gateways | Unreliable rail or border operations | Weak inland market access | Cross-border operational coordination |
| Public subsidy expiry | Energy projects | Revenue dependence on temporary support | Financial stress after support ends | Explicit transition and sensitivity analysis |
| Geopolitical route disruption | Black Sea, Eastern Mediterranean and wider Europe | Security restrictions and shipping-route changes | Traffic volatility | Alternative routes and resilience planning |
| Underused public assets | All systems | Low measured operating output despite completed works | Fiscal burden and weak economic benefits | Independent post-completion review |
The risk register does not provide a numerical probability ranking because the underlying evidence is not sufficient to construct a comparable probabilistic model. Its purpose is to identify causal mechanisms and observations that should trigger further scrutiny. Several risks may occur simultaneously, and their interactions can be more consequential than any individual event. For example, a low-water period affecting the Danube may coincide with industrial demand weakness, reducing river freight volumes for more than one reason. Similarly, an energy project may experience both grid delays and insufficient customer demand. Monitoring systems must therefore avoid attributing a complex outcome to the first visible cause.
Italy: the decision agenda for national and territorial authorities
The Italian government and Parliament face a choice that extends beyond the legal design of Porti d’Italia S.p.A. The central question is whether institutional reform will produce better investment outcomes by clarifying responsibilities and reducing the risks associated with long-duration projects. National coordination may be appropriate for strategic infrastructure, but concession administration, commercial relationships and territorial planning must remain sufficiently clear for investors to understand their rights and obligations. A reform that improves coordination while preserving transparent operational responsibility could be beneficial. A reform that changes institutional hierarchies without resolving financing and implementation risks could have limited economic effect.
The immediate decision agenda should therefore focus on the operative legal framework, financial accountability and project execution. The national government should establish transparent criteria for identifying strategic projects and disclosing their financial commitments. Port-system authorities should be able to demonstrate the relationship between concession obligations and investment recovery. Infrastructure managers should provide credible delivery programmes for connections on which commercial projects depend. Public authorities should report completed projects and their actual use rather than relying primarily on the value of investments announced or awarded.
These responsibilities can be allocated without requiring the state to become the operator of every commercial facility. The objective should be to create conditions under which private operators can make investment decisions based on commercially credible demand and legally stable rights, while public institutions retain responsibility for safety, planning, environmental protection and infrastructure serving collective needs.
France and Germany: stronger delivery integration rather than institutional imitation
France’s port system illustrates the importance of connecting public investment with industrial and inland transport performance. The country possesses major maritime infrastructure and established industrial regions, yet the historical traffic data examined in the French parliamentary review demonstrate that geographic location and public infrastructure alone do not guarantee sustained growth. The relevant policy priority is to improve the competitiveness of complete freight services and to ensure that new capital expenditure addresses identifiable bottlenecks. This may require stronger coordination between port institutions, rail infrastructure managers, industrial customers and logistics operators, alongside project-level financial accountability. Evaluation of French Port Competitiveness, Report No. 3020 — French National Assembly — July 2026.
Germany’s principal strategic issue differs because major ports already operate within substantial industrial and logistics networks. Their future competitiveness depends on maintaining effective inland transport capacity while adapting to industrial restructuring and energy-market changes. The delays affecting major European rail projects demonstrate that even economies with extensive transport infrastructure face significant execution risks. Germany therefore requires investment coordination and reliable delivery of infrastructure connections rather than an assumption that existing logistics strength automatically guarantees future competitiveness.
The policy implication is that France and Germany should not be treated as identical examples of Northern European port governance. Their infrastructure institutions, industrial geography and transport constraints differ. Comparative reform should identify the specific mechanisms producing good outcomes and determine whether those mechanisms can be transferred lawfully and economically to another jurisdiction.
The United Kingdom: private investment flexibility and public-interest obligations
The United Kingdom provides an alternative institutional reference because its port sector encompasses private and trust-port arrangements alongside other forms of ownership. This diversity indicates that commercial autonomy can be organised through different legal structures, but it does not eliminate the need for public oversight, planning controls and investment coordination. A privately owned port may possess substantial financial and operational discretion, yet its investment programme remains dependent on market demand and the availability of external infrastructure. A trust port may reinvest surpluses without distributing dividends to shareholders, while still operating according to commercial and statutory obligations.
The British policy lesson is therefore not that privatisation should be adopted indiscriminately across Europe. It is that public responsibilities and commercial operations can be organised through several institutional forms. The appropriateness of any model depends on the characteristics of the assets involved, the financing requirements and the public benefits that the port provides. Ports Good Governance Guidance — UK Department for Transport — March 2018.
Serbia and the Western Balkans: prioritising navigability and commercially credible freight services
For Serbia, the principal strategic priority is to improve the reliability and commercial relevance of inland navigation before assuming that substantial new terminal capacity will generate diversified freight growth. The observed port statistics demonstrate that existing cargo activity is uneven and linked closely to individual industrial markets. Public investment should therefore be directed towards maintaining commercially useful navigation conditions, improving the operational integration of existing facilities and supporting projects with identifiable freight demand. Where additional infrastructure is justified by wider strategic or territorial benefits, those benefits should be stated explicitly rather than represented as guaranteed commercial returns.
The non-EU status of Serbia and other Western Balkan jurisdictions also means that corridor integration depends on national implementation and international coordination. The inclusion of relevant routes within European transport planning does not automatically establish identical regulatory, administrative and investment conditions across all participating countries. Improvements in customs procedures, navigation information and cross-border services can therefore be as important as physical infrastructure investments.
For the Sava and Lower Danube systems, resilience planning should account for the possibility that freight demand changes because of industrial production, international trade or security developments. Investment justified through extraordinary cargo volumes should be tested against more ordinary operating conditions. This approach can preserve the strategic value of alternative transport routes without assuming that temporary freight diversions will generate permanent commercial demand.
Monitoring architecture: indicators, competent institutions and decision thresholds
An effective monitoring system should combine financial, operational, environmental and institutional data. The following framework identifies the principal observations required to determine whether the baseline forecast is being confirmed or weakened.
| Indicator | Primary responsible institution or evidence holder | Reporting frequency recommended | Decision use |
|---|---|---|---|
| Concession awards and investment commitments | Port authorities and competent contracting bodies | Quarterly | Assess investor certainty |
| Private equity and debt at financial close | Project companies and financing institutions | Event-based, annual consolidation | Measure actual private capital mobilisation |
| Public expenditure and contingent liabilities | Ministries, public investment bodies and auditors | Annual | Assess fiscal exposure |
| Project construction and commissioning schedules | Project sponsors and infrastructure authorities | Quarterly | Identify implementation delays |
| Terminal throughput and utilisation | Port authorities and operators | Quarterly and annual | Assess commercial asset use |
| Rail and inland transport service reliability | Infrastructure managers and freight operators | Monthly or quarterly | Assess hinterland competitiveness |
| Shore-power electricity delivered | Port energy operators and grid entities | Monthly and annual | Measure actual electrification |
| Hydrogen produced and sold | Project operators | Quarterly and annual | Distinguish nominal and operational capacity |
| Carbon dioxide transported and stored | Project and competent regulatory authorities | Quarterly and annual | Verify operational CCS deployment |
| Navigable draught and low-water restrictions | National waterway administrations | Daily observations and annual analysis | Assess climate-related navigation reliability |
| River cargo by commodity and port | Statistical offices, port authorities and commissions | Quarterly and annual | Identify structural changes in demand |
| Containerised river freight and service frequency | Terminal and transport operators | Quarterly | Assess intermodal market development |
| Cost-benefit and post-completion evaluations | Public infrastructure sponsors and auditors | At approval and after commissioning | Assess investment performance |
The recommended frequencies are policy proposals, not a claim that all jurisdictions currently publish these observations on a harmonised basis. In several cases, relevant data may be commercially confidential or dispersed across different institutions. The objective is to improve the ability of public authorities to assess outcomes without disclosing legitimately protected contractual information. Aggregated, independently verified reporting could provide meaningful evidence while respecting commercial confidentiality.
Institutional decision thresholds and corrective action
The effectiveness of monitoring depends on whether observations lead to decisions. A project experiencing repeated schedule extensions should trigger an examination of the underlying causes and the adequacy of its governance arrangements. An energy facility that has been commissioned but remains underused should trigger a review of customer demand, pricing, technical availability and operating obligations. A river terminal whose throughput declines for several years should be examined for changes in cargo markets, navigability and competing transport services before further capacity is added. A public investment programme whose liabilities increase faster than its expected benefits should be subject to a renewed economic and fiscal appraisal.
These thresholds should not be expressed through arbitrary numerical limits applied uniformly across jurisdictions. The relevant benchmark should be the project’s approved business case, investment commitments and service obligations. A delay may be acceptable where it results from necessary environmental assessment or an unforeseen technical condition, but repeated changes without transparent explanation can indicate weak project governance. Low utilisation may be temporary during an appropriately planned commissioning period, but persistent underuse that contradicts the original demand assumptions requires corrective action. Effective governance therefore depends on the willingness to revise or terminate weak projects as well as the capacity to approve new ones.
Strategic policy options: comparative feasibility and downside exposure
| Course of action | Competent authority | Expected effect | Implementation burden | Time-to-effect | Reversibility and principal downside |
|---|---|---|---|---|---|
| Clarify concession investment and termination rules | National legislator and competent concession authorities | Improve financing certainty | Medium to high | Medium term | Contractual commitments difficult to reverse; excessive guarantees create fiscal exposure |
| Coordinate public access infrastructure with terminal projects | Port and transport infrastructure authorities | Reduce idle capacity and interface delays | High | Medium to long term | Partial reversibility; schedule dependence |
| Establish project-specific energy companies | Public and private sponsors | Improve financing and risk separation | Medium | Medium term | Financial commitments may be long-lived; customer risk remains |
| Require verified commercial demand before capacity expansion | Investment authorities and sponsors | Reduce uneconomic construction | Medium | Short to medium term | May postpone strategically valuable projects |
| Strengthen independent project audits | National audit bodies and public sponsors | Improve accountability | Medium | Short to medium term | Administrative costs; limited impact without corrective powers |
| Improve navigability information and targeted fairway maintenance | National waterway administrations and international partners | Increase operational reliability | Medium to high | Variable | Recurring maintenance burden; climate extremes remain |
| Improve cross-border freight coordination | Transport ministries, customs bodies and operators | Reduce administrative and service delays | Medium to high | Medium term | Requires sustained international cooperation |
| Establish operational reporting for port-energy projects | Ministries, regulators and service operators | Verify actual energy-transition outcomes | Medium | Short to medium term | Reporting burden and data access requirements |
| Reassess persistent underutilisation | Asset owners, public auditors and financiers | Improve allocation of future capital | Medium | Medium term | Write-downs, contractual disputes or politically difficult decisions |
The appropriate policy package will vary by jurisdiction. Italy may obtain substantial benefits from clarifying investment rights and coordinating public works. Northern European ports may derive greater value from maintaining industrial competitiveness and aligning energy infrastructure with commercial demand. Mediterranean gateways may require improvements in inland services. Serbian and Croatian river ports may benefit more from navigability and demand-based terminal investment than from large-scale capacity expansion. A common European policy framework can support these objectives, but it should not eliminate the differentiation required by local commercial and physical conditions.
Final strategic assessment: the distinction between infrastructure sovereignty and commercially productive infrastructure
The European port system will remain strategically important because maritime gateways, inland waterways and associated industrial networks provide essential connections between international trade, domestic production and energy supply. The public interest in maintaining this infrastructure is substantial, and it cannot be reduced entirely to the financial returns available to individual operators. Nevertheless, strategic importance does not remove the need for economic discipline. Public authorities should be able to demonstrate why a project is necessary, which benefits it is expected to produce, how its costs and risks are allocated and what evidence will establish whether it has achieved its purpose.
The strongest institutional systems are likely to be those capable of combining public planning with commercial accountability, legally stable investment rights and operational coordination. The strongest infrastructure programmes are likely to be those that address identified constraints on existing or credibly forecast services rather than adding capacity in anticipation of demand that has not been established. Climate resilience will become increasingly important for inland navigation, while electricity-system integration and industrial offtake will remain central to energy infrastructure. These requirements create long-term investment opportunities, but they also impose more demanding conditions for project appraisal and financial execution.
The principal policy danger is the assumption that infrastructure modernisation can be measured through the value of public expenditure or the scale of announced investment. The evidence from delayed European transport megaprojects, volatile Danube-port traffic and complex energy infrastructure demonstrates that execution and productive utilisation are separate achievements. A technically completed asset may remain economically weak; a commercially successful service may depend on infrastructure beyond the control of its immediate operator; and an apparently favourable geographic position may not produce competitive advantage without reliable connections to customers.
The decisive strategic judgement is therefore that European port competitiveness through 2035 will depend on the ability of institutions to convert legal authority and investment capital into reliable, commercially relevant and climate-resilient services. This conclusion applies across different ownership models and national jurisdictions, but its practical implementation must remain differentiated. For Italy, the priority is enforceable investment certainty and coordination of infrastructure responsibilities. For Northern Europe, it is the preservation of industrial demand and the commercial viability of increasingly complex energy systems. For Mediterranean gateways, it is the development of competitive inland transport services and projects supported by identifiable customers. For Serbia and the Balkan–Danube network, it is the creation of reliable navigation and commercially useful multimodal operations under recurrent hydrological and geopolitical uncertainty.
The distinction between expenditure and outcomes should guide both public policy and private investment. Funds committed, contracts awarded and capacity announced are necessary intermediate observations, but they cannot establish final success. The decisive evidence is found in commissioned infrastructure, services actually delivered, sustained asset utilisation, financially viable operations and measurable public benefits.
Final confidence assessment
High confidence: Contractual certainty, infrastructure coordination and commercial demand are necessary conditions for the effective mobilisation of long-duration capital; European transport megaprojects face material implementation risks; and the Danube remains exposed to hydrological restrictions and uneven cargo demand.
Medium confidence: Well-designed institutional reforms can accelerate investment and improve infrastructure utilisation, but their effects depend on national implementation, the nature of the projects and the behaviour of commercial participants.
Medium confidence: Mediterranean and Northern European ports will continue to follow differentiated development paths, with the strongest commercial and industrial networks retaining important advantages while facing increasingly demanding energy-transition requirements.
Low confidence for precise numerical outcomes: Available evidence does not support defensible port-by-port forecasts of 2035 throughput, private investment volumes, hydrogen production or Danube freight growth without additional harmonised statistics, project-level data and explicit modelling.
Final decision consequence: Public authorities and investors should prioritise projects with documented demand, enforceable responsibilities, credible financing, measurable service outputs and resilience under adverse operating conditions. Strategic infrastructure that cannot be commercially self-financing may still warrant public investment, but its public purpose, lifetime obligations and expected benefits must be established transparently.
Final net assessment: The European port systems most likely to remain competitive will not necessarily be those that announce the largest expansion programmes. They will be those that reliably transform investment into productive, financeable and adaptable transport and energy infrastructure.


