



















The Economics of Carbon Attribution, Disaster-Recovery Markets, Investment Ownership and Effective Climate Governance
Scope: A global assessment of greenhouse-gas responsibility, the economics of climate-related investment and disaster recovery, wealth concentration, adaptation finance and regulatory effectiveness, with specific institutional implications for the European Union, Italy, France, Germany and the United Kingdom, covering the evidence available through October 2026 and the policy horizon to 2031.
Executive Summary — Bottom Line Up Front
The principal analytical judgment is that climate inequality is demonstrable, but the concentration of financial ownership, the attribution of corporate emissions and the economic incentives created by disaster-recovery markets are distinct phenomena that cannot be treated as interchangeable evidence of causation or deliberate obstruction of climate mitigation.
- High-income households have disproportionately large consumption-related carbon footprints. However, the responsibility assigned to shareholders through investment-emissions accounting depends on allocation conventions and should not automatically be interpreted as direct operational causation.
- Investment in disaster recovery can generate private profits while disasters impose substantial economic losses. Profitability in one sector does not demonstrate that diversified investors benefit from worsening climate conditions across their portfolios.
- The existence of financial exposure to both carbon-intensive industries and climate-adaptation businesses does not, by itself, establish an incentive to delay decarbonisation. Such a conclusion requires evidence of net economic benefit and actual influence over corporate or public decisions.
- UNEP’s 2026 Emissions Gap Report estimates that a pathway returning global warming to 1.5°C by 2100 requires emissions reductions of 18% by 2030, 45% by 2035 and 69% by 2040, measured against 2025 levels. UNEP – UN Environment Programme
- Public adaptation financing remains materially below developing-country requirements. UNEP’s 2025 assessment estimated annual needs of US$310–365 billion by 2035, compared with international public flows of US$26 billion in 2023. UNEP – UN Environment Programme
- Wealth taxation and restrictions on luxury emissions can contribute to fiscal equity and mitigation, but their effectiveness depends on design, economic incidence, enforceability and the use of revenues. They cannot replace energy-system transformation.
- A credible policy framework must combine emissions measurement, industrial decarbonisation, targeted fiscal measures, adaptation investment, financial supervision and protection for vulnerable populations.
The decisive distinction for public authorities is between who owns capital, who controls emissions-producing decisions, who consumes carbon-intensive output, who bears climate damages and who finances the transition.
Climate Change, Financial Power and the Economics of Responsibility: Why Wealth Taxation Cannot Replace Industrial Decarbonisation
The growing political focus on the wealthiest emitters risks obscuring the economic mechanisms that determine global emissions, the financial consequences of climate disasters and the investment requirements of the energy transition.
Climate policy faces a contradiction that fiscal redistribution alone cannot resolve. The concentration of wealth and carbon-intensive consumption raises legitimate questions about economic responsibility, yet the technologies required to reduce emissions depend on capital formation, industrial investment and functioning energy markets. The International Energy Agency estimates that global energy investment will reach US$3.4 trillion in 2026, including US$2.2 trillion for cleaner energy technologies and related infrastructure. Meanwhile, governments must finance adaptation, protect households from rising adjustment costs and preserve industrial competitiveness. Taxing accumulated wealth may address inequality, but it cannot automatically change the physical processes responsible for greenhouse-gas emissions. The central policy question is therefore not whether financial power should face scrutiny, but whether governments can distinguish ownership, operational control and consumption from the mechanisms that actually reduce emissions.
The Numbers Expose a Structural Problem, Not a Single Class of Emitters
The European Commission’s Joint Research Centre estimates that global anthropogenic greenhouse-gas emissions reached 54.1 billion tonnes of CO₂ equivalent in 2025, excluding land use, land-use change and forestry, an increase of 0.7% compared with 2024. China, the United States, India, the European Union, Russia and Indonesia collectively accounted for approximately 62% of the global total. The distribution reflects electricity generation, manufacturing, transportation, agriculture and industrial development across economies whose technologies, energy resources and consumption structures differ substantially.
Fossil carbon dioxide accounted for 73.8% of global greenhouse-gas emissions in 2025, methane for 17.6%, nitrous oxide for 5.3% and fluorinated gases for 3.3%. These figures establish the physical scale of the problem: reducing emissions requires changes in energy production, industrial processes and infrastructure, rather than adjustments confined to the ownership of financial assets.
Historical responsibility introduces another dimension. The Intergovernmental Panel on Climate Change estimated cumulative net anthropogenic carbon-dioxide emissions of approximately 2,400 billion tonnes between 1850 and 2019, with 42% released between 1990 and 2019. The historical contribution of industrialised economies remains central to international burden-sharing, but current mitigation effectiveness depends on where emissions are produced today and which technologies can replace the processes generating them.
The distribution of household emissions is also unequal. The IPCC estimates that the highest-emitting 10% of households account for approximately 34–45% of global consumption-based household emissions. That is a compelling distributional finding, but the denominator matters: household consumption footprints cannot be treated as interchangeable with global industrial emissions inventories or with emissions allocated to shareholders through financial accounting.
Ownership of Carbon-Intensive Assets Is Not Proof of Causation
The distinction becomes decisive in the treatment of investment emissions. Under the Partnership for Carbon Accounting Financials methodology, portions of corporate greenhouse-gas emissions are attributed to investors and lenders according to their financial exposure. For listed equity and corporate bonds, the relevant attribution factor involves the financial exposure relative to enterprise value including cash.
This method provides useful information about portfolio exposure. It does not establish that the investor physically produced the attributed emissions or possessed exclusive authority over the industrial processes involved.
A company’s emissions can remain unchanged while its attributed financed emissions fluctuate because its enterprise valuation changes. Similarly, an investment institution can reduce its reported portfolio emissions by selling securities without altering the emissions of the underlying factory, power station or industrial installation. The transaction changes financial ownership; it does not necessarily change atmospheric releases.
International corporate reporting compounds the interpretative difficulty. Scope 1 emissions identify direct sources under the relevant organisational boundary, Scope 2 covers purchased energy and Scope 3 addresses indirect value-chain activities, including investments under Category 15. The same physical emissions can legitimately appear in different companies’ disclosures because the inventories represent different economic relationships. Adding overlapping disclosures without reconciling their boundaries risks presenting accounting allocations as additional physical emissions.
Corporate control nevertheless matters. A controlling shareholder may influence capital expenditure, board composition and technology strategy. Minority investors, bondholders and diversified asset managers possess different rights and constraints. The financial sector can influence decarbonisation through financing conditions and governance decisions, but its actual contribution must be established through investment behaviour and measurable operational outcomes.
The European Union’s own accounts demonstrate why boundaries matter. Eurostat estimated that the EU’s consumption-based greenhouse-gas footprint reached 4.0 billion tonnes of CO₂ equivalent in 2023, compared with 3.3 billion tonnes associated with production by EU-resident economic units. The consumption footprint was approximately 21% higher. Between 2013 and 2023, production-related emissions declined by 18.6%, while the consumption footprint declined by 12.9%. Domestic emissions reductions and the environmental effects of European final demand are therefore related but different achievements.
Disaster Recovery Generates Revenue While Destroying Economic Wealth
The financial economy of climate disasters reveals an equally important distinction between commercial activity and aggregate welfare. According to Munich Re, natural disasters generated approximately US$224 billion in worldwide economic losses during 2025, of which US$108 billion were insured. Swiss Re independently estimated US$220 billion in economic losses and US$107 billion in insured losses under its methodology.
These estimates establish substantial financial damage, not the market value of reconstruction contracts. Insurance payments, physical losses and restoration revenues belong to different accounting categories and cannot simply be added together.
Disasters create demand for construction, emergency logistics, engineering, insurance services and infrastructure replacement. Individual businesses may earn substantial revenues from these activities, but reconstruction expenditure frequently replaces capital that previously existed. A damaged bridge rebuilt through public expenditure contributes to measured economic activity without necessarily increasing the infrastructure available before the disaster.
The macroeconomic consequences are particularly severe where governments lack fiscal flexibility. The International Monetary Fund’s February 2025 analysis found that disasters tend to reduce investment in emerging and developing economies, while countries with limited fiscal space experience more persistent economic damage. Reconstruction may support short-term demand without fully compensating for lost production, disrupted exports or destroyed assets.
The insurance system illustrates why commercial exposure cannot be equated with a preference for increasing disasters. Insurers receive premiums but also incur claims, capital costs and underwriting liabilities. Swiss Re estimates that insured natural-catastrophe losses have followed a long-term real growth trend of approximately 5–7% annually. Its 2026 analysis also projects potential insured losses of US$186 billion in a 2030 trend year, with substantially higher losses under a severe-event scenario.
Diversified investment institutions can simultaneously hold recovery companies, insurers, infrastructure assets, manufacturers and property-related investments. Profits in one sector may coexist with losses elsewhere. Establishing a financial incentive to obstruct mitigation would require evidence that net gains from worsening climate conditions outweigh portfolio-wide damage and that identifiable investors used their governance influence to delay emissions reductions. Ownership of reconstruction businesses alone does not establish either proposition.
Adaptation Finance Is Constrained by Sovereign Budgets, Not Merely Private Capital
The international financing imbalance is substantial. UNEP’s 2025 Adaptation Gap Report estimated annual adaptation requirements for developing countries of US$310–365 billion by 2035, compared with US$26 billion in international public adaptation finance during 2023 under its reporting framework.
The OECD’s separate May 2026 assessment recorded US$136.7 billion in total climate finance provided and mobilised by developed countries during 2024, including US$34.7 billion assigned to adaptation. These amounts are not directly interchangeable with UNEP’s figures because they employ different coverage, attribution rules and reference periods.
The composition of financing is as consequential as its volume. Loans represented approximately 67% of public climate finance in 2024, equivalent to US$68.5 billion, while grants accounted for approximately 29%, or US$29.7 billion. These proportions concern public climate finance overall, not adaptation alone. Nevertheless, the prevalence of debt instruments matters for countries already facing restricted fiscal space, disaster exposure and external financing pressures.
The COP29 agreement adopted in November 2024 established a goal of at least US$300 billion annually by 2035 for developing-country climate action, alongside a broader objective of mobilising at least US$1.3 trillion annually. Neither figure constitutes a dedicated adaptation allocation, and announced objectives should not be confused with money actually disbursed or infrastructure completed.
The economic rationale for preventive investment is strong. The World Bank estimated that resilient infrastructure in low- and middle-income countries could generate approximately US$4.2 trillion in net benefits over the lifetime of new infrastructure, with an estimated four dollars in benefits for each dollar invested under its modelling assumptions.
Yet flood defences, early-warning systems and essential infrastructure often generate public benefits without predictable commercial revenues. Their financing therefore depends on government budgets, development institutions, concessional resources and effective procurement. The question is not simply how to attract investors, but how to finance economically valuable protection without creating unsustainable sovereign liabilities.
Europe’s Climate Architecture Is Becoming an Industrial Competitiveness Test
The European Union’s regulatory framework now connects long-term environmental objectives with substantial financial and industrial obligations. The amended European Climate Law establishes at least a 55% reduction in net greenhouse-gas emissions by 2030, a 90% reduction by 2040, both relative to 1990, and climate neutrality by 2050. The 2040 framework requires at least an 85% domestic contribution, while permitting a limited contribution from qualifying international credits under specified conditions.
The EU Emissions Trading System recorded a further 1.3% reduction in covered emissions during 2025. Its auctions generated more than €43 billion in 2025, including approximately €24 billion directly benefiting member states. The cumulative auction revenues exceeded €258 billion between 2013 and 2025. These resources can support climate and energy investment, but receipts cannot be equated with completed projects or verified emissions reductions.
The next distributional test concerns ETS2, planned for 2028, which extends carbon-pricing obligations to covered fuels supplied to buildings and road transport. The Council’s October 2026 decision strengthened the market-stability mechanism, including an increase from 20 million to 40 million allowances in the release associated with the specified price condition. The adjustment reflects the political and economic sensitivity of passing carbon costs through fuel markets before households and businesses possess affordable alternatives.
National strategies demonstrate why identical European regulatory signals produce different industrial consequences.
Italy targets a renewable share of approximately 63.4% of gross final electricity consumption by 2030 under its updated National Energy and Climate Plan. Delivery depends on grid connections, permitting, generation investment and electricity-system flexibility. Without those conditions, industrial electrification can remain financially or technically constrained.
France adopted its third Stratégie nationale bas-carbone in July 2026, retaining a 50% greenhouse-gas reduction objective by 2030 relative to 1990. Its electricity-system characteristics strengthen the potential for electrification, but transport, buildings, industrial processes and imported consumption remain separate policy challenges.
Germany targets emissions reductions of 65% by 2030 and 88% by 2040, relative to 1990, with climate neutrality by 2045. Its March 2026 climate programme contains 90 measures, supported by €8 billion in additional funding for 2027–2030, with an estimated 27 million tonnes of additional CO₂ avoidance in 2030. These are programme estimates, not reductions already achieved. Their credibility depends on industrial implementation, infrastructure and competitive energy costs.
The United Kingdom, outside the EU’s principal carbon-market framework, operates under legally binding five-year budgets. Its Seventh Carbon Budget establishes a cumulative limit of 535 million tonnes of CO₂ equivalent for 2038–2042. Provisional territorial emissions reached 367 million tonnes in 2025, approximately 54% below the 1990 level. The distinction between annual emissions and cumulative statutory budgets remains critical to evaluating compliance.
The broader European problem is that regulations can establish the price of carbon, but they cannot by themselves deliver electricity networks, industrial equipment, financing or competitive production conditions. Those require coordinated investment decisions and operational capacity.
The Next 24 Months Will Expose the Cost of Misaligned Policy
Between October 2026 and October 2028, governments will face an increasingly concrete test of whether climate regulation, industrial financing and household protection are moving at compatible speeds. The EU’s planned ETS2 introduction in 2028 places immediate importance on fuel-price transmission, market stability and the availability of practical alternatives. Italy must convert electricity objectives into connected capacity; France must implement SNBC-3 across end-use sectors; Germany must begin delivering its funded climate programme; and the United Kingdom must maintain progress toward its statutory carbon budgets.
Three costs of policy failure are identifiable. Households without access to efficient housing or affordable transport alternatives may bear higher adjustment costs. Industrial enterprises facing expensive energy, infrastructure delays or uncertain investment conditions may postpone productive transformation or lose competitiveness. Governments may incur additional fiscal expenditure through poorly targeted subsidies, reconstruction obligations or compensation measures that do not reduce structural vulnerability.
The alternative is not to abandon distributional policy. It is to distinguish its objectives from those of industrial decarbonisation. Wealth-related taxes can contribute to fairness and public revenue; carbon pricing can influence covered emissions; financial supervision can improve risk management; and public investment can remove infrastructure constraints. None can substitute automatically for the others.
The economic cost of inaction will fall most heavily on vulnerable households, exposed public budgets and industries unable to finance technological adjustment. The cost of choosing the wrong instruments will be less visible but equally consequential: capital diverted without additional emissions reductions, fiscal resources committed without operational results and an industrial transition whose legal ambitions advance faster than its productive capacity.
By 2028, the relevant measure of climate-policy credibility will not be how much wealth governments have targeted or how much private capital has been labelled sustainable. It will be how much infrastructure has entered operation, which emissions have actually declined, whether productive investment has been preserved and who ultimately bears the costs of the transition.
Navigational Index
Pillar I — Carbon Responsibility, Economic Attribution and the Distribution of Emissions
Chapter 1. The Architecture of Global Emissions Responsibility : Production-based and consumption-based emissions; income distribution; historical responsibility; household demand; industrial development and the geographical distribution of carbon-intensive activity.
Chapter 2. Investment Emissions and the Limits of Ownership-Based Attribution : Financed-emissions methodologies; equity attribution; operational control; shareholder influence; supply-chain accounting; double-counting risks and the distinction between accounting responsibility and physical causation.
Chapter 3. The Political Economy of Climate Inequality : Wealth concentration, consumption externalities, income-related vulnerability, political influence, capital ownership and the distribution of mitigation costs.
Pillar II — Climate Damage, Financial Markets and Capital Allocation
Chapter 4. The Economics of Climate Disasters and Recovery Industries : Reconstruction, emergency services, insurance, infrastructure, industrial supply chains, disaster-restoration companies and the difference between sectoral revenue and economy-wide welfare.
Chapter 5. Institutional Investors and the Financial Incentives of Climate Risk : Diversified ownership, portfolio exposure, asset pricing, physical and transition risk, corporate governance and the conditions under which climate-related conflicts of interest may emerge.
Chapter 6. The International Political Economy of Adaptation : Developing-country vulnerabilities, financing gaps, sovereign debt, infrastructure resilience, public procurement, development institutions and international burden-sharing.
Pillar III — Strategic Governance, Industrial Transformation and Policy Effectiveness
Chapter 7. The Economic Limits of Wealth-Centred Climate Policy : Capital mobility, wealth taxation, investment incentives, carbon pricing, luxury-emissions regulation, distributional effects and the implications for investment in low-carbon technologies.
Chapter 8. European and National Policy Architecture : The European Union’s carbon-market framework; separate industrial, financial and fiscal implications for Italy, France, Germany and the United Kingdom; competitiveness and implementation constraints.
Chapter 9. Strategic Scenarios, Policy Instruments and the 2026–2031 Outlook : Alternative policy pathways, measurable indicators, public-finance priorities, regulatory options and final assessment of effective climate governance.
Master Abstract
Carbon emissions cannot be understood through ownership alone
The distribution of global greenhouse-gas emissions reflects overlapping forces: industrial production, energy generation, household consumption, technological infrastructure, income inequality, development patterns and capital allocation. These dimensions are economically connected, but they describe different relationships and therefore require different measures of responsibility.
An emissions inventory based on territorial production measures the gases released within a jurisdiction. A consumption-based inventory reallocates emissions to final demand, including those embodied in internationally traded goods. Financed-emissions accounting assigns portions of corporate emissions to capital providers through defined financial attribution methodologies. None is intrinsically illegitimate; each addresses a different analytical question.
The methodological error arises when financed emissions are interpreted as though equity ownership were equivalent to direct physical production or exclusive decision-making authority. Shareholders can influence corporate investment, governance and strategic direction, but the extent of that influence depends on voting rights, ownership concentration, financial arrangements, regulation and managerial discretion. It cannot be inferred solely from the value of a portfolio.
The converse proposition also requires rejection: ownership-based accounting is not meaningless merely because demand and energy systems contribute to emissions. Capital providers can influence the financing of infrastructure, technology selection and corporate transition strategies. The relevant issue is whether that influence is identifiable and consequential, not whether ownership can be treated as a complete explanation of emissions.
A defensible assessment must therefore avoid two opposing reductions: attributing industrial emissions exclusively to investors or absolving investors of influence because consumers ultimately purchase industrial output.
Disaster recovery creates revenue, but revenue is not equivalent to economic benefit
Climate-related disasters create substantial demand for reconstruction, engineering, insurance services, emergency logistics, cooling equipment, protective infrastructure and specialised restoration. Businesses supplying these goods and services may generate significant revenues and profits. Nevertheless, the expansion of recovery activity does not establish that climatic deterioration produces a net economic benefit for investors, much less for society.
From a national-accounting perspective, reconstruction expenditure can contribute to measured economic activity while replacing capital destroyed by a disaster. The expenditure constitutes production, but the underlying destruction reduces wealth and productive capacity. Consequently, an increase in reconstruction turnover cannot reasonably be interpreted as a corresponding increase in welfare.
At the financial level, a diversified institutional investor may hold companies that benefit from adaptation expenditure while simultaneously holding real estate, infrastructure, agricultural businesses, manufacturers and financial institutions exposed to climate losses. Whether the overall portfolio benefits depends on the relative size of those exposures, the timing of losses and gains, insurance arrangements, valuation effects and the investor’s capacity to diversify.
A claim that climate-related financial opportunities systematically encourage obstruction of mitigation would require evidence connecting financial incentives to corporate governance or public-policy behaviour. Holdings alone are insufficient. Relevant evidence would include documented lobbying, investment decisions, voting records, executive incentives and credible estimates of net portfolio exposure.
At the same time, the absence of proof of a generalised incentive does not exclude narrower conflicts of interest. Individual companies, investors or executives may possess concentrated exposures that make particular delays, subsidies or regulatory arrangements financially advantageous. Such cases should be evaluated individually rather than extrapolated to an entire wealth category.
Global decarbonisation is an industrial and financial transformation
The scale of required mitigation reinforces the distinction between distributional reform and system-level decarbonisation. UNEP’s October 2026 assessment identifies a substantial gap between existing national commitments and the emissions reductions needed for a pathway that returns warming to 1.5°C by the end of the century. Full implementation of current nationally determined contributions would reduce emissions by only 5–8% by 2030 and 11–15% by 2035, relative to 2025 levels, compared with reductions of 18% and 45% for the assessed return pathway. UNEP – UN Environment Programme
GLOBAL EMISSIONS REDUCTION PATHWAYS
Percentage reduction relative to 2025; UNEP 2026
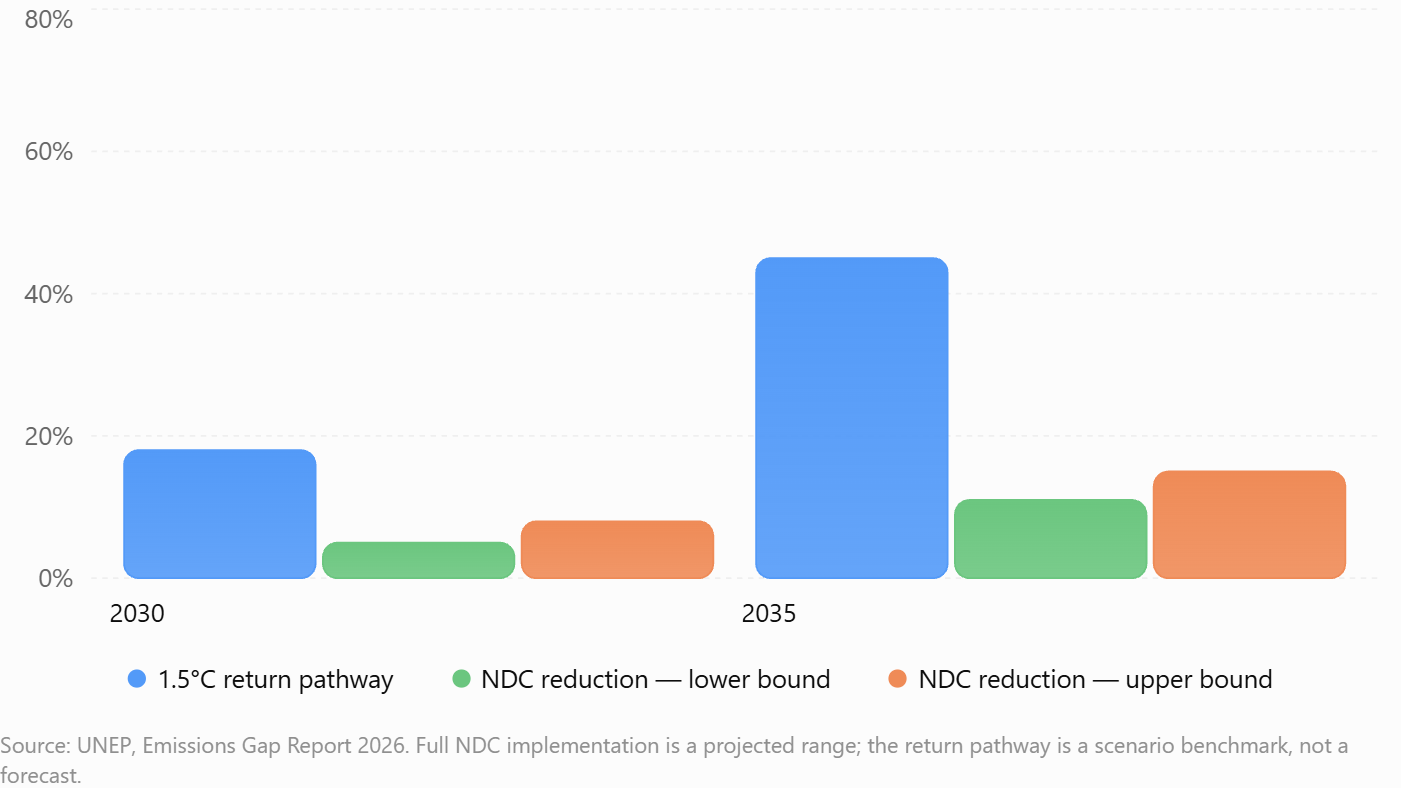
The policy implication is direct. Large reductions require coordinated changes in electricity generation, industrial heat, transportation, buildings, energy efficiency, methane control and investment in low-emission production processes. Measures directed at high-income households can complement these transformations, particularly where consumption is unusually carbon intensive, but cannot substitute for the restructuring of the systems supplying energy and industrial goods.
The European experience demonstrates that structural policy instruments can coincide with substantial reductions. According to the European Commission, emissions covered by the EU Emissions Trading System declined by 1.3% in 2025, following earlier reductions that have brought covered emissions to approximately half their 2005 level. This is not proof that every reduction was caused by carbon pricing alone; it does establish the scale and institutional relevance of sector-wide emissions governance. Climate Action
Climate vulnerability and unequal protection remain central governance problems
The unequal distribution of climate damages requires independent treatment from the attribution of emissions. Exposure to flood risks, heat stress, drought or infrastructure failure interacts with housing quality, geography, access to insurance, household savings, emergency services and institutional capacity.
Poorer households may experience substantially greater welfare losses from equivalent physical damage because recovery consumes a larger share of their disposable resources and accumulated assets. Similarly, developing countries with restricted fiscal space may find that disaster-related spending displaces investments in education, healthcare, infrastructure and long-term productivity.
The adaptation challenge is therefore simultaneously environmental, financial and developmental. It involves the availability and affordability of capital, the selection of economically viable projects, the allocation of public guarantees and the design of institutions capable of converting financing commitments into operational protection.
Wealth-related fiscal measures can contribute to adaptation financing where effectively implemented. Yet their practical value must be assessed against revenue stability, valuation difficulties, tax avoidance, cross-border coordination, investment effects and the capacity of recipient institutions to deploy funds.
The central governance objective should be measurable emissions reduction and reduced climate vulnerability, rather than the redistribution of financial ownership as an objective presumed sufficient to achieve either result.
Key Evidence Table
| Indicator | Verified value or status | Reference period | Definition and scope | Issuer and exact source |
|---|---|---|---|---|
| Required global GHG reduction | 18% | 2030 vs. 2025 | Lowest assessed 1.5°C return pathway | UNEP, Emissions Gap Report 2026 |
| Required global GHG reduction | 45% | 2035 vs. 2025 | Same pathway | UNEP, Emissions Gap Report 2026 |
| Required global GHG reduction | 69% | 2040 vs. 2025 | Same pathway | UNEP, Emissions Gap Report 2026 |
| Projected reduction under full NDC implementation | 11–15% | 2035 vs. 2025 | Existing nationally determined contributions | UNEP, Emissions Gap Report 2026 |
| Adaptation financing needs | US$310–365bn/year | 2035 projection | Developing countries; alternative estimation approaches | UNEP, Adaptation Gap Report 2025 |
| International public adaptation finance | US$26bn | 2023 | International public flows to developing countries | UNEP, Adaptation Gap Report 2025 |
| EU ETS emissions change | −1.3% | 2025 vs. 2024 | Emissions within reported EU ETS coverage | European Commission, Verified ETS emissions release, April 2026 |
| EU ETS cumulative reduction | Approximately 50% | Since 2005 | Sectors covered by the trading system; coverage changes require care in comparisons | European Commission, same release |
Source qualification: the 2025 UNEP adaptation estimates are retained as the latest fully accessible quantified baseline established here. The 2026 adaptation publication is dated 28 October 2026, but the available repository record does not establish a replacement numerical series. Its publication therefore cannot be treated as proof that the 2025 figures remain the latest estimates. Wedocs+1
Competing Explanations and Economic Mechanisms
Three explanations deserve separate examination because they imply different policy priorities.
| Hypothesis | Diagnostic support | Evidence against a broad interpretation | Decisive indicator | Current assessment |
|---|---|---|---|---|
| Concentrated ownership is a primary driver of emissions | Capital owners can influence financing, governance and investment strategy | Ownership does not uniquely determine production technology, energy demand or regulatory constraints | Evidence of investor decisions changing emissions outcomes | Plausible in specific cases; not established as a comprehensive causal explanation |
| Climate disasters create a general financial incentive to delay mitigation | Some reconstruction and adaptation businesses benefit from increased demand | Climate damages can impair other assets, public finances and economic productivity | Net portfolio gains and documented influence on mitigation decisions | Not established as a general proposition |
| Climate outcomes are chiefly determined by energy systems, industrial technology, policy and investment | Sectoral decarbonisation pathways and observed regulatory outcomes support the importance of system-wide mechanisms | Ownership concentration and unequal consumption can independently affect emissions and political choices | Sectoral emissions, capital expenditure, policy implementation and energy-system changes | Strongest general explanation, without excluding distributional and governance effects |
These explanations are not necessarily mutually exclusive. Ownership, demand and public policy interact, and the relative importance of each mechanism varies by sector and jurisdiction.
Principal Gaps and Watch Indicators
The most consequential unresolved question is not whether climate damages create commercial opportunities, but whether identifiable market participants obtain sufficient net benefit from continued emissions to influence mitigation decisions in economically significant ways.
Four documentary requirements would materially strengthen that assessment:
- Consistent emissions accounting: comparable production-, consumption- and financed-emissions estimates, with explicit rules distinguishing accounting allocation from causal responsibility.
- Investor-level exposure analysis: sufficiently disaggregated portfolio data covering carbon-intensive holdings, adaptation businesses and climate-sensitive assets, including losses as well as gains.
- Documented governance influence: verifiable voting records, lobbying disclosures, financing decisions and corporate investment changes connecting investor preferences with emissions-related outcomes.
- Policy-effectiveness evidence: comparable post-implementation estimates for carbon pricing, wealth-related taxation, targeted luxury-consumption measures, clean-energy investment and adaptation finance.
For the European Union, the principal watch indicators should include verified sectoral emissions, the deployment of EU ETS revenues, industrial investment in low-emission capacity and changes in electricity-system carbon intensity. National assessments of Italy, France, Germany and the United Kingdom must additionally distinguish different energy mixes, industrial structures, fiscal constraints and regulatory systems.
For developing economies, the priority observations are adaptation finance actually disbursed, concessionality, debt exposure, project implementation and measurable reductions in vulnerability.
The 2026–2031 policy test is whether governments can achieve material emissions reductions while expanding access to reliable energy, protecting productive investment and increasing resilience without transferring disproportionate transition costs to economically vulnerable households.
Net assessment: Climate policy is most defensible when it treats inequality as a consequential dimension of a larger economic transformation, rather than treating wealth concentration as a complete causal explanation of climate change. The effectiveness of public intervention should be measured by emissions avoided, resilience gained, capital mobilised and distributional outcomes—not by the visibility of the population targeted.
CLIMATE, CAPITAL & ECONOMIC POWER
An interactive assessment of emissions responsibility, carbon attribution, climate-related financial incentives, adaptation investment and effective governance.
Outlook: 2026–2031
Geographic scope: GLOBAL / EUROPE
Global GHG emissions relative to 2025; 1.5°C return pathway.
Global GHG emissions relative to 2025; same assessed pathway.
Developing countries, projected for 2035.
Adaptation flows to developing countries, observed in 2023.
The Global Mitigation Gap
3D Emissions-Reduction Comparison
Select a target year to compare the reductions implied by full implementation of current national commitments with the benchmark for a 1.5°C return pathway.
Source: UNEP, Emissions Gap Report 2026. Percentages compare global greenhouse-gas emissions against 2025 levels. Benchmarks are scenario requirements, not observed outcomes. Charts use a fixed 0–80% scale. NDC bounds describe alternative projection values, not independent additive reductions.
Adaptation Finance: Scale and Exposure
A comparative view of public international financing recorded in 2023 and developing-country adaptation requirements estimated for 2035.
Source: UNEP, Adaptation Gap Report 2025. All amounts in US dollars per year. The bars share a US$0–365 billion scale. The needs figures are estimates; the 2023 public-flow figure is historical.
Emissions, Ownership and Causation
Corporate emissions arise through production technologies, energy inputs and economic demand. Financial ownership can shape investment and governance, but assigning emissions to capital providers does not in itself establish physical causation. Select an analytical mechanism below.
Multiple economic mechanisms interact. Accounting allocation, operational influence and causal contribution must be assessed separately.
Territorial and facility-level inventories identify emissions associated with physical production and energy use. They measure releases directly but do not, on their own, allocate responsibility across final consumers or financing institutions.
Conceptual relationship diagram. The three mechanisms overlap; arrows do not represent quantitative contributions or independent causal shares. No allocation percentages are inferred.
The Financial Incentive Question
Disaster-Recovery Revenue
Extreme weather can increase demand for reconstruction, restoration, protective engineering, logistics and associated services. Revenue growth does not necessarily imply higher economic welfare.
Portfolio-Wide Damage
Climate-related physical losses can affect property, agriculture, infrastructure, businesses, public finances and supply chains, potentially offsetting gains in recovery-oriented activities.
Governance and Influence
Establishing an incentive to obstruct mitigation requires evidence of net economic benefit and identifiable governance, financing or policy influence—not simply ownership of exposed companies.
Alternative Governance Pathways
Integrated Climate Governance
Combines energy and industrial decarbonisation, targeted fiscal instruments, financial supervision, adaptation investment and distributional safeguards.
Decision priority: Measure physical emissions reductions and resilience improvements while tracking fiscal and investment consequences.
Principal implementation risk: Fragmented responsibilities and inadequate coordination between industrial, fiscal and financial authorities.
These are qualitative policy archetypes, not computed forecasts. They have no invented effectiveness scores, probabilities, costs or emissions impacts.
Institutional Evidence Register
| Indicator | Value | Period | Definition | Institution |
|---|---|---|---|---|
| Global mitigation benchmark | −18% | 2030 | 1.5°C return pathway vs 2025 GHG emissions | UNEP · 2026 |
| Global mitigation benchmark | −45% | 2035 | Same scenario benchmark and baseline | UNEP · 2026 |
| Global mitigation benchmark | −69% | 2040 | Same scenario benchmark and baseline | UNEP · 2026 |
| Full NDC implementation | −5% to −8% | 2030 | Projected reduction vs 2025 | UNEP · 2026 |
| Full NDC implementation | −11% to −15% | 2035 | Projected reduction vs 2025 | UNEP · 2026 |
| Developing-country adaptation needs | US$310–365B/yr | 2035 | Estimated annual financing requirement | UNEP · 2025 |
| International public adaptation finance | US$26B | 2023 | Public flows to developing countries | UNEP · 2025 |
| EU ETS emissions change | −1.3% | 2025 vs 2024 | Covered emissions within EU ETS scope | European Commission · 2026 |
Institutional Documentation
PILLAR I — CARBON RESPONSIBILITY, ECONOMIC ATTRIBUTION AND THE DISTRIBUTION OF EMISSIONS
Institutional Intelligence Assessment | Global Economic and Climate Governance | 31 October 2026
Chapter 1. The Architecture of Global Emissions Responsibility
The Global Emissions System: Production, Consumption and the Economic Geography of Carbon
The international distribution of greenhouse-gas emissions cannot be adequately explained through a single measure of national responsibility, household income, industrial production or financial ownership. The global carbon system is an interconnected structure in which energy resources, industrial technologies, international trade, consumption patterns, infrastructure, capital formation and public regulation determine the location, scale and persistence of emissions. The distinction is fundamental to economic policymaking because the same physical emissions can be associated with different actors depending on whether the analytical objective is to identify the territory where greenhouse gases enter the atmosphere, the final consumer whose demand sustains production, the enterprise controlling a productive installation, the investor financing that enterprise or the jurisdiction possessing the regulatory authority to influence its behaviour. These are not competing descriptions of an identical responsibility: they are complementary measurements of different relationships within the production and distribution system. Treating them as interchangeable introduces attribution errors that can distort international burden-sharing, corporate accountability, investment policy and the evaluation of climate interventions.
The most recent comprehensive emissions estimates published by the European Commission’s Joint Research Centre illustrate the continuing predominance of large-scale economic activity in determining the global distribution of territorial emissions. According to the September 2026 edition of the Emissions Database for Global Atmospheric Research, global anthropogenic greenhouse-gas emissions reached 54.1 billion tonnes of carbon-dioxide equivalent in 2025, excluding land use, land-use change and forestry, an increase of approximately 380 million tonnes, or 0.7%, compared with 2024. Including the land-use and forestry component changes the accounting perimeter and produces a global estimate of approximately 55.0 billion tonnes of CO₂ equivalent. These figures should not be confused with carbon-dioxide emissions from energy combustion alone, nor should their different coverage be used interchangeably when comparing growth rates, national contributions or mitigation targets. The European Commission’s dataset includes carbon dioxide, methane, nitrous oxide and fluorinated gases, converted into common carbon-dioxide-equivalent units using specified global-warming-potential conventions. The methodological distinction matters because fossil-fuel combustion dominates carbon-dioxide emissions, whereas agriculture, waste management, industrial processes, gas infrastructure and other activities make substantial contributions to non-CO₂ greenhouse gases. GHG Emissions of All World Countries — European Commission, Joint Research Centre — September 2026. publications.jrc.ec.europa.eu
The geographical concentration of emissions remains pronounced. China, the United States, India, the European Union, Russia and Indonesia collectively accounted for approximately 62% of global greenhouse-gas emissions in 2025, according to the same EDGAR assessment, while representing approximately 50.1% of the world’s population, 62.3% of global gross domestic product and 63% of fossil-fuel consumption. These relationships establish that global emissions depend heavily on the configuration of industrial and energy systems across a relatively limited number of major economies. They do not establish that the populations of those economies have comparable individual responsibility, nor that their emissions are driven by the same industries or consumption groups. Manufacturing intensity, electricity generation, hydrocarbon extraction, agricultural land use, urbanisation, export specialisation and household purchasing power differ considerably across jurisdictions. A large territorial emissions total may reflect domestic final demand, production destined for foreign consumers, energy-intensive intermediate goods or a combination of these factors. Equally, a relatively small territorial share does not necessarily indicate a proportionately small economic contribution to global emissions if a country imports substantial quantities of emissions-intensive products. GHG Emissions of All World Countries — European Commission, Joint Research Centre — September 2026. edgar.jrc.ec.europa.eu
The geographical picture also requires attention to the distinction between emission levels and changes in those levels. The 2025 data show that the United States recorded an increase of approximately 131.5 million tonnes of CO₂ equivalent, or 2.2%, compared with 2024, whereas China’s greenhouse-gas emissions increased by approximately 9.6 million tonnes, or 0.1%, and India’s emissions declined slightly, by approximately 0.2%. The European Union registered a further reduction of approximately 0.2%. These developments are significant because they prevent a static interpretation in which emerging economies are assumed always to be responsible for the latest incremental growth while developed economies are assumed always to be reducing emissions. The long-term redistribution of industrial activity toward Asia remains important, but annual changes are affected by weather conditions, fuel substitution, electricity demand, economic cycles, energy prices, industrial output and policy implementation. A defensible assessment must examine current marginal changes separately from absolute annual emissions and cumulative historical contributions. Six of the 16 Major Emitters Reduced Their Emissions in 2025 — European Commission, Joint Research Centre — September 2026. Joint Research Centre
The composition of global emissions further reinforces the need to analyse physical production systems rather than relying exclusively on ownership or income categories. EDGAR estimates that fossil carbon dioxide represented 73.8% of global greenhouse-gas emissions in 2025, methane 17.6%, nitrous oxide 5.3% and fluorinated gases 3.3%. Between 1990 and 2025, fossil carbon-dioxide emissions increased by approximately 76.3%, methane by nearly 33%, nitrous oxide by approximately 48%, while fluorinated-gas emissions increased substantially faster from a smaller starting base. These different trajectories demonstrate that mitigation policies must address several industrial and biological processes simultaneously. Electricity generation, manufacturing and transport are central to carbon-dioxide reduction; methane abatement requires interventions in fossil-energy systems, agriculture and waste management; and nitrous-oxide mitigation depends significantly on agricultural and industrial practices. The technical feasibility, capital requirements, monitoring arrangements and policy instruments differ across these sectors, meaning that a universal explanation based on household wealth or shareholder identity is insufficient as a basis for operational mitigation programmes. GHG Emissions of All World Countries — European Commission, Joint Research Centre — September 2026. edgar.jrc.ec.europa.eu
Territorial Emissions and the International Division of Production
Production-based accounting provides the principal foundation for national greenhouse-gas inventories and many international climate commitments. Under this approach, emissions are associated with the physical activities taking place within a defined geographical boundary, subject to the conventions governing sectors such as international aviation, maritime transport and land use. The central advantage is institutional: governments possess legal and administrative powers over power stations, industrial installations, transport systems, agricultural activities and other emissions-producing operations located within their jurisdictions. National inventory systems therefore make it possible to connect measured releases with enforceable regulations, investment programmes and public-policy targets. The limitation is that territorial emissions do not necessarily correspond to the emissions embodied in the goods and services consumed by residents. In a highly integrated international economy, production may be relocated through trade without the final demand for carbon-intensive products changing in proportion to the relocation.
Consumption-based accounting addresses this limitation by reallocating emissions throughout supply chains to the final users of goods and services. The economic rationale is that households, governments and enterprises generate demand that requires production in domestic or foreign locations. A European consumer purchasing a manufactured product imported from Asia contributes to the market demand for production whose direct industrial emissions may have been recorded in the exporting jurisdiction. Conversely, an exporting economy can register substantial territorial emissions while producing goods ultimately consumed elsewhere. Consumption-based inventories consequently help identify the geographical separation between the location of production and the location of economic demand. However, they rely on modelling choices, input-output relationships, trade data and assumptions concerning production technologies. Their value lies in revealing the emissions implications of final expenditure and international exchange, not in proving that consumers exercise exclusive control over the technologies used by producers.
Eurostat’s February 2026 publication offers a particularly relevant comparison. For 2023, the European Union’s greenhouse-gas footprint associated with the final consumption of goods and services amounted to approximately 4.0 billion tonnes of CO₂ equivalent, while emissions generated through the production activities of EU-resident economic units amounted to approximately 3.3 billion tonnes. In the statistical framework used by Eurostat, the consumption footprint was therefore approximately 21% higher than production-based emissions. The distinction is important because the production measure is based on air-emissions accounts associated with resident economic units, not simply an inventory of emissions released physically within EU territory. Eurostat explicitly differentiates territorial inventories, production accounts and consumption footprints, recognising that international transport, resident activities and trade can create meaningful differences between the resulting aggregates. What Is the EU’s Greenhouse Gas Footprint per Capita? — Eurostat — February 2026. Eurostat
The significance of these figures extends beyond accounting. Between 2013 and 2023, Eurostat reported a decline of approximately 18.6% in EU production-based greenhouse-gas emissions and 12.9% in the consumption-based footprint. The difference in the pace of reduction suggests that domestic production emissions declined more rapidly than the emissions associated with final European consumption during that period. This does not establish that every difference resulted from industrial relocation: changes in imports, exports, domestic energy systems, household expenditure, manufacturing structures and technological developments can all influence the relationship. It does, however, demonstrate why a climate-policy assessment based exclusively on domestic production can overstate the extent to which the environmental consequences of consumption have been reduced. For policymakers concerned with international competitiveness, trade exposure and environmental effectiveness, simultaneous monitoring of production and consumption emissions is therefore considerably more informative than reliance on either indicator alone. What Is the EU’s Greenhouse Gas Footprint per Capita? — Eurostat — February 2026. Eurostat
Table 1 — EU greenhouse-gas accounting: production versus consumption
| Indicator | Verified value | Reference period | Economic interpretation |
|---|---|---|---|
| EU consumption-based GHG footprint | 4.0 GtCO₂eq | 2023 | Emissions embodied in final EU consumption |
| EU production-based GHG emissions | 3.3 GtCO₂eq | 2023 | Emissions generated by resident economic activities |
| Consumption footprint relative to production | Approximately +21% | 2023 | Higher emissions attributed to EU final demand |
| Change in consumption footprint | −12.9% | 2013–2023 | Reduction in consumption-related emissions |
| Change in production emissions | −18.6% | 2013–2023 | Faster reduction in production-related emissions |
| EU consumption footprint per inhabitant | 9.0 tCO₂eq | 2023 | Per-capita measure of consumption-associated emissions |
Source: What Is the EU’s Greenhouse Gas Footprint per Capita? — Eurostat — February 2026. Figures are reported at the published precision; the ratio must not be recalculated from rounded aggregates as though those values were exact.
An economically coherent approach requires the simultaneous recognition of supply-side and demand-side determinants. Industrial installations emit because particular production processes require energy and materials, but the scale and composition of output depend in part on demand. Consumers influence markets through purchasing decisions, yet their choices are constrained by available technologies, infrastructure, regulation, prices and income. Governments influence both sides by determining energy-market rules, taxes, subsidies, building standards, transport infrastructure and industrial regulation. Capital providers influence the availability and terms of financing, although the strength of their influence differs considerably between concentrated controlling ownership and diversified minority holdings. The physical emissions of a steelworks, cement plant or power station should consequently be distinguished from the economic relationships that sustain the facility’s operation. This distinction permits analysts to identify which policy instrument is capable of changing emissions rather than assigning a single comprehensive responsibility to an actor who participates in only one part of the production system.
The Geography of Fossil Carbon and the Changing Industrial Balance
The international distribution of fossil-fuel carbon dioxide reveals a different but complementary picture from the distribution of total greenhouse gases. The Global Carbon Budget 2025 assessment estimates that worldwide fossil carbon-dioxide emissions reached approximately 38.1 billion tonnes in 2025, with projected annual growth of approximately 1.0%. This estimate refers to fossil carbon dioxide and incorporates particular conventions for cement-related carbonation; it is therefore not equivalent to the broader EDGAR greenhouse-gas total of 54.1 billion tonnes of CO₂ equivalent. The International Energy Agency’s Global Energy Review 2026 separately estimated energy-related carbon-dioxide emissions from fuel combustion and industrial processes at nearly 38.4 billion tonnes in 2025, increasing by approximately 145 million tonnes, or 0.4%. The figures should not be averaged or presented as contradictory measurements of precisely the same quantity because their statistical construction, revisions and treatment of individual processes are not identical. Global Carbon Budget 2025 — Global Carbon Project, Earth System Science Data — 2026. Global Energy Review 2026: CO₂ Emissions — International Energy Agency — April 2026. Global Carbon Budget 2025+1
The importance of the IEA results lies in the relationship between emissions, economic expansion and energy intensity. While global energy-related carbon-dioxide emissions increased by approximately 0.4% in 2025, the agency reported global economic growth of approximately 3.1%, indicating that emissions increased substantially more slowly than economic output. This reflects an improvement in the emissions intensity of global economic activity, although the continued increase in absolute emissions shows that the transformation remained insufficient to generate an aggregate decline in that reporting period. The IEA attributed an increase of approximately 185 million tonnes of carbon dioxide to fuel combustion, partially offset by a decline of approximately 40 million tonnes associated with industrial processes. The divergence illustrates the analytical importance of distinguishing improvements in carbon intensity from absolute decarbonisation: an economy can generate more output for each tonne of carbon dioxide while still releasing more carbon dioxide in total. Global Energy Review 2026: CO₂ Emissions — International Energy Agency — April 2026. IEA
The 2024 fossil-carbon breakdown presented in the Global Carbon Budget identifies coal as accounting for approximately 41%, oil 32%, natural gas 21%, cement 4%, flaring 1% and other sources 1% of estimated global fossil carbon-dioxide emissions. These shares identify the underlying dependence on fossil-energy systems and carbon-intensive industrial processes. They also indicate why climate mitigation requires investment across distinct infrastructure systems with different economic characteristics. Coal-fired electricity can be affected by changes in generation capacity and power-sector dispatch; petroleum consumption is deeply connected to transportation and petrochemical demand; natural gas is used in electricity, heating and industry; and cement production includes process emissions that cannot be eliminated simply by substituting renewable electricity. The technological and financial demands of decarbonising these activities therefore differ, as do their implications for employment, energy security, investment risk and international trade. Global Carbon Budget 2025 — Global Carbon Project, Earth System Science Data — 2026. Global Carbon Budget 2025
Historical Emissions and the Limits of Present-Day Comparisons
The historical accumulation of carbon dioxide introduces a temporal dimension that cannot be resolved through current annual inventories. Climate change is affected by accumulated greenhouse-gas concentrations, and the long atmospheric persistence of a substantial portion of emitted carbon dioxide means that past industrial activity continues to influence present and future warming. Consequently, a country’s annual emissions share in 2025 does not fully represent its historical contribution to the stock of anthropogenic carbon dioxide. Industrialisation occurred at different periods across regions, and the geographical distribution of cumulative emissions reflects the chronology of fossil-energy use, manufacturing development, land-use transformation and economic expansion.
The Intergovernmental Panel on Climate Change estimated historical cumulative net anthropogenic carbon-dioxide emissions from 1850 to 2019 at approximately 2,400 ± 240 billion tonnes. Of this total, approximately 58% occurred between 1850 and 1989 and approximately 42% between 1990 and 2019. The IPCC additionally estimated that the decade from 2010 to 2019 accounted for approximately 17% of the historical cumulative total from 1850 to 2019. These values demonstrate the simultaneous relevance of early industrialisation and contemporary emissions growth. Historical responsibility cannot be allocated solely according to current annual releases, but neither can contemporary mitigation obligations be designed without considering current industrial capacity and the distribution of future emissions. Climate Change 2022: Mitigation of Climate Change, Summary for Policymakers — Intergovernmental Panel on Climate Change — April 2022. IPCC
The same IPCC assessment indicates that regional contributions to historical fossil and industrial carbon dioxide differ markedly from contributions associated with land-use change. Regions with early industrialisation accumulated large fossil-energy emissions, whereas land-use emissions follow different geographical and historical patterns. The IPCC estimated that least-developed countries contributed less than 0.4% of historical cumulative fossil and industrial carbon-dioxide emissions between 1850 and 2019, while small island developing states contributed approximately 0.5%. The resulting disparity is fundamental to international discussions concerning equity, development, adaptation finance and differentiated policy obligations, but it does not eliminate the need for emissions reductions in economies where present or future industrial activity represents a substantial share of the global total. Climate Change 2022: Mitigation of Climate Change, Summary for Policymakers — Intergovernmental Panel on Climate Change — April 2022. IPCC
The economic implications are particularly important for the distinction between historical responsibility and present-day fiscal capacity. A country may possess a large cumulative emissions legacy while achieving relatively low current emissions growth, whereas another may have a smaller historical contribution but rapidly expanding industrial activity and increasing financial capacity. The formulation of international commitments must recognise both dimensions without collapsing them into an artificial common indicator. Historical contributions inform the distributional argument for financial support and differentiated responsibilities; current emissions determine where physical reductions can most directly influence future warming; technological capabilities determine which transformations are feasible; and institutional capacity influences whether commitments can be translated into measurable outcomes.
Income Distribution and Household Carbon Footprints
Income-related differences in greenhouse-gas emissions constitute an additional dimension of responsibility that crosses national boundaries. Higher-income households generally have greater purchasing power, consume more energy-intensive goods and services in absolute terms and possess greater access to high-emissions transport and residential consumption. Yet the relationship between income and emissions is not determined by expenditure alone. Electricity generation, urban infrastructure, transport availability, climate conditions, dwelling efficiency, public services and national industrial structures influence the carbon intensity of a given level of household consumption. Consequently, comparable incomes can be associated with different emissions footprints across countries, while comparable emissions levels can arise from substantially different combinations of private expenditure and public infrastructure.
The IPCC’s Sixth Assessment Report concluded, with high confidence, that the 10% of households with the highest per-capita emissions account for approximately 34–45% of global consumption-based household greenhouse-gas emissions, compared with approximately 40–53% for the middle 40% and 13–15% for the bottom 50%. The broad ranges reflect differences among the underlying studies and methodologies. They should not be combined indiscriminately by selecting one endpoint from each category, since the resulting figures may originate from different calculations. Equally, these are shares of the household consumption-based emissions universe rather than automatically shares of all emissions directly released by the global economy. The comparison establishes a pronounced inequality in household carbon footprints, but it does not by itself determine how total industrial emissions should be causally divided among consumers, enterprises, shareholders and governments. Climate Change 2022: Mitigation of Climate Change, Summary for Policymakers — Intergovernmental Panel on Climate Change — April 2022. IPCC
Table 2 — Global distribution of household consumption-based emissions
| Household emissions group | Share of global household consumption-based GHG emissions | Interpretation |
|---|---|---|
| Highest-emitting 10% | 34–45% | Disproportionately large emissions associated with high individual consumption footprints |
| Middle 40% | 40–53% | Substantial aggregate emissions associated with broad consumption activity |
| Lowest-emitting 50% | 13–15% | Relatively limited consumption-related emissions despite representing half of households |
Source: Climate Change 2022: Mitigation of Climate Change, Summary for Policymakers — Intergovernmental Panel on Climate Change — April 2022, section B.3.4. Published ranges come from different estimates and must not be treated as a single additive distribution.
This distribution carries important consequences for the design of consumption-related mitigation measures. High-emitting consumption can be a legitimate target for taxation, efficiency regulation and behavioural incentives because the corresponding emissions may be disproportionately concentrated among households possessing greater ability to absorb economic adjustments. However, policies that reduce high-income consumption do not necessarily produce proportionate reductions in total industrial emissions unless the affected consumption is directly associated with substantial physical emissions and producers respond accordingly. A restriction on a highly carbon-intensive activity can generate measurable reductions, while a general reduction in financial wealth may have a less direct relationship with emissions if it does not materially change production technology, consumption behaviour or investment allocation. The principal policy distinction is therefore between measures designed to influence emissions-producing activity and measures designed primarily to redistribute purchasing power or financial assets.
Key Judgments — Chapter 1
Global emissions are principally determined by the interaction of industrial production, energy systems, final demand, technological choices and public institutions. Territorial, consumption-based and historical emissions measures reveal different aspects of this system, while household footprint analysis identifies the uneven distribution of consumption-related emissions across income and expenditure groups. The current evidence supports simultaneous attention to high-emitting individuals, major industrial economies and the structural transformation of fossil-energy systems. It does not support the exclusion of any of these dimensions, nor the interpretation of a single accounting category as a complete measure of physical causation or exclusive responsibility.
What would change the assessment: Consistent cross-country evidence demonstrating that a particular population or ownership group exercises decisive control over a materially larger share of emissions-producing activities than is established by existing territorial, consumption and financial accounts would justify a revision in the relative emphasis placed on that group. Such evidence would need to demonstrate mechanisms of control and changes in physical emissions, rather than relying exclusively on proportional allocation conventions.
Open official record: The continuing reconciliation of national emissions inventories, EDGAR estimates, consumption-based footprint accounts and updated supply-chain datasets remains essential, particularly where different reporting conventions produce substantial differences in apparent national responsibility.
Chapter 2. Investment Emissions and the Limits of Ownership-Based Attribution
Financial Ownership Is an Accounting Relationship, Not a Complete Theory of Carbon Causation
Principal judgment: Financed-emissions accounting is a legitimate instrument for measuring the greenhouse-gas exposure associated with loans and investments, but its results must not be confused with exclusive causal responsibility, operational control or evidence that an investor’s decisions generated the emissions attributed to a portfolio. The distinction is essential for financial supervision, corporate governance and climate-policy effectiveness because the accounting architecture is designed to measure economic association and facilitate disclosure, whereas causal analysis must establish whether an investor possesses the power, incentives and practical ability to alter emissions-producing decisions.
The relationship between capital ownership and industrial emissions is considerably more complex than a proportional division of a company’s physical releases among its shareholders. Corporations operate within production networks shaped by energy systems, regulatory requirements, commercial contracts, technology, labour, infrastructure and demand. Their financial structure determines how those activities are funded and how the resulting economic returns are distributed, but the ownership structure does not necessarily determine the operational characteristics of production. An investor may hold ordinary shares without possessing meaningful influence over management, may provide debt finance subject to contractual restrictions, may own a controlling interest accompanied by substantial strategic authority or may act as an asset manager investing on behalf of beneficiaries. These arrangements cannot be treated as equivalent simply because all establish financial exposure to the same enterprise. At the same time, the absence of direct operational control does not eliminate every form of responsibility: investors can influence the cost of capital, the availability of financing, executive appointments, shareholder resolutions, investment priorities and corporate transition strategies. A rigorous framework must therefore distinguish the existence of a financial relationship from the degree of actual influence exercised through that relationship.
The development of financed-emissions standards reflects the increasing importance of these relationships for climate-related financial disclosure. The Partnership for Carbon Accounting Financials established a methodology for allocating portions of borrower and investee emissions to financial institutions according to their financing exposure. This approach was designed to support consistent greenhouse-gas accounting across different asset classes and to enable financial institutions to identify the emissions associated with their portfolios. Its purpose is not to construct a complete causal model of industrial emissions but to provide a reproducible allocation mechanism through which banks, investors and other financial institutions can measure and report climate-related exposure. The resulting information is particularly relevant for institutions evaluating transition risks, setting portfolio objectives or assessing the carbon characteristics of lending and investment activities. The Global GHG Accounting and Reporting Standard for the Financial Industry — Partnership for Carbon Accounting Financials — November 2020. Protocol GHG
A central feature of the methodology is its reliance on financial attribution factors. For listed equities and corporate bonds, the PCAF framework calculates attributed emissions using the investor’s outstanding financial exposure relative to the investee company’s enterprise value including cash, generally abbreviated EVIC. This denominator incorporates the market value of ordinary and preferred equity and specified balance-sheet components, including debt. The resulting ratio is multiplied by the relevant reported emissions of the investee company. The calculation is useful because it establishes a transparent relationship between a financial asset and an emissions inventory, but the resulting allocation can change when the financial value of the enterprise changes, even if its physical production and emissions remain unchanged. Market valuations are influenced by interest rates, expected earnings, investor sentiment, sectoral conditions and financial risk. Accordingly, movements in financed emissions do not necessarily correspond to equivalent changes in atmospheric releases or industrial operating behaviour.
This valuation problem has important implications for the interpretation of portfolio-level climate performance. Consider two reporting periods in which an industrial enterprise releases the same quantity of greenhouse gases but experiences a substantial change in its financial valuation. An investor maintaining an unchanged financial exposure may report a different attributed quantity of emissions if the denominator used in the accounting formula changes. Conversely, the investor may sell an interest in an emissions-intensive company and substantially reduce its reported financed emissions without changing the company’s production capacity, energy inputs or actual releases. The accounting result is meaningful as a statement of portfolio composition, but it does not demonstrate real-economy decarbonisation unless the transaction or accompanying governance actions change physical emissions. Financial supervisors and institutional investors consequently need to distinguish portfolio decarbonisation, which concerns the allocation of financial assets, from real-economy decarbonisation, which concerns reductions in the gases released by productive activities.
Corporate Emissions Accounting and the Meaning of Scopes 1, 2 and 3
The corporate greenhouse-gas accounting architecture adds another layer of complexity because emissions may be classified according to their operational relationship with a reporting enterprise. Scope 1 covers direct emissions from sources owned or controlled by the reporting company under the selected organisational boundary. Scope 2 addresses indirect emissions associated with purchased electricity, steam, heating and cooling. Scope 3 covers other indirect emissions occurring across upstream and downstream value chains, including purchased materials, transportation, product use and investments where applicable. These categories are designed to support corporate disclosure, provide an understanding of emissions exposure and identify opportunities for operational or value-chain intervention. They are not equivalent measures of ownership, nor do they necessarily indicate the same capacity to reduce the underlying emissions.
The financial industry introduces an additional relationship through Scope 3, Category 15, which addresses investments. A financial institution’s financed-emissions disclosure may therefore contain emissions physically released by companies whose operations take place entirely outside the financial institution itself. The importance of this classification is that it connects financial activity to the environmental characteristics of borrowers and investees, making climate-related exposure more visible to investors, regulators and market participants. However, the resulting reported quantities can overlap with emissions appearing in corporate inventories elsewhere in the same economic system. A company’s direct emissions may simultaneously appear within the Scope 3 inventory of a customer, a supplier’s value-chain assessment and a financial institution’s financed-emissions calculation, depending on the specific relationships and accounting boundaries. Such overlap is not necessarily an error within each individual inventory, but it becomes a serious analytical problem if the different figures are added together and presented as separate physical emissions. The GHG Protocol’s Scope 3 framework addresses categories within an individual reporting company’s inventory, but cross-company reporting still requires particular care when interpreting aggregate totals. Corporate Value Chain (Scope 3) Accounting and Reporting Standard — Greenhouse Gas Protocol — 2011.
The distinction between accounting allocation and physical production is especially important where a single emissions-intensive asset is associated with multiple commercial and financial entities. A power station can produce carbon dioxide directly through combustion, supply electricity to industrial customers, receive project finance from a banking consortium, issue corporate debt held by institutional investors and possess publicly traded equity owned by pension funds or investment vehicles. Each relationship can generate a legitimate accounting disclosure under an applicable framework, but the atmosphere receives the emissions released by the power station, not a separate quantity for each financial or commercial relationship. To measure the physical contribution of that asset to aggregate emissions, analysts must avoid summing overlapping disclosures. To assess the financial exposure of each institution, however, proportionate attribution remains useful. The analytical purpose determines which treatment is appropriate.
Table 3 — Emissions accounting and the interpretation of responsibility
| Accounting classification | Principal reporting boundary | What it establishes | What it does not automatically establish |
|---|---|---|---|
| Scope 1 | Directly owned or controlled emissions sources | Emissions directly associated with reporting operations | Exclusive responsibility for the commercial demand supporting those activities |
| Scope 2 | Purchased energy consumed by the reporting entity | Exposure to emissions associated with acquired energy | Ownership or operational control of the generating installation |
| Scope 3 upstream | Suppliers and other upstream value-chain activities | Indirect emissions associated with inputs and procurement | Direct operational control over every supplier |
| Scope 3 downstream | Product distribution, use and other downstream activities | Emissions associated with product life cycles and customer relationships | Exclusive responsibility for customers’ choices |
| Scope 3 Category 15 | Financial investments and related exposures | Emissions attributed through financial relationships | Proof that investment ownership physically generated the emissions |
| PCAF financed emissions | Loans and investments under specified asset-class methods | Standardised financial attribution of investee or borrower emissions | Equivalent causal influence across different financial instruments |
| Corporate emissions reductions | Changes within an appropriately consistent emissions inventory | Reported changes in operational or value-chain emissions | Necessarily equivalent reductions in global emissions when boundaries shift |
Methodological sources: The Global GHG Accounting and Reporting Standard for the Financial Industry — PCAF — November 2020; Corporate Value Chain (Scope 3) Accounting and Reporting Standard — Greenhouse Gas Protocol — 2011.
The Attribution Formula and the Economic Meaning of Financial Exposure
The standard calculation for financed emissions in listed equity and corporate bonds can be expressed as the sum, across relevant investees, of each institution’s financial exposure divided by the corresponding company’s enterprise value including cash, multiplied by the emissions of that company. The resulting figure has dimensions of greenhouse-gas emissions and provides a standardised measure of how much of the investee’s emissions is assigned to the reporting financial institution. Nevertheless, its interpretation depends on the definition of eligible financial exposure, the choice of emissions scopes, data availability, reporting dates and the treatment of entities operating through subsidiaries or complex financing structures. The attribution denominator is particularly important because a company’s enterprise value is not a direct measure of the amount of capital originally invested in its productive assets, nor of the financing specifically responsible for a particular power station, manufacturing line or industrial facility.
For explanatory purposes, consider a hypothetical company emitting 1 million tonnes of CO₂ equivalent annually, with an enterprise value including cash of €10 billion. An institution holding €100 million of qualifying equity or debt exposure would have an attribution factor of 1%, producing 10,000 tonnes of attributed financed emissions under the simplified calculation. If the company’s enterprise value increased to €12.5 billion while physical emissions and the institution’s exposure remained unchanged, the allocation would decline to 8,000 tonnes. No physical emissions reduction would have occurred. Conversely, a decline in the company’s valuation to €8 billion would increase the same investor’s attributed quantity to 12,500 tonnes, again without an operational change. These are illustrative calculations, not observed company data; they demonstrate that the measure incorporates financial valuation effects alongside physical emissions and is therefore unsuitable as a standalone measure of emissions causation.
Table 4 — Illustrative sensitivity of financed emissions to company valuation
| Scenario | Company emissions | Investor exposure | Enterprise value including cash | Attribution factor | Investor’s attributed emissions |
|---|---|---|---|---|---|
| Initial valuation | 1,000,000 tCO₂eq | €100 million | €10 billion | 1.00% | 10,000 tCO₂eq |
| Higher company valuation | 1,000,000 tCO₂eq | €100 million | €12.5 billion | 0.80% | 8,000 tCO₂eq |
| Lower company valuation | 1,000,000 tCO₂eq | €100 million | €8 billion | 1.25% | 12,500 tCO₂eq |
Illustrative calculation applying the listed-equity and corporate-bond attribution mechanism described in The Global GHG Accounting and Reporting Standard for the Financial Industry — PCAF — November 2020. Financial values are hypothetical and are included solely to explain the accounting mechanism.
This sensitivity does not invalidate financed-emissions accounting. Rather, it demonstrates why the resulting figure must be accompanied by other measures if it is to support investment decisions or public-policy evaluation. These supplementary measures may include the actual emissions of portfolio companies, sector-specific emissions intensity, capital expenditure on low-emission technologies, verified facility-level reductions, energy-consumption data, changes in the generation mix and documented investment decisions. Financial institutions assessing climate transition risk need to know whether their portfolios are exposed to emissions-intensive businesses, but public authorities evaluating climate effectiveness need to establish whether financial and regulatory interventions are associated with measurable reductions in the physical emissions produced by those businesses. Both objectives are legitimate, but they should not be evaluated through an undifferentiated measure.
Operational Control, Shareholder Rights and the Diversity of Investor Influence
The capacity of an investor to change emissions depends partly on the legal and governance structure of the investment. A controlling shareholder may possess the votes required to influence board composition, approve strategic transactions or determine capital allocation. A minority shareholder may participate in governance through voting, engagement or collective investor initiatives without exercising effective control. Debt providers may influence corporate behaviour through covenants, refinancing conditions, maturity structures or access to credit, but their authority generally differs from the ownership rights of shareholders. Asset managers may possess voting or engagement authority over securities held on behalf of clients, while the underlying economic claims belong to beneficiaries whose interests and mandates can constrain managerial discretion. The economic exposure, voting power, investment mandate and operational authority associated with these positions must therefore be examined separately.
An index-tracking investment institution provides a particularly instructive example. A diversified portfolio may contain holdings in fossil-energy producers, electricity utilities, industrial manufacturers, insurance companies, reconstruction businesses and developers of low-carbon technologies. These investments reflect the composition of the selected market benchmark and the institution’s investment mandate. The presence of multiple holdings establishes financial exposure to the different sectors but does not establish that the institution coordinates them around a common preference for higher emissions or greater climate damages. At the same time, passive investment strategies do not necessarily imply passive corporate governance. Asset managers may exercise voting rights, engage with boards or influence disclosure practices. Their ability to shape corporate outcomes must be evaluated through actual voting policies, engagement records, ownership concentration and the response of investee companies, rather than inferred from portfolio size alone.
This distinction becomes especially consequential where financial institutions claim that changes in portfolio composition demonstrate progress toward climate objectives. Divestment from an emissions-intensive enterprise may reduce exposure to transition risk and improve the reported emissions characteristics of the investor’s portfolio. However, if the divested asset continues operating under a different owner without changing its production technology, the transaction may have little immediate impact on global emissions. Conversely, providing finance to an emissions-intensive enterprise undertaking a credible and measurable technology conversion may initially increase reported financed emissions while contributing to future reductions in the physical emissions of the industrial system. A narrow accounting incentive can therefore diverge from the objective of real-economy decarbonisation. Financial supervisors should recognise this possibility rather than rewarding portfolio improvements without assessing their underlying economic effects.
IFRS S2 and the Institutionalisation of Financed-Emissions Disclosure
International financial reporting has increasingly formalised the treatment of climate-related financial exposures. IFRS S2, developed by the International Sustainability Standards Board within the IFRS Foundation, establishes requirements for disclosing material climate-related risks and opportunities that could affect an entity’s prospects. The standard addresses governance, strategy, risk management, metrics and targets, including greenhouse-gas emissions and, for relevant financial activities, additional information concerning financed emissions. The purpose is investor-oriented disclosure: enabling users of general-purpose financial reports to evaluate the implications of climate-related exposures for cash flows, access to financing and the cost of capital.
The IFRS Foundation’s implementation guidance distinguishes financial activities involving asset management, commercial banking and insurance, recognising that the relevant exposures and accounting methods differ. Its guidance also makes clear that financed emissions represent a portion of investee or counterparty emissions attributed to the loans or investments of a reporting entity. The disclosure requirement is therefore grounded in a financial relationship, not in a presumption that the financial institution directly operates the underlying emissions sources. The IFRS Foundation’s December 2025 amendments to greenhouse-gas emissions disclosures are also material to the current reporting architecture and must be considered rather than relying exclusively on the original 2023 text. Implementation guidance published before those amendments does not necessarily reflect the latest operative provisions. Responses to Questions Submitted to the Transition Implementation Group on IFRS S1 and IFRS S2 — IFRS Foundation — Updated Resource. ifrs.org
The economic relevance of these requirements is substantial. Climate-related exposure can affect borrowers through regulatory changes, technology substitution, shifts in consumer demand, litigation, physical damage and changes in energy or input costs. Lenders may then experience changes in credit risk, collateral values and repayment capacity; equity investors may experience changes in earnings and valuation; insurers may face changes in claims, underwriting conditions and capital requirements. Financed-emissions disclosure can help institutions identify transition-risk concentrations, but it should be integrated with sector-specific analysis and forward-looking information. A company reporting substantial financed emissions may possess a credible transition strategy supported by investment and engineering capacity, while another reporting a relatively modest financed-emissions footprint may remain vulnerable to significant physical climate damages or transition pressures. The emissions allocation is consequently one input into a broader financial-risk assessment, rather than a definitive indicator of an investor’s environmental influence or future financial performance.
Table 5 — Financial relationships and their potential influence over emissions
| Financial relationship | Primary economic exposure | Potential influence mechanism | Main analytical limitation |
|---|---|---|---|
| Controlling equity ownership | Enterprise value and residual profits | Board control, strategic direction, capital expenditure | Control does not establish sole causation of all corporate emissions |
| Minority equity ownership | Share-price and dividend exposure | Voting, engagement, collective initiatives | Limited unilateral control |
| Corporate bond investment | Creditworthiness and debt repayment | Refinancing terms, covenants where applicable | Bondholders generally do not direct daily operations |
| Bank lending | Credit risk and interest income | Loan conditions, financing availability, covenants | Influence depends on contract and financing alternatives |
| Passive asset management | Benchmark-linked asset exposure | Proxy voting and engagement within the mandate | Economic ownership and voting authority may be separated |
| Project finance | Project cash flows and contractual rights | Financing requirements and project conditions | Influence is concentrated on the financed project |
| Insurance activity | Underwriting and investment exposure | Risk pricing, underwriting conditions, asset allocation | Insurance exposure is not equivalent to operating control |
| Private-equity control | Enterprise value, leverage and exit proceeds | Direct governance and operational restructuring | Incentives vary across funds, investments and holding periods |
Analytical classification based on the relevant financial relationships and disclosure architecture; see IFRS S2 Implementation Questions — IFRS Foundation and PCAF Financial Industry Accounting Standard — November 2020.
Double Counting, Attribution Boundaries and the Risk of Inflated Aggregate Claims
The term double counting requires particularly precise treatment because it refers to several different problems. Within a single corporate greenhouse-gas inventory, an accounting framework should seek to avoid assigning the same activity more than once within categories whose boundaries are intended to be mutually exclusive. Across different companies, however, value-chain relationships can legitimately result in the same physical emissions appearing in multiple inventories. A manufacturer’s direct emissions may be included in its own Scope 1 inventory and in the Scope 3 reporting of a purchaser. Financial institutions may additionally allocate portions of that manufacturer’s emissions to their investment portfolios. These measurements can coexist without violating the logic of the individual reporting systems, provided their boundaries and purposes remain explicit.
The problem arises when analysts combine overlapping quantities without adjustment, particularly when attempting to compare a group’s attributed investment emissions with the global physical emissions inventory. A financial attribution calculation may assign part of an enterprise’s physical emissions to its shareholders or lenders, while consumption accounting may assign the corresponding production emissions to final demand. Adding those quantities together would not identify additional atmospheric emissions. It would combine distinct allocations of the same underlying physical activity. Similarly, comparing an investor’s attributed emissions with a country’s territorial emissions is only meaningful if the differences in accounting boundaries are explicitly recognised. The first concerns exposure within a financial portfolio, potentially across many countries; the second concerns physical releases associated with a geographical accounting perimeter.
There is also a distinction between gross attribution and exclusive attribution. An emissions figure assigned to an investor under a particular methodology does not necessarily demonstrate that the investor alone is responsible for its occurrence. Corporate management, energy providers, customers, regulators, infrastructure operators and financiers may simultaneously influence production decisions. Their roles are not reducible to a single allocation percentage, because causation involves counterfactual relationships: what would have happened to the emissions if a particular actor had behaved differently? Without a credible counterfactual, the accounting figure cannot establish how many tonnes of emissions were produced because of the investor’s actions.
This matters directly for assertions concerning the responsibility of narrowly defined wealth groups. If the emissions attributed to an affluent population include the industrial emissions of enterprises held through investment portfolios, the resulting total can be significantly influenced by the classification of assets, the proportion of corporate emissions allocated, assumptions concerning beneficial ownership and the treatment of overlapping financial structures. Such a measure may reveal the distribution of financial exposure to carbon-intensive activities, but its interpretation as a personal carbon footprint requires careful qualification. It should not be directly compared with household consumption emissions calculated under another boundary unless a consistent reconciliation has been completed. Nor should ownership-based allocation be dismissed automatically: it can identify a relevant concentration of economic power, but additional evidence is necessary to establish how that power affects actual emissions.
The Difference Between Carbon Accounting and Carbon Governance
The most consequential policy distinction concerns the difference between measuring emissions exposure and changing emissions-producing behaviour. Corporate emissions disclosure can create incentives for better reporting, identify risks and facilitate engagement, but its climate effect depends on subsequent decisions. A financial institution can respond by reallocating assets, imposing financing conditions, investing in cleaner technologies, supporting corporate restructuring or increasing engagement with companies. These actions vary substantially in their potential effect on physical emissions. Portfolio reallocation may influence market valuations and the cost of capital, but the magnitude of the effect depends on market liquidity, alternative investors, financing conditions and the responsiveness of corporate investment. Direct investment in cleaner industrial infrastructure can produce a more identifiable physical mechanism, although its success still depends on implementation, technology performance, energy availability and the displacement of higher-emitting activity.
A robust policy framework should therefore combine financial disclosure with measures that connect reported information to industrial outcomes. At the enterprise level, this may include capital-expenditure data, energy-intensity measurements, facility emissions, technology-conversion milestones and changes in production. At the financial institution level, it may include evidence that financing conditions influenced investment decisions, the degree of voting authority exercised, the credibility of transition plans and the treatment of emissions-intensive assets that are sold rather than decarbonised. At the regulatory level, evaluation should distinguish disclosure compliance from actual emissions reductions and should assess whether environmental and financial objectives reinforce or conflict with one another.
The relevant institutional question is not whether financial ownership should be included in climate analysis. It should. The question is what financed-emissions measurements can reliably establish and which additional observations are necessary to move from accounting association to claims of control, responsibility or policy influence. Public authorities that make this distinction can use financial data constructively without assuming that capital ownership alone explains the operation of the global carbon system.
Key Judgments — Chapter 2
Financed-emissions methodologies establish a standardised relationship between financial exposure and the greenhouse-gas emissions of borrowers or investees. They are relevant for portfolio transparency, transition-risk management and the evaluation of financial-sector relationships with emissions-intensive activities, but they do not automatically identify the investor who caused the emissions or demonstrate the quantity that would disappear if ownership changed. Corporate emissions inventories, financial allocations and consumption accounts can overlap legitimately; aggregate physical comparisons require careful reconciliation of their boundaries. The strongest evidence of investor influence is therefore found not in attributed emissions alone, but in the documented connection between financing, governance, corporate decisions and changes in actual production emissions.
What would change the assessment: Systematic evidence that particular financial-ownership structures consistently determine the operating emissions of otherwise comparable firms, after accounting for production technology, industry, demand, regulation and financing alternatives, would strengthen claims of ownership-driven causation. Such evidence would need to identify control mechanisms and measurable counterfactual outcomes.
Open official record: The principal requirements are harmonised financed-emissions disclosures, clear separation of physical and attributed emissions, sufficiently comparable enterprise-level transition metrics, documented governance practices and financial reporting that permits the reconciliation of portfolio changes with developments in the underlying real economy.
Chapter 3. The Political Economy of Climate Inequality
Wealth Concentration, Economic Power and the Distribution of Environmental Costs
Principal judgment: Climate inequality is a multidimensional economic phenomenon in which the distribution of income, wealth, political influence, exposure to environmental damage and capacity to finance adaptation interact without necessarily moving in the same direction. High-income households and concentrated owners of financial capital can possess disproportionate consumption footprints, investment influence and greater capacity to protect themselves against climate-related losses. Nevertheless, economic concentration does not establish uniform incentives among wealthy individuals or demonstrate that redistributing financial ownership would, by itself, alter the industrial processes responsible for global emissions. Effective climate governance must therefore distinguish redistributive objectives from emissions-reduction mechanisms, while recognising that distributional fairness can materially influence the political durability and economic feasibility of the transition.
The relationship between economic inequality and climate change extends beyond the distribution of annual carbon footprints. Wealth determines access to assets, credit, financial security and protection against economic disruption, while income influences current consumption and the ability to absorb higher energy or transportation costs. Political influence depends on additional institutional factors, including voting rights, corporate governance, regulatory access, campaign-financing arrangements, collective organisation and the structure of national political systems. Exposure to environmental damage follows another geographical and economic distribution, determined by settlement patterns, infrastructure, occupation, housing quality, ecosystem conditions and the effectiveness of public institutions. These dimensions are connected but cannot be reduced to a single hierarchy in which those with the greatest income necessarily control all relevant decisions or receive all financial benefits associated with climate-related economic activity.
The distinction is particularly important because inequality can be measured through income flows, accumulated wealth, financial ownership, consumption expenditure or the distribution of emissions. Each measure identifies a different economic relationship. A household with substantial income may consume large quantities of energy-intensive services without owning major productive enterprises. A household with considerable financial wealth may hold diversified investments while maintaining relatively modest personal consumption. A pension fund may manage substantial assets on behalf of many beneficiaries who individually possess limited financial power. A family-controlled industrial group may possess significant operational influence despite having a smaller market valuation than a widely held financial institution. Consequently, climate-policy proposals that treat the ownership of financial assets as interchangeable with consumption-related emissions, political authority or environmental vulnerability risk selecting instruments whose effects differ substantially from their intended objectives.
The IPCC’s assessment of household emissions inequality demonstrates the importance of distinguishing these relationships. Its finding that the highest-emitting 10% of households account for approximately 34–45% of global consumption-based household emissions establishes that emissions associated with consumption are unequally distributed. However, the same assessment recognises differences in infrastructure, technological systems, energy access and national conditions, which influence the emissions associated with income and expenditure. The distribution of household carbon footprints is therefore economically significant without being a sufficient explanation of the entire global production system. Climate Change 2022: Mitigation of Climate Change, Chapter 2, Emissions Trends and Drivers — Intergovernmental Panel on Climate Change — April 2022. IPCC
The Economics of High-Carbon Consumption and Externalities
Carbon-intensive consumption generates economic effects that extend beyond the private costs paid by consumers. When greenhouse-gas emissions contribute to climate-related damages that are not fully reflected in market prices, the result is a negative externality: the private decision-maker does not bear the entire social cost associated with the activity. This mechanism applies across income groups and productive sectors, but its quantitative significance varies according to the emissions intensity and scale of the activity. High-income consumption may involve particularly emissions-intensive transport, residential energy use and discretionary purchases, while lower-income households often allocate a larger share of their expenditure to essential energy, housing and transportation services. The difference matters for policy because identical price increases can produce very different welfare consequences, even where higher-income households generate larger emissions in absolute terms.
A climate-related consumption tax can operate through two distinct channels. First, it can raise the private price of emissions-intensive activity and thereby change consumption incentives. Second, it can generate public revenue that may be redistributed or invested in mitigation and adaptation. The first mechanism depends on the responsiveness of demand to price, the availability of substitutes and the relationship between expenditure and physical emissions. The second depends on tax administration, fiscal allocation and the effectiveness of public spending. A measure can therefore be redistributive without producing large emissions reductions, or environmentally effective without generating substantial revenue, depending on its design.
Taxes on selected luxury activities offer a particularly clear example of these differences. If a tax is narrowly applied to an activity with high emissions per user and relatively limited importance for essential household consumption, the distributional burden may be concentrated among individuals with greater capacity to pay. However, the resulting contribution to global mitigation will depend on the absolute emissions associated with the activity, the magnitude of the behavioural response and whether consumers substitute toward lower-emission alternatives. A policy that achieves a substantial proportional reduction within a small emissions category may remain modest in its contribution to aggregate decarbonisation. Conversely, policies affecting electricity generation, industrial processes, residential heating or mass transportation can influence large emissions volumes but may require greater investment and more extensive mechanisms to protect vulnerable households.
A further economic difficulty concerns the difference between the carbon intensity of expenditure and the welfare implications of restricting it. Expenditure is not synonymous with emissions: the same monetary amount can purchase goods and services with substantially different carbon footprints, while inflation and changes in relative prices can alter expenditure without corresponding changes in physical consumption. An emissions-focused policy should therefore identify the underlying activity and its measurable environmental impact rather than treating spending by high-income households as an automatic proxy for carbon intensity. This approach also allows the taxation of specific emissions-intensive activities to coexist with incentives for low-emission investment, without assuming that all expenditure or capital accumulation by affluent households has the same environmental consequences.
Political Influence and the Institutional Conditions of Climate Governance
Economic wealth can provide resources for political participation, lobbying, public communication, litigation and influence over corporate governance. Nevertheless, the relationship between economic concentration and climate-policy outcomes must be established through identifiable institutional processes rather than inferred from wealth distribution alone. The relevant evidence may concern the financing of political organisations, participation in regulatory consultations, lobbying disclosures, shareholder voting, corporate strategy, legislative decisions or the relationship between public subsidies and private beneficiaries. These mechanisms differ considerably across national jurisdictions and regulatory systems. An investor possessing a large financial portfolio does not automatically exercise decisive influence over public policy, just as an individual without substantial personal wealth may participate in influential organisations, public institutions or collective political movements.
The analytical significance of political influence is that it can modify the incentives and constraints affecting emissions-producing activities. Enterprises may seek favourable treatment concerning energy pricing, environmental compliance costs, infrastructure access, permitting or public investment. Investors may support policies that protect asset values or reduce uncertainty, while other commercial actors may benefit from regulatory arrangements that favour competing technologies or accelerate the retirement of existing assets. These incentives cannot be assumed to align uniformly among all owners of capital. A company investing heavily in low-emission infrastructure may support policies that increase demand for cleaner technologies, whereas a company with substantial unrecovered investment in carbon-intensive assets may seek longer transition periods. Even within a single financial portfolio, these interests may conflict.
This diversity matters for the assessment of climate-related political economy. Concentrated financial resources can create influence risks, but the existence of those resources does not reveal the direction of the resulting policy preference. Establishing that financial influence has delayed mitigation requires evidence connecting an identifiable actor’s economic interests, policy intervention and regulatory outcome. Similarly, establishing that private investment has accelerated mitigation requires evidence that capital allocation or governance decisions contributed to measurable changes in technology, emissions or infrastructure deployment. The methodological standard should apply consistently regardless of whether the resulting conclusion is favourable or unfavourable to a particular industry or investor class.
An institutional approach would therefore emphasise transparency and accountability rather than assuming that one ownership category necessarily produces one political outcome. Relevant measures include disclosure of lobbying activities, conflict-of-interest rules, transparent procurement, regulatory impact assessments, competition enforcement and the availability of verifiable information concerning corporate governance. Their objective is to ensure that climate-related decisions are evaluated through their economic, environmental and public-interest consequences, with identifiable mechanisms for preventing the private appropriation of regulatory benefits that do not correspond to legitimate public objectives.
The Distribution of Climate Vulnerability and the Economic Value of Protection
The distribution of climate damages is not simply the inverse of the distribution of emissions. Households, communities and countries with limited financial resources may face substantial environmental risks despite contributing relatively little to the accumulated stock of greenhouse gases. Their vulnerability depends on geographical exposure, infrastructure conditions, access to healthcare and emergency services, housing quality, economic diversification and the availability of insurance and savings. Wealthier households often possess greater capacity to relocate, reinforce buildings, purchase insurance or absorb temporary income losses. These differences can produce unequal economic consequences from similar physical shocks, particularly where low-income households have a large share of their assets concentrated in housing, local businesses or geographically exposed livelihoods.
From an economic perspective, vulnerability contains at least three separate components: physical exposure to a hazard, the sensitivity of affected assets and activities, and the capacity to adapt or recover. A densely populated urban district may possess substantial aggregate asset values and significant potential physical damage but also benefit from sophisticated infrastructure, insurance markets and emergency services. A lower-income agricultural region may have less financial wealth exposed in absolute terms while suffering greater disruption to household welfare, food security and future income because alternative employment, liquidity and public protection are limited. Comparing damages exclusively in monetary terms can therefore understate the social consequences of environmental disruption in poorer regions. Conversely, assessing vulnerability solely by income can overlook highly exposed infrastructure and economic activities in more affluent jurisdictions.
This distributional problem has direct implications for public finance. Adaptation investments can protect infrastructure, reduce disaster losses and strengthen economic continuity, but their financing mechanisms determine who receives protection and who bears the costs. Governments with strong fiscal capacity can undertake major projects through public budgets, debt markets and insurance arrangements. Governments with limited fiscal space may face higher borrowing costs, weak project-preparation capacity and competing demands for healthcare, education, transportation and essential services. The resulting financing constraints can increase long-term vulnerability, particularly where infrastructure deterioration or repeated disasters undermine the tax base and discourage investment.
The international institutional framework recognises these disparities. Article 9 of the Paris Agreement establishes obligations for developed-country Parties concerning financial assistance to developing-country Parties for mitigation and adaptation, while encouraging broader mobilisation of resources and recognising the particular needs of vulnerable developing countries. This legal and diplomatic architecture reflects the distinction between national development circumstances, historical responsibilities and financial capacity. It also demonstrates why adaptation should not be conceptualised exclusively as a commercial market opportunity: the underlying policy problem concerns the financing of protective infrastructure and institutional capabilities, often in circumstances where private financial returns are insufficient to mobilise investment without public support. Paris Agreement, Article 9 — United Nations Framework Convention on Climate Change — December 2015.
The distribution of vulnerability also affects the interpretation of private-sector participation in adaptation. Private investment in infrastructure, engineering, risk management and resilience technologies can provide socially valuable capabilities, but financial returns depend on contract structures, tariffs, public procurement, insurance arrangements and the allocation of risk. A profitable adaptation project may represent efficient risk reduction, an appropriate payment for a service or, under poorly designed contracts, an excessive transfer of public resources to private beneficiaries. The existence of profit cannot determine which interpretation is correct. Evaluation requires information about project costs, competitive tendering, performance obligations, public risk exposure, service quality and the economic benefits delivered to affected populations.
Fiscal Distribution, Carbon Pricing and the Cost of Economic Transition
The fiscal distribution of climate policy is among the most important determinants of its political and economic sustainability. Carbon pricing can influence emissions by increasing the relative cost of carbon-intensive activity, thereby encouraging energy efficiency, fuel substitution and investment in lower-emission technologies. Nevertheless, the distributional effects depend on the scope of the instrument, the treatment of individual sectors, the availability of substitutes and the mechanisms through which firms pass costs to households. A higher carbon price may affect consumers directly through household energy expenditure or indirectly through changes in the prices of goods and services that incorporate energy and transportation costs. The same policy can have different relative burdens across income groups and geographical areas because consumption patterns, housing conditions and transport infrastructure differ.
The International Monetary Fund’s 2024 research on heterogeneous carbon pricing within the European Union demonstrates that distributional outcomes cannot be inferred solely from aggregate carbon prices. The study examined the period from 2010 to 2020 and found that exemptions and differences in effective carbon pricing across emissions sources materially influenced household burdens. The authors concluded that lower-income groups were disproportionately affected partly because their consumption baskets benefited less from exemptions than those of higher-income households. They also found that more uniform carbon pricing could reduce regressivity under the assumptions of their analysis and that the redistribution of carbon-pricing revenues could help alleviate the burden on economically vulnerable households. These findings are relevant because they establish that distributional policy is not restricted to compensating households after a tax has been introduced: the structure of exemptions, sectoral coverage, trade exposure and revenue allocation can influence the distributional outcome from the beginning. Distributional Impacts of Heterogeneous Carbon Prices in the EU — International Monetary Fund — July 2024. Fondo Monetario Internazionale
The scale of carbon-pricing implementation also demonstrates that climate-related fiscal policy has moved beyond isolated experiments. According to the World Bank’s May 2026 assessment, 87 direct carbon-pricing policies were operating globally, covering slightly more than 29% of worldwide greenhouse-gas emissions and generating over US$107 billion in government revenue during 2025. The report identified an average direct carbon price of approximately US$21 per tonne of CO₂ equivalent, although this average does not represent the effective price applying to every emitter or jurisdiction. The breadth of the mechanisms, their coverage and their revenue generation establish carbon pricing as a significant component of contemporary climate governance, but they do not demonstrate uniform effectiveness. The environmental effect of each instrument depends on the applicable price, the emissions base, compliance arrangements, exemptions, alternative technologies and responses by firms and consumers. Direct Carbon Pricing Covers Nearly One Third of Global Emissions — World Bank — May 2026. worldbank.org
Table 6 — International carbon-pricing implementation and fiscal significance
| Indicator | Verified value | Reference period | Policy relevance |
|---|---|---|---|
| Direct carbon-pricing instruments | 87 | May 2026 assessment | Extent of instrument adoption |
| Share of global GHG emissions covered | Slightly above 29% | 2026 assessment | Approximate worldwide coverage |
| Government revenue from carbon pricing | Over US$107 billion | 2025 | Fiscal resources generated by carbon-pricing mechanisms |
| Average direct carbon price | Approximately US$21/tCO₂eq | 2026 assessment | Broad global pricing indicator |
| Growth in global carbon-credit issuance | 8% | 2024–2025 | Change in reported credit issuance, distinct from direct carbon-pricing coverage |
Source: State and Trends of Carbon Pricing 2026 — World Bank — May 2026. Carbon-credit issuance is a separate market indicator and must not be interpreted as equivalent to verified net reductions in global greenhouse-gas emissions.
The availability of fiscal revenue introduces an important strategic opportunity: carbon-pricing mechanisms can contribute to investment and household compensation, but the relationship between revenue collection and environmental effectiveness depends on how the proceeds are used. Direct transfers can protect vulnerable consumers from increases in essential expenditure, while investment in building insulation, public transportation, electricity infrastructure and industrial efficiency can reduce future exposure to energy prices. These instruments operate over different time horizons. Transfers can provide immediate financial relief, whereas infrastructure investment may require longer implementation periods before generating substantial benefits. A policy that relies exclusively on transfers may leave structural energy dependence unchanged, while a policy that invests exclusively in infrastructure may fail to protect households facing immediate affordability pressures. The economic case for combining both approaches arises from their different functions, rather than from a presumption that every jurisdiction should adopt an identical spending allocation.
Wealth Taxation, Capital Mobility and the Financing of Decarbonisation
The taxation of wealth and capital requires assessment according to several objectives that are frequently combined in public debate but remain economically distinct: fiscal redistribution, revenue mobilisation, the limitation of excessive market or political concentration, and environmental mitigation. A wealth tax may improve the progressivity of a tax system or generate additional revenue under certain conditions, but its effect on greenhouse-gas emissions depends on how it influences consumption, investment and production. A tax levied on the market value of financial assets is not inherently proportional to the physical emissions associated with those assets. A high-valued enterprise operating low-emission infrastructure may face a larger wealth-related tax base than a less valuable but emissions-intensive enterprise, while the relevant tax burden may fall on the investor rather than directly altering the cost of the emissions-producing activity.
The OECD’s assessment of net wealth taxation emphasises that economic outcomes are sensitive to tax design, the interaction with existing capital-income taxation and the treatment of assets. Its recommendations include attention to exemption thresholds, valuation methods, the liquidity of taxable assets, international information exchange, exemptions and the prevention of excessive combined taxation. The organisation also recognises capital mobility and the possibility of capital flight as relevant considerations in the design of recurrent net wealth taxes. These risks should not be interpreted as proof that all wealth-related taxation necessarily undermines investment: outcomes depend on the tax base, rate structure, international cooperation, enforcement, exemptions and the availability of alternative jurisdictions. Nevertheless, an environmental policy based heavily on wealth taxation must consider the extent to which the measure affects capital formation, entrepreneurial activity and investment in productive assets. The Role and Design of Net Wealth Taxes in the OECD — Organisation for Economic Co-operation and Development — 2018. OECD
This trade-off becomes particularly relevant in capital-intensive decarbonisation. Electricity networks, renewable generation, nuclear infrastructure, industrial electrification, energy-efficiency retrofits, low-emission materials and other technologies require financing across long investment horizons. Their economic viability depends on expected revenues, financing costs, regulatory stability, construction risks and the availability of complementary infrastructure. Financial wealth can be mobilised through equity investment, debt financing, institutional savings, public-private arrangements and other mechanisms. The existence of concentrated capital therefore creates both governance challenges and financing opportunities. Policies designed to reduce excessive concentration must be assessed alongside the need to mobilise investment, rather than assuming that the restriction of ownership automatically increases the supply of capital for low-emission technologies.
The distinction between taxing economic rents and discouraging productive investment is particularly important. Where private actors earn exceptional returns from limited competition, regulatory privileges or scarce assets, fiscal intervention may generate revenue with different investment consequences from taxes imposed on ordinary returns required to finance new capacity. Similarly, measures targeting emissions-intensive consumption can possess a more direct environmental mechanism than broad taxation of financial wealth. Public authorities evaluating these options should therefore consider effective tax incidence, administrative feasibility, expected revenue, international mobility, effects on capital expenditure and the relationship between the chosen tax base and measurable emissions.
Table 7 — Comparison of fiscal and regulatory instruments
| Instrument | Principal economic mechanism | Potential environmental effect | Main distributional concern | Implementation constraint |
|---|---|---|---|---|
| Carbon tax | Raises the private cost of emitting | Incentivises lower-emission activity | Costs passed to vulnerable households | Coverage, price design and enforcement |
| Emissions trading | Limits covered emissions through tradable allowances | Creates a compliance incentive within the regulated perimeter | Effects on energy prices and industrial costs | Market design, allowance allocation and monitoring |
| Luxury-emissions taxation | Targets selected high-emission discretionary activities | Reduces emissions where consumers respond or substitute | Generally concentrated among higher-income users, depending on the tax base | Defining activities and preventing avoidance |
| Recurrent net wealth tax | Taxes accumulated net asset value | Indirect and dependent on behavioural or investment effects | Capital-income interactions and asset valuation | Liquidity, enforcement, valuation and capital mobility |
| Capital-income taxation | Taxes returns on financial or productive assets | Indirect, depending on investment incentives and revenue use | Distribution of capital income and tax incidence | International coordination and investment effects |
| Public investment subsidies | Reduces effective cost of selected technologies | Can support physical technology substitution | Allocation of benefits and public expenditure | Additionality, project selection and budgetary cost |
| Household compensation | Transfers resources to affected consumers | Indirect; can sustain acceptance of mitigation policy | Adequacy and targeting of transfers | Fiscal capacity and administration |
| Industrial performance standards | Sets requirements for productive activities | Directly influences covered processes | Compliance cost and competitiveness | Technical feasibility and regulatory enforcement |
Analytical comparison informed by State and Trends of Carbon Pricing 2026 — World Bank, Distributional Impacts of Heterogeneous Carbon Prices in the EU — IMF — July 2024, and The Role and Design of Net Wealth Taxes in the OECD — OECD — 2018. The table describes mechanisms and constraints; it does not assign unsupported rankings of effectiveness.
Climate Inequality in Europe: Institutional and National Economic Differences
The European Union provides a significant case for assessing the interaction between climate policy, income distribution, industrial competitiveness and fiscal capacity because its member states operate within a common regulatory framework while retaining substantial differences in energy systems, economic structures and public-finance conditions. EU-level climate instruments influence emissions and investment incentives across jurisdictions, but national governments remain important in taxation, infrastructure development, industrial support and household compensation. These divisions create opportunities for coordination as well as tensions concerning the allocation of transition costs. A common carbon-price signal may encounter different household conditions and industrial dependencies across countries, while national fiscal measures may alter the competitiveness of enterprises operating within an integrated market.
Italy’s distributional challenge is closely connected to the interaction between household energy affordability, industrial energy costs and the investment required to modernise production and infrastructure. The effectiveness of climate-related fiscal measures depends not only on the prices imposed on energy-intensive activity but also on the ability of households and enterprises to substitute technologies, improve efficiency and access financing. A measure that raises the cost of conventional energy without providing economically viable alternatives can create substantial transitional burdens, particularly for households with limited access to capital and smaller enterprises facing financing constraints. Conversely, efficiency investment and improvements in infrastructure can reduce exposure to energy-price volatility while contributing to lower emissions. For Italy, the principal analytical priority is therefore the relationship between energy-system transformation, industrial productivity, household purchasing power and the capacity of public and private institutions to finance technological adjustment.
France presents a different configuration because the structure of electricity generation, the role of public institutions and the distribution of household transport and residential energy needs influence the relative effectiveness of different policy instruments. Where low-carbon electricity is available, electrification can offer an important pathway for reducing direct fossil-fuel use, although the practical benefits depend on investment in end-use technologies, electricity networks and affordability. The distributional implications of transport and heating policies also depend on geographical circumstances, particularly where households rely on private vehicles or occupy buildings requiring substantial investment to improve energy efficiency. The fiscal and regulatory challenge is therefore to align the opportunities created by the electricity system with the capital requirements and social consequences of changing end-use technologies.
Germany’s transition involves substantial industrial and energy-system considerations, particularly in relation to manufacturing processes requiring reliable electricity, industrial heat and internationally competitive production costs. The economic consequences of mitigation policy cannot be evaluated solely through household consumption because industrial investment decisions affect employment, exports, technology development and long-term production capacity. Carbon-pricing instruments and emissions standards may encourage technological substitution, but their effectiveness also depends on infrastructure availability, energy-market conditions, financing and industrial implementation. Measures that influence investor returns or energy costs must therefore be examined in relation to the ability of manufacturers to invest in lower-emission production while remaining competitive in international markets. A distributional framework that ignores industrial adjustment risks overlooking employment and regional consequences, even when the immediate fiscal incidence of a policy appears concentrated elsewhere.
The United Kingdom requires separate treatment because its carbon-pricing and regulatory architecture operates outside the European Union’s principal legislative framework, while its firms, investors and consumers remain exposed to international energy prices, supply chains and climate-related financial risks. The interaction between electricity-system transformation, heating, transportation, infrastructure and household affordability creates distributional challenges whose fiscal treatment depends on national institutions. The UK’s role as an international financial centre also increases the relevance of distinctions between portfolio-level financed emissions and the physical emissions generated by enterprises operating in multiple jurisdictions. Financial institutions may manage or finance assets across international markets, and the geographical distribution of the resulting financed-emissions disclosures must not be confused with domestic territorial emissions.
Across these four jurisdictions, a common principle emerges: the distributional effectiveness of climate policy depends on the relationship between physical emissions, the capacity to substitute technologies, household expenditure patterns, industrial structures and public-finance arrangements. The same nominal tax or regulatory requirement can produce different economic consequences where energy infrastructure, household income, access to credit and industrial composition differ. Consequently, comparisons that rely solely on the formal stringency of environmental rules can fail to capture material differences in implementation feasibility and welfare effects. A rigorous European assessment should evaluate comparable indicators of emissions intensity, household affordability, industrial investment, energy-system transformation and fiscal compensation before drawing conclusions about relative national performance.
Capital Ownership, Market Structure and the Allocation of Transition Benefits
The distribution of benefits arising from decarbonisation is an important component of the political economy of climate policy. Investment in cleaner electricity generation, industrial technology, transportation infrastructure, energy efficiency and risk management can create revenues for suppliers, manufacturers, infrastructure operators and financial institutions. These returns may accrue unevenly depending on market structure, intellectual property, access to financing, technological capabilities and procurement arrangements. A policy that creates demand for low-emission technologies can therefore produce both public environmental benefits and private financial returns, just as adaptation investment can generate commercial revenues while providing protection against climate damages. The existence of a commercial return does not establish that the policy is inefficient; rather, it requires the assessment of whether the public benefits justify the costs and whether competition and contracting arrangements prevent unnecessary transfers of economic value.
Concentrated market power can nevertheless create risks where access to essential infrastructure, technology or finance is limited. Enterprises controlling strategic assets may possess greater bargaining power over prices, investment commitments or public support. Financial concentration may influence the allocation of capital, while regulatory complexity can create advantages for larger firms possessing substantial compliance resources. These conditions can affect the distribution of transition costs and benefits, particularly when public policies rely heavily on subsidies, guarantees or long-term contractual commitments. Competition policy, transparent procurement and regulatory oversight are therefore relevant complements to environmental policy, but their objectives should be specified precisely. Preventing excessive market power is different from reducing greenhouse-gas emissions, even though improved competition and investment conditions may support decarbonisation under appropriate circumstances.
The financial structure of the transition also affects intergenerational distribution. Long-lived infrastructure may require substantial investment today while generating energy savings, emissions reductions or resilience benefits over decades. The allocation of these costs across taxpayers, consumers, investors and future beneficiaries depends on public borrowing, tariffs, private-financing contracts and regulatory decisions. Excessively short investment horizons can discourage projects whose benefits emerge gradually, while poorly designed long-term commitments may impose unnecessary fiscal burdens or protect inefficient technologies. The appropriate allocation of risk requires an assessment of construction uncertainty, technological maturity, demand forecasts, financing conditions and the public benefits expected from the project.
This perspective also clarifies why the existence of wealthy investors within emissions-intensive and low-emission sectors does not necessarily produce a single political or financial incentive. The same investor may benefit from the development of new energy infrastructure while experiencing losses in other assets affected by transition policies or physical climate risks. Whether the total outcome is favourable depends on portfolio composition, investment horizon, leverage, geographic exposure and the distribution of financial returns. The relevant policy questions concern transparency, conflicts of interest, competition and the effectiveness of capital allocation, rather than a presumption that accumulated wealth generates a uniform preference for higher emissions.
The Strategic Balance Between Equity, Investment and Environmental Effectiveness
A coherent policy response to climate inequality must reconcile three objectives that are connected but not identical: reducing physical greenhouse-gas emissions, protecting vulnerable populations and maintaining the capacity to finance economic transformation. Policies that advance only one objective may produce unintended effects on the others. A mitigation instrument that achieves rapid reductions but imposes severe burdens on lower-income households can undermine public acceptance and political continuity. A redistributive instrument that raises revenue but does not influence carbon-intensive activity may improve fiscal equity while leaving the emissions trajectory substantially unchanged. An investment programme that expands low-emission infrastructure but allocates excessive public benefits to private contractors may deliver environmental gains at unnecessary fiscal cost. Each intervention should therefore be evaluated according to its actual mechanism, measurable outcomes and distributional consequences.
The appropriate policy framework is neither a purely market-based approach that assumes private investment will resolve all environmental externalities nor a purely redistributive approach that assumes the concentration of financial wealth is the principal cause of emissions. Markets can mobilise capital and allocate resources, but unpriced environmental damages, infrastructure constraints and incomplete information can prevent socially desirable investment. Governments can correct externalities, provide public goods, establish standards and protect vulnerable populations, but public intervention is also subject to administrative limitations, political incentives and fiscal constraints. Effective governance depends on designing institutions that address the specific economic problem identified, rather than applying a universal instrument to distinct failures.
Climate-related wealth taxation should consequently be assessed as one possible component of fiscal and distributional policy, not as a substitute for emissions standards, energy investment or carbon pricing. Policies addressing unusually emissions-intensive consumption can be justified when their environmental and fiscal effects are identifiable. Financial disclosure and governance requirements can improve transparency concerning investment exposure and transition plans, provided they distinguish financial attribution from physical causation. Public support for low-emission infrastructure can accelerate technological transformation where financing barriers or externalities prevent adequate investment, but its economic efficiency depends on project selection, competition and performance. Adaptation expenditure can protect vulnerable households and productive assets, but its benefits require assessment through avoided damages, improved resilience and the long-term sustainability of financing arrangements.
For national governments and international institutions, the strategic priority is to establish a policy architecture in which environmental objectives are measured through physical outcomes, distributional objectives through their effects on household welfare and economic opportunity, and financial objectives through capital mobilisation, risk management and long-term investment performance. This separation does not weaken climate governance. It strengthens accountability by preventing the achievement of one objective from being represented as proof of success in another.
Final Assessment of Pillar I
The evidence developed across the three chapters establishes a fundamental distinction between emissions responsibility, financial ownership and economic power. Global greenhouse-gas emissions arise from productive activities and energy systems responding to demand, technological possibilities, infrastructure and public regulation. Their geographical distribution is measurable through territorial accounts, their connection to final consumption can be estimated through consumption-based footprints, their historical contribution can be evaluated through cumulative inventories, and their relationship with financial institutions can be represented through financed-emissions accounting. These measurement systems are complementary but not interchangeable, and each requires clear boundaries if it is to support defensible conclusions.
Income inequality is materially associated with differences in household carbon footprints, while accumulated wealth can influence investment capacity, financial resilience and participation in corporate governance. However, the effects of those relationships depend on institutional structures and observable economic mechanisms. Financial ownership does not establish exclusive responsibility for corporate emissions, just as consumers do not exercise complete control over production technologies. The resulting policy challenge is to identify where changes in prices, regulation, financing, infrastructure or technology can produce genuine reductions in physical emissions, while ensuring that vulnerable households and countries do not carry disproportionate costs.
The global policy environment already contains substantial instruments relevant to this objective, including carbon pricing, emissions standards, financial disclosures, public investment programmes and international climate-finance commitments. Their existence demonstrates that climate governance operates through multiple institutional channels rather than through a single redistributive mechanism. Their effectiveness must nevertheless be judged by implementation, measurable emissions outcomes, financial additionality and the distribution of costs and benefits.
The central strategic conclusion is that climate inequality deserves direct policy attention, but effective decarbonisation cannot be reduced to limiting the wealth or ownership rights of a narrowly defined population. Durable mitigation requires changes in the physical operation of energy and industrial systems, credible financial incentives, institutional accountability and policies that distribute the costs of adjustment in an economically and socially sustainable manner. The most defensible response combines targeted measures addressing excessive emissions and economic concentration with the large-scale mobilisation of capital necessary to transform production, infrastructure and consumption.
What would change the assessment: Stronger evidence establishing a consistent causal relationship between concentrated ownership and specific emissions outcomes, independently of sectoral technology, demand and regulatory conditions, would justify greater emphasis on ownership-related instruments. Conversely, evidence that targeted fiscal or financial policies generate measurable industrial emissions reductions without materially impairing low-emission investment would strengthen their position within the broader policy framework. The assessment should therefore evolve according to observed physical emissions, documented investor influence, distributional impacts and implementation outcomes.
Open official record: The decisive monitoring requirements are updated national greenhouse-gas inventories, harmonised consumption and production accounts, company-level financial and emissions disclosures, records of capital expenditure and industrial technology deployment, distributional studies of climate-policy incidence, verified public-finance allocations and data on the effectiveness of adaptation investments.
PILLAR II — CLIMATE DAMAGE, FINANCIAL MARKETS AND CAPITAL ALLOCATION
Chapter 4. The Economics of Climate Disasters and Recovery Industries
Disaster Economics: The Separation Between Capital Destruction, Reconstruction Expenditure and Economic Welfare
The principal economic judgment is that climate-related disasters generate substantial commercial activity without necessarily generating corresponding economic prosperity, while the financial returns earned by reconstruction and restoration businesses represent only one component of a much broader system of capital destruction, insurance liabilities, fiscal expenditure and lost economic production. The distinction is central to understanding disaster-related markets because the expansion of recovery expenditure can coexist with declining household wealth, impaired public infrastructure, interrupted industrial production and deteriorating sovereign balance sheets. Treating the revenue earned by businesses involved in reconstruction as equivalent to the economic value generated by disasters confuses expenditure required to replace destroyed capital with the creation of additional productive capacity. It also ignores the geographical, institutional and sectoral distribution of losses, which frequently extends beyond the businesses immediately affected by a disaster and can persist long after the reconstruction contracts have been completed.
The scale of the financial exposure is substantial. According to Munich Re’s assessment published on 13 January 2026, natural disasters generated approximately US$224 billion in worldwide economic losses during 2025, of which approximately US$108 billion were insured. The corresponding figures for 2024, adjusted to the reporting price basis, were approximately US$368 billion in total losses and US$147 billion in insured losses. Weather-related disasters accounted for 92% of all economic losses in 2025 and 97% of insured losses, while approximately 17,200 deaths were recorded across natural disasters worldwide. The 2025 economic-loss figure was below the inflation-adjusted ten-year average of US$266 billion, but insured losses remained close to their ten-year average of US$107 billion. This demonstrates why a decline in annual losses cannot be interpreted as evidence that the underlying risk has diminished: the realised financial outcome depends on which hazards occur, where they strike, the concentration of exposed assets and the extent of insurance coverage. Natural Disaster Figures for 2025 — Munich Re — January 2026. Munich Re
Swiss Re Institute’s independent industry estimate, published in March 2026, placed natural-catastrophe economic losses at approximately US$220 billion and insured natural-catastrophe losses at US$107 billion for 2025, measured using its own definitions and modelling conventions. Its broader total, including man-made catastrophes, amounted to US$235 billion in economic losses and US$120 billion in insured losses. The difference between the two reinsurers’ estimates does not justify averaging them into a synthetic global total. Their catastrophe databases, inclusion thresholds, treatment of individual events and modelling conventions are not identical, and the distinction between natural and man-made catastrophes must be maintained. Swiss Re also identified a pronounced increase in the relative importance of wildfires, floods and severe convective storms, whose combined contribution to insured losses made 2025 an unusually significant year for hazards historically described as secondary perils. Natural Catastrophes in 2025: The Persistent Rise of Wildfire and Storm Risk — Swiss Re Institute, sigma No. 1/2026 — March 2026, Executive Summary and Key Takeaways, pp. 2–3. swissre.com
The financial implications of these figures are better understood by decomposing disaster losses into their constituent economic mechanisms. Physical damage destroys or impairs assets accumulated over previous years, including buildings, machinery, transport networks, electricity systems and inventories. Business interruption reduces income during the period in which production or distribution cannot operate normally. Emergency expenditure redirects resources toward rescue, temporary accommodation, logistics and essential services. Reconstruction subsequently generates demand for labour, materials, equipment, engineering and contracting services. Insurance settlements transfer part of the financial burden from insured policyholders to insurers and reinsurers, while uninsured losses remain with households, enterprises and public authorities. Fiscal expenditure can support recovery but may increase borrowing requirements or displace other investment. These processes occur at different times and affect different balance sheets, making it analytically inappropriate to interpret gross reconstruction turnover as the net economic gain generated by the original disaster.
The National-Accounting Distinction Between Reconstruction and Net Wealth Creation
A natural disaster can produce a temporary increase in construction activity and related expenditure even when the affected economy has suffered a substantial loss of productive wealth. Gross domestic product measures the value of production during a defined period; it does not directly measure the total stock of national wealth or the destruction of existing assets. A building reconstructed after a flood generates construction-sector value added, but the destruction of the original building is not automatically recorded as an equivalent negative component of GDP in the same period. The same event can therefore be associated with positive measured construction output and a decline in the economy’s capital stock. This accounting distinction is not a technical curiosity: it determines how governments should interpret recovery-related economic activity and assess whether public intervention has restored, rather than merely replaced, productive capacity.
The practical implications become especially important where reconstruction expenditure is financed through borrowing, insurance proceeds or the redirection of existing public budgets. If governments allocate resources to rebuilding damaged infrastructure, the resulting activity may support employment and aggregate demand, but the opportunity cost is the alternative use of those resources. A bridge rebuilt after destruction does not necessarily represent an addition to the infrastructure available before the disaster. If the project incorporates improved resilience, greater transport capacity or more efficient technology, it can create incremental benefits beyond restoration; those gains, however, should be measured separately from the expenditure required to replace the lost asset. Likewise, when contractors report higher revenues following a catastrophe, those revenues must be evaluated against material costs, labour shortages, equipment expenses, financing conditions and the net value added retained by the enterprise.
The International Monetary Fund’s February 2025 study, Understanding the Macroeconomic Effects of Natural Disasters, offers an important empirical perspective on these mechanisms. Its analysis finds that advanced economies tend to increase government expenditure in the year of a disaster, helping offset the decline in private investment growth, whereas emerging-market and developing economies generally experience a smaller fiscal response and more pronounced contemporaneous adverse effects on output growth. The study identifies reductions in investment as an important transmission mechanism outside small-island developing economies and declines in net exports as particularly important for small-island economies. It also finds that subsequent output recovery does not fully offset the initial decline in the year of the disaster, while countries entering the shock with limited fiscal space are more vulnerable to persistent losses. These results reinforce the argument that reconstruction expenditure should be interpreted within a wider macroeconomic balance, rather than as evidence that disasters stimulate economic prosperity. Understanding the Macroeconomic Effects of Natural Disasters — International Monetary Fund — February 2025. Fondo Monetario Internazionale
The Scale and Composition of the 2025 Catastrophe Economy
The distribution of catastrophe losses across hazards is significant because different types of disasters generate different reconstruction demands, insurance exposures and public-policy requirements. Munich Re estimated that floods, severe convective storms and wildfires collectively produced approximately US$166 billion in economic losses in 2025, including around US$98 billion in insured losses. These figures exceeded the corresponding inflation-adjusted ten-year averages of US$136 billion and US$60 billion, respectively. The concentration of insured losses in these categories reflects the combined influence of urban exposure, property values, insurance penetration and hazard characteristics. It should not be interpreted as proof that every category of disaster is increasing at the same rate or that the additional losses can be attributed exclusively to climate change. Natural Disaster Figures for 2025 — Munich Re — January 2026. Munich Re
Swiss Re’s 2026 analysis provides a further explanation of the underlying loss trend. The institution estimates that expanding exposure contributes more than 80% of the global upward trend in weather-related insured losses, although the balance differs by hazard and geographical region. Its assessment also finds that losses associated with North American wildfires and European severe convective storms have been increasing faster than exposure alone, indicating that changes in hazard intensity and vulnerability must also be considered. This is a critical distinction for climate-related financial analysis. Growth in insured losses does not provide a direct measure of anthropogenic climate change, because economic development, construction in high-risk areas, higher property values, repair costs and insurance coverage influence the outcome. Equally, the importance of exposure growth does not imply that climatic changes are economically irrelevant. Both effects can operate simultaneously, and their relative importance can vary considerably across regions and hazards. Natural Catastrophes in 2025: The Persistent Rise of Wildfire and Storm Risk — Swiss Re Institute — March 2026, Executive Summary, p. 2. swissre.com
Table 8 — Global catastrophe losses: 2025 comparative institutional estimates
| Indicator | Munich Re | Swiss Re Institute | Scope and interpretation |
|---|---|---|---|
| Natural-catastrophe economic losses | US$224bn | US$220bn | Physical and associated economic losses under each institution’s methodology |
| Natural-catastrophe insured losses | US$108bn | US$107bn | Losses borne by insurers under the respective estimates |
| Natural-catastrophe losses not insured | Approximately US$116bn | Approximately US$113bn | Calculated from each institution’s rounded totals |
| Economic losses including man-made catastrophes | Not used in this comparison | US$235bn | Broader Swiss Re catastrophe perimeter |
| Insured losses including man-made catastrophes | Not used in this comparison | US$120bn | Broader Swiss Re insured-loss perimeter |
| Wildfires, floods and severe convective storms | US$166bn economic losses | Different hazard-group classification | Categories are not directly interchangeable |
| Insured losses from the same Munich Re grouping | US$98bn | Different hazard-group classification | Different categorisation and calculation |
| Ten-year average natural-catastrophe economic losses | US$266bn | US$267bn | Inflation-adjusted series; distinct institutional methods |
| Ten-year average insured natural-catastrophe losses | US$107bn | US$111bn | Inflation-adjusted series; distinct institutional methods |
Sources: Natural Disaster Figures for 2025 — Munich Re — January 2026; Swiss Re Institute sigma No. 1/2026 — March 2026. Economic and insured figures are estimates, not audited accounts of a single global reconstruction market.
The First Half of 2026: Lower Realised Losses Without a Corresponding Reduction in Structural Risk
The available evidence for the first half of 2026 confirms the importance of distinguishing short-term catastrophe outcomes from changes in longer-term risk. Swiss Re Institute estimated total economic losses from natural and man-made catastrophes of approximately US$107 billion during January–June 2026, compared with US$160 billion during the corresponding period of 2025, both expressed in 2026 prices. Insured losses from all catastrophes amounted to US$48 billion, compared with US$98 billion a year earlier. Restricting the analysis to natural catastrophes produces estimated economic losses of US$100 billion and insured losses of US$42 billion in the first half of 2026, compared with US$152 billion and US$91 billion, respectively, in the same period of 2025. The estimates were below the corresponding ten-year first-half averages, but this comparison describes the realised distribution of catastrophe events rather than a verified reduction in underlying exposure or vulnerability. First-Half 2026 Insured Catastrophe Losses: Below Trend, Rising Risks — Swiss Re Institute — 2026. Corporate – EQS News
Munich Re independently reported substantial uninsured losses during the first half of 2026, estimating that only US$44 billion of worldwide natural-disaster losses were insured and identifying an insurance protection gap of approximately 60%. These figures should not be conflated with Swiss Re’s estimates because the reporting methodologies differ. The broad economic conclusion is nonetheless consistent: catastrophic losses continue to place substantial financial burdens on households, enterprises and governments, while short-term reductions in the annual or semiannual insured-loss total can result from the absence of particularly destructive events rather than improvements in resilience. Lower Losses, Growing Risks: Natural Disaster Review for the First Half of 2026 — Munich Re — July 2026. Munich Re
Table 9 — Catastrophe-loss developments during the first half of 2026
| Swiss Re indicator | H1 2025 | H1 2026 | Ten-year H1 average | Unit |
|---|---|---|---|---|
| Total catastrophe economic losses | 160 | 107 | 119 | US$bn, 2026 prices |
| Natural-catastrophe economic losses | 152 | 100 | 111 | US$bn, 2026 prices |
| Man-made catastrophe economic losses | 8 | 7 | 7 | US$bn, 2026 prices |
| Total insured catastrophe losses | 98 | 48 | 56 | US$bn, 2026 prices |
| Insured natural-catastrophe losses | 91 | 42 | 50 | US$bn, 2026 prices |
| Insured man-made catastrophe losses | 7 | 6 | 6 | US$bn, 2026 prices |
Source: First-Half 2026 Insured Catastrophe Losses — Swiss Re Institute — 2026. The historical comparison is a first-half average for 2016–2025, not an annual average.
The Industrial Structure of Reconstruction and Disaster Restoration
The commercial economy associated with disaster recovery contains several interconnected markets whose business models, contractual relationships and investment requirements differ substantially. Emergency response involves the rapid mobilisation of personnel, equipment, temporary accommodation, transport and essential utilities. Property restoration encompasses water extraction, structural drying, smoke and fire remediation, hazardous-material removal, sanitation, equipment replacement and the repair of damaged buildings. Infrastructure reconstruction involves civil engineering, electricity networks, road and railway rehabilitation, water systems, telecommunications and public facilities. Insurance-related services include catastrophe assessment, claims administration, loss adjustment, risk modelling and specialist technical evaluation. The industrial supply chain supplying these activities includes cement, steel, timber, electrical equipment, machinery, construction materials, specialised vehicles and engineering services. These activities are economically linked through the recovery process, but the existence of demand across the different segments does not establish a single, clearly measurable global market without common definitions of which activities are included.
The distinction between market size and catastrophe losses is particularly important. The financial value of property damage does not equal the value of reconstruction contracts, because some assets are not replaced, some are repaired at a cost below replacement value, some losses concern business interruption rather than physical assets and some spending improves infrastructure beyond its pre-disaster condition. Likewise, restoration-sector revenue is not equivalent to insurance payouts. Insurance settlements may finance emergency repairs, permanent reconstruction, temporary living expenses, business interruption or other contractual obligations, depending on coverage. Governments may additionally finance recovery through infrastructure budgets, emergency appropriations or international assistance. The cumulative value of these flows cannot be estimated simply by adding catastrophe losses, insurance claims and reconstruction expenditure, since several figures may refer to the same underlying economic activity at different stages of the financing chain.
Business profitability within disaster-restoration markets depends on a further set of factors, including labour availability, speed of deployment, equipment ownership, operating scale, procurement arrangements and the ability to respond to concentrated surges in demand. A disaster may increase orders and prices for certain services while simultaneously creating shortages of qualified personnel, transportation capacity and building materials. These constraints can raise operating costs, delay contract execution and reduce the margin between revenue and profit. The financial attractiveness of a restoration company consequently depends on its pricing power, working-capital requirements, customer concentration, contract terms and exposure to the volatility of disaster activity. A business experiencing higher turnover in a severe catastrophe year does not necessarily generate proportionately higher net income, and an investor holding its shares cannot be assumed to realise the entire increase in operating revenue as a financial gain.
The role of public procurement introduces additional policy considerations. Governments frequently face pressure to restore essential infrastructure rapidly, while the urgency of emergency contracting can restrict the time available for conventional tendering, independent engineering assessment or extensive market consultation. Accelerated procedures may be necessary to protect public safety and economic continuity, but they can also increase risks concerning pricing, contractor selection, project specification and monitoring of delivered work. The appropriate institutional response is not to presume that private involvement is inherently exploitative, but to establish transparent contractual frameworks, independently verifiable performance requirements, appropriate audit arrangements and procedures for evaluating the economic value of reconstruction.
Table 10 — Disaster-recovery industries and their economic transmission mechanisms
| Segment | Main services | Demand mechanism | Principal commercial exposure | Public-interest concern |
|---|---|---|---|---|
| Emergency response | Rescue logistics, temporary shelter, emergency equipment | Immediate disaster response | Rapid deployment costs and uncertain duration | Speed, access and essential-service continuity |
| Property restoration | Water, fire, smoke and structural remediation | Damage to insured or uninsured property | Labour intensity, material costs and working capital | Quality, pricing and equitable access |
| Construction and civil engineering | Building and infrastructure repair | Replacement of damaged capital | Contract execution, materials and project delays | Cost control and infrastructure resilience |
| Utilities and communications | Electricity, water and telecommunications restoration | Network outages and asset damage | Equipment availability and operational coordination | Restoration of critical services |
| Insurance and reinsurance | Claims settlement and catastrophe risk transfer | Insured losses | Underwriting losses, reserves and capital requirements | Affordability and continuity of coverage |
| Claims and technical services | Assessment, loss adjustment, engineering inspection | Need to establish covered damage | Contractual volume and technical capacity | Independence and claims accuracy |
| Materials and equipment | Cement, steel, timber, machinery and electrical components | Rebuilding and replacement demand | Supply bottlenecks and price volatility | Procurement efficiency and supply-chain resilience |
| Adaptation engineering | Flood protection, reinforcement and resilient design | Investment to reduce future losses | Project financing and long delivery periods | Demonstrable reduction of vulnerability |
Analytical market classification. The categories describe economic mechanisms rather than an estimated aggregate market value.
Insurance Markets: Risk Transfer Is Not the Elimination of Economic Damage
Insurance and reinsurance occupy a central position in the catastrophe economy because they transform the immediate distribution of financial losses without eliminating the underlying physical damage. Premiums collected before a disaster finance the assumption of defined risks, while claims payments after the event transfer resources to policyholders under contractual conditions. Reinsurance redistributes portions of insurers’ exposure across specialist institutions, supporting their capacity to underwrite large or correlated risks. The financial system can thereby improve recovery liquidity and reduce the probability that individual households or enterprises bear catastrophic losses entirely from their own resources. However, the cost of insurance ultimately reflects expected claims, administrative expenses, capital requirements, uncertainty and market conditions. Higher catastrophe losses do not automatically benefit insurers merely because demand for coverage increases; they may instead result in underwriting losses, higher capital requirements, restrictions on coverage or withdrawal from particularly exposed markets.
Swiss Re’s 2026 analysis illustrates this tension by identifying substantial uninsured losses and noting that, in many emerging economies, 80–90% of natural-catastrophe losses remain uninsured. This is an important observation because it demonstrates that the commercial size of insured catastrophe markets can be much smaller than the economic losses suffered by vulnerable societies. In regions with limited insurance penetration, disasters may create substantial welfare losses without generating corresponding private insurance claims or large insured restoration markets. Conversely, in high-income regions with expensive insured property, a single event can generate very large claims even when the number of people affected is comparatively limited. Insurance statistics therefore reflect the interaction between hazard exposure and the distribution of insurable wealth, rather than providing a complete measure of human vulnerability. Natural Catastrophes in 2025: The Persistent Rise of Wildfire and Storm Risk — Swiss Re Institute — March 2026, Executive Summary, p. 2. swissre.com
The financial economics of insurance also creates a distinction between the level of insured losses and the profitability of underwriting. An insurer’s financial outcome depends on premiums earned, claims incurred, expenses, investment returns and the cost of capital over the relevant reporting period. Catastrophe claims represent liabilities arising from an insured event, not revenues earned from that event. Reinsurance recoveries can offset part of these liabilities for the primary insurer while creating corresponding claims for the reinsurer. Consequently, the existence of a large disaster-recovery economy does not imply that insurance companies profit from disasters in aggregate. The relevant financial accounts must be examined through underwriting results, reserve development, reinsurance arrangements, investment performance and capital adequacy.
Rising premiums can also create a feedback mechanism between insurance affordability and vulnerability. When risk-adjusted premiums increase faster than household incomes, some policyholders may reduce coverage, accept higher deductibles or withdraw from the market. This can increase the proportion of catastrophe losses that must be financed from savings, public assistance or additional borrowing. Where coverage becomes unavailable, property values and mortgage finance can be affected because the ability to insure an asset may influence its marketability and acceptability as collateral. Insurance markets therefore connect physical climate exposure with the broader financial system, and their sustainability increasingly depends on effective loss prevention rather than on the expansion of claims-handling capacity alone.
Reconstruction Supply Chains, Price Formation and Regional Economic Spillovers
Large disasters can generate concentrated demand for materials and services in geographical markets whose short-term productive capacity is relatively inflexible. Construction labour cannot necessarily relocate immediately, specialised equipment may be scarce and damaged transportation networks can raise the cost of delivering materials. As a result, reconstruction may produce temporary local price pressures and delays that complicate the relationship between expenditure and completed physical restoration. Higher contract prices can increase the nominal value of recovery activity without increasing the real quantity of infrastructure rebuilt. This distinction is important for public authorities evaluating reconstruction budgets, insurers estimating replacement costs and financial analysts assessing the profitability of construction-related enterprises.
Regional economic spillovers can extend beyond the disaster perimeter. The interruption of a transport corridor can affect manufacturing facilities, warehouses and retailers that depend on reliable deliveries. Electricity outages can reduce production even where factories themselves remain physically undamaged. Damage to ports, roads, telecommunications or water systems can impair multiple sectors simultaneously, with economic consequences that are not adequately represented by the replacement value of the damaged infrastructure. These indirect effects can persist when reconstruction is delayed or when households and enterprises are forced to alter production, employment or expenditure.
The World Bank’s Lifelines: The Resilient Infrastructure Opportunity provides a quantified basis for evaluating these effects. The study estimated that infrastructure disruptions impose costs of at least US$390 billion annually on households and firms in low- and middle-income countries. It also found that strengthening the resilience of infrastructure in those economies could generate approximately US$4.2 trillion in net benefits over the lifetime of new infrastructure, with an estimated four dollars of benefits for each dollar invested in resilience under its modelling assumptions. The additional cost of incorporating resilience was estimated at approximately 3% of overall infrastructure investment requirements. These figures are not current global disaster-loss estimates and should not be added to catastrophe-industry totals: they represent a distinct assessment of infrastructure-service disruption and the prospective economic value of resilience. Lifelines: The Resilient Infrastructure Opportunity — World Bank — 2019, Foreword and Overview. World Bank
The significance of this evidence is that it identifies an economically attractive alternative to relying primarily on post-disaster expenditure. Investment in infrastructure resilience can reduce expected damage, service interruption and recovery costs, potentially improving long-term economic productivity while limiting the fiscal volatility associated with repeated reconstruction. The efficiency of such investment nevertheless depends on local hazard conditions, the criticality of the infrastructure, maintenance arrangements and the quality of project selection. A resilience investment that is economically justified in one geographical location may not be efficient in another if the probability of damage, the value of protected services or the cost of protection differs substantially.
Key Judgments — Chapter 4
The global disaster economy is characterised by a substantial asymmetry between economic losses and the revenue opportunities generated by recovery activities. Natural catastrophes destroy capital, interrupt production and create fiscal and insurance liabilities, while simultaneously generating demand for restoration, infrastructure reconstruction, technical services and risk-management capabilities. These commercial activities are necessary components of recovery, but their revenue cannot be treated as a measure of net social benefit. The 2025 catastrophe figures, the first-half 2026 developments and the evidence concerning infrastructure resilience support the conclusion that growing exposure and vulnerability are materially important determinants of financial losses, while the profitability of individual recovery businesses cannot be extrapolated into a generalised economic benefit from disasters.
What would change the assessment: A comprehensive and consistently defined financial dataset demonstrating that the net returns earned across disaster-recovery industries systematically exceed the corresponding losses experienced across the wider portfolios of their investors would strengthen claims of aggregate financial benefit. Such a conclusion would additionally require evidence that the gains were sufficiently large, persistent and attributable to disaster frequency or severity rather than to ordinary economic development, and that they influenced decisions relevant to climate mitigation.
Open official record: The principal unresolved evidence concerns comparable global reconstruction expenditure, the separation of insured settlements from actual restoration spending, publicly financed procurement contracts, net profitability across disaster-related industries and the attribution of indirect production losses. These data are necessary to move from the documented existence of commercial opportunities to a defensible assessment of their broader economic significance.
Chapter 5. Institutional Investors and the Financial Incentives of Climate Risk
The Financial System’s Exposure to Climate Change Extends Far Beyond the Companies Supplying Reconstruction Services
The principal judgment is that the financial consequences of climate change for institutional investors are determined by the combined exposure of assets, liabilities, cash flows, insurance obligations and investment horizons, rather than by the existence of profitable businesses operating in catastrophe recovery or adaptation. The expansion of commercial demand for protective infrastructure, restoration services or specialised equipment does not establish that diversified financial institutions benefit from increasing climate-related damage across their portfolios. Such institutions may hold assets whose financial performance improves when adaptation expenditure expands, but they also hold claims on property, industrial enterprises, infrastructure, sovereign debt and other productive assets exposed to physical hazards and the economic consequences of environmental disruption. The relevant question is therefore one of net financial exposure, adjusted for diversification, valuation, contractual arrangements and the capacity of businesses or financial intermediaries to transfer risk. The presence of a recovery-related revenue stream is only one element of that calculation.
The distinction becomes particularly important for institutional investors managing broad portfolios across multiple sectors and jurisdictions. Pension funds, insurance companies, asset managers, sovereign investment institutions and other financial intermediaries differ in their objectives, liabilities, regulatory obligations and investment horizons. A pension institution financing retirement benefits may have long-dated obligations whose economic sustainability depends on real investment returns and the stability of the wider economy. An insurer must manage underwriting liabilities alongside its financial assets. A commercial bank faces credit, liquidity and collateral risks, while an asset manager administers investments under contractual mandates established by beneficiaries or clients. These arrangements determine how climate-related financial outcomes are transmitted through the institution and whether a given market development is economically favourable or adverse.
The treatment of climate change as a source of financial risk has become increasingly operational within central banking and financial supervision. The European Central Bank identifies physical climate hazards as potential sources of corporate repayment difficulties, reductions in collateral values and adverse developments in financial asset performance. Its analytical indicators include exposure to coastal and river flooding, wildfires, landslides, subsidence, windstorms, water stress, droughts and rainfall variation, and they are designed to connect geographical hazards with the financial exposures of firms and financial institutions. This approach is institutionally significant because it evaluates climate change through the vulnerability of balance sheets and counterparties, rather than through a presumption that financial capital necessarily profits from environmental deterioration. Analytical Indicators on Physical Risks — European Central Bank — 2025. European Central Bank
The financial-risk architecture requires a distinction between physical risk and transition risk. Physical risk concerns the potential effects of natural hazards and changing climatic conditions on productive assets, infrastructure, households, enterprises and financial counterparties. Transition risk concerns changes in policy, technology, market demand, production costs and asset valuations associated with the movement toward lower-emission economic activity. Although both categories are relevant to climate change, they may affect different assets in different directions. A producer of low-emission technology may benefit from particular transition policies while remaining exposed to flooding or supply-chain disruption. A carbon-intensive manufacturer may face higher compliance costs while also benefiting from strong demand for its products. A reconstruction company may experience increased sales following damaging events while facing higher operating costs, credit risk or disruption to its own facilities. A portfolio containing all three enterprises cannot be evaluated by focusing on only one favourable revenue effect.
Asset Pricing, Discounted Cash Flows and the Financial Transmission of Physical Climate Risk
The market value of an investment depends on expectations regarding future cash flows, the time at which those cash flows occur and the discount rates applied to them. Climate-related damage can influence each component of this valuation process. Physical damage may reduce production capacity, require unplanned capital expenditure or interrupt revenues. Changing insurance costs can alter operating expenses and the expected profitability of particular assets. Infrastructure failures may increase logistical costs or disrupt market access. Greater uncertainty concerning future losses can influence the return required by investors, particularly where risks are concentrated, difficult to diversify or not adequately reflected in existing financial contracts. These effects can reduce asset values even when the affected company does not experience a catastrophe during the current accounting period.
The relationship between physical climate risk and valuation also depends on the distinction between expected losses and unexpected shocks. An identifiable and recurring hazard may already be incorporated into insurance premiums, property prices or investment hurdle rates. A more severe event than anticipated can produce additional losses, while an improvement in resilience or risk information can alter valuations in the opposite direction. The capacity of the market to price these exposures depends on the quality of hazard modelling, access to geographical information, the availability of historical data and the treatment of future conditions that may differ materially from past experience. This creates particular difficulties for long-lived infrastructure, commercial property and assets whose profitability depends on climate-sensitive production or transportation networks.
The ECB’s July 2026 account of its climate-related collateral framework provides a concrete example of how these risks are being incorporated into financial operations. On 15 June 2026, the Eurosystem introduced climate factors into its collateral valuation framework for relevant corporate bonds used by banks when borrowing from the central bank. The mechanism is designed to protect the Eurosystem against unexpected declines in collateral value caused by climate-related transition shocks. The ECB’s assessment combines three components: a sectoral stressor reflecting the potential market impact of transition shocks, issuer-level exposure incorporating emissions and transition-related information, and a vulnerability component related to the residual maturity of the financial instrument. The resulting measure affects the collateral value assigned to eligible bonds, thereby connecting climate-related uncertainty with the central bank’s existing financial-risk controls. Climate Factors: How the ECB Tackles Climate Uncertainty in Its Collateral Framework — European Central Bank — July 2026. European Central Bank
This development has implications extending beyond the technical treatment of collateral. Financial assets issued by the same industry can possess different sensitivities to transition shocks because their issuers differ in emissions characteristics, investment plans and disclosure quality. Similarly, long-dated instruments may remain exposed to uncertainty over a longer period than securities approaching maturity. The financial relevance of climate risk therefore cannot be captured through a binary classification separating carbon-intensive companies from all other businesses. It requires an evaluation of specific issuers, assets, contractual maturities and plausible economic developments. The ECB also indicated that the immediate effect of these factors on banks was expected to be limited because of prevailing low borrowing levels and the limited use of corporate bonds as collateral. This qualification is material: the adoption of a risk-control mechanism does not establish that it has already produced a large change in financing volumes or market valuations. Climate Factors: How the ECB Tackles Climate Uncertainty in Its Collateral Framework — European Central Bank — July 2026. European Central Bank
Diversification Does Not Eliminate Economy-Wide Climate Exposure
Diversification can reduce the exposure of an investment portfolio to risks specific to individual enterprises, geographical locations or industries. However, it cannot automatically eliminate risks that affect multiple sectors simultaneously or alter the productive capacity of the wider economy. Climate-related disruptions may influence energy prices, agricultural output, transportation networks, insurance costs, public borrowing requirements and financial conditions across jurisdictions. A diversified portfolio can spread some company-specific losses, but the same strategy may leave investors exposed to correlated economic effects that cannot be avoided simply by holding a larger number of securities.
The distinction between idiosyncratic and systemic risk is central. The destruction of one insured building may represent a manageable exposure for a geographically diversified institution, particularly where the claim is small relative to its capital and other investments. Widespread infrastructure interruption affecting a large metropolitan region, multiple industrial facilities and related supply chains creates a different financial problem because losses can arise simultaneously across property, credit, corporate earnings and public finances. Similarly, a disorderly transition can affect the profitability and valuations of multiple industries through energy prices, regulatory developments and technological substitution. The financial consequences are not necessarily concentrated in the businesses directly releasing greenhouse gases, because intermediate suppliers, customers, creditors and investors may also be affected.
This is why the mere presence of adaptation-related companies in a diversified portfolio does not establish a general incentive to favour worsening climate outcomes. An investor might benefit from higher revenues at a restoration business while experiencing losses in commercial real estate, agricultural holdings, infrastructure assets or financial companies. The investor’s net position depends on the relative size and sensitivity of these exposures, as well as the valuation changes associated with expected future risks. The benefits of adaptation investment can therefore coexist with an economic preference for avoiding the disasters that create demand for it. Indeed, investment in protective infrastructure may be financially attractive precisely because it reduces the expected losses associated with future hazards.
Insurance Companies and the Asymmetry Between Investment Income and Underwriting Liabilities
Insurance institutions occupy a distinctive position because they are simultaneously investors and providers of financial protection against specified risks. Their balance sheets contain investment assets intended to support future obligations, while their underwriting activities expose them to claims arising from insured events. An increase in catastrophe-related expenditure may benefit some businesses held in an insurer’s investment portfolio, but the same events may produce substantially larger underwriting liabilities. The net financial effect depends on premium income, claims incurred, reinsurance recoveries, investment performance, capital requirements and the geographical and contractual distribution of insured risks.
The concentration of insured losses in particular hazard categories can alter underwriting strategy and capital allocation. Swiss Re’s 2026 assessment identifies severe convective storms, wildfires and floods as increasingly significant contributors to natural-catastrophe insurance losses, with these secondary perils accounting for 92% of global natural-catastrophe insured losses in 2025. The institution also estimates that global insured catastrophe losses have followed a long-term real growth trend of approximately 5–7% annually, influenced substantially by increasing exposure and changing risk conditions. These estimates do not demonstrate that insurers systematically lose money in every disaster year, but they establish that the financial obligations created by catastrophe risk are material and cannot be excluded from any assessment of institutional incentives. Natural Catastrophes in 2025: The Persistent Rise of Wildfire and Storm Risk — Swiss Re Institute — March 2026, Executive Summary, pp. 2–3. swissre.com
Swiss Re’s scenario analysis further indicates that insured natural-catastrophe losses could reach approximately US$148 billion in a trend year during 2026, or approximately US$320 billion under its specified peak-loss scenario. For 2030, the institution estimates approximately US$186 billion under the continuation of its long-term trend and around US$400 billion under a peak-loss scenario. These are not realised losses or deterministic forecasts. They are outputs of a proprietary catastrophe-risk framework and depend on assumptions concerning exposure, risk distribution and the statistical characteristics of severe events. Their value for financial analysis lies in demonstrating the potential scale of underwriting liabilities under different conditions, rather than establishing a particular outcome as inevitable. Natural Catastrophes in 2025: The Persistent Rise of Wildfire and Storm Risk — Swiss Re Institute — March 2026, Executive Summary, p. 2. swissre.com
Table 11 — Swiss Re catastrophe-risk estimates and their financial meaning
| Indicator | Value | Reference period | Interpretation |
|---|---|---|---|
| Observed insured natural-catastrophe losses | US$107bn | 2025 | Historical modelled insurance losses |
| Long-term average real growth trend | 5–7% annually | Historical trend | Trend in insured catastrophe losses, not a pure climate-attribution estimate |
| Trend-year insured losses | US$148bn | 2026 scenario | Model-based projection |
| Peak-loss insured losses | US$320bn | 2026 scenario | Severe insured-loss scenario |
| Trend-year insured losses | US$186bn | 2030 scenario | Continuation of long-term loss trend |
| Peak-loss insured losses | Approximately US$400bn | 2030 scenario | Model-based severe-loss scenario |
| Emerging-economy uninsured proportion | Approximately 80–90% | Reported 2026 assessment | Indicative protection gap in many emerging economies |
Source: Swiss Re Institute, sigma No. 1/2026, Natural Catastrophes in 2025 — March 2026. The 2026 and 2030 scenarios are not observed data, and the peak-loss estimates must not be presented as expected annual outcomes.
Asset Managers, Market-Wide Ownership and the Structure of Financial Incentives
Large diversified asset managers administer investments across an extensive range of sectors, securities and geographical jurisdictions. Their portfolios can include financial exposure to carbon-intensive energy producers, low-emission technology developers, insurance institutions, construction enterprises, utilities, banks, transport companies and property-related assets. This structure follows from market-wide investment strategies, client mandates and the objectives of diversification. The coexistence of these holdings does not establish that the asset manager has a single economic preference concerning the trajectory of climate change. The expected return of a diversified portfolio is shaped by the combined performance and valuation of its constituents, including the effects of climate-related shocks on businesses that do not participate directly in recovery markets.
The relevant incentives also differ between an investment manager and the ultimate asset owner. An asset-management business may earn fees linked to assets under management, investment performance or other contractual arrangements, while the underlying securities are held for the benefit of clients. Market-wide declines in asset values can therefore affect the economic interests of beneficiaries even where the manager’s own operating revenues are governed by a different fee structure. Voting authority may be delegated to the manager, retained by clients or otherwise allocated according to the relevant arrangements. These distinctions complicate any attempt to treat all assets administered by large managers as though they were owned outright by the management company or controlled through identical governance mechanisms.
There are nevertheless circumstances in which concentrated financial influence can affect corporate incentives. Large shareholders may exercise voting rights, participate in engagement processes or influence executive remuneration and capital allocation. Investors can advocate for changes in transition strategies, disclosure, investment priorities and corporate governance. The question is whether the exercise of such influence is supported by the underlying financial incentives and whether it produces identifiable corporate outcomes. A significant equity holding can create the opportunity for influence, but evidence of an actual policy preference or coordinated strategy requires an examination of documented governance actions rather than an inference from the portfolio’s sectoral composition.
The possibility of conflicting incentives is particularly relevant in companies whose business models depend on existing carbon-intensive infrastructure or on regulatory arrangements affecting the profitability of specific technologies. An investor holding a concentrated position in such a company may have an economic interest in extending the productive life of its assets, while another investor with substantial exposure to low-emission technologies may favour accelerated substitution. A diversified institution may hold both interests simultaneously, and its net incentives may be influenced by broader economic consequences. The relevant analytical task is therefore to identify concentrated exposures, contractual relationships and documented governance behaviour, rather than assume that a uniform incentive can be assigned to all holders of financial wealth.
The Conditions Under Which Climate-Related Conflicts of Interest Become Economically Significant
A climate-related conflict of interest becomes analytically meaningful when an actor possesses an identifiable financial benefit associated with a particular policy or operational outcome and also has a credible mechanism through which it can influence the decision producing that outcome. Both elements matter. A company may benefit from a higher volume of disaster-restoration activity while possessing no relevant authority over greenhouse-gas emissions or climate policy. Another enterprise may possess substantial influence over regulatory arrangements affecting its own emissions-intensive assets, but its financial incentives may relate primarily to compliance costs rather than the wider catastrophe economy. Treating these positions as equivalent obscures the mechanisms through which private financial interests can influence public outcomes.
The distinction also requires attention to timing. Adaptation investments can generate revenue before disasters occur, while reconstruction services generate much of their demand after damage has been realised. A company supplying flood defences may earn higher revenue because governments invest in preventing future losses, not because additional flooding occurs. A business that repairs damaged buildings may benefit from a particular event, but its long-term profitability can be constrained by competition, price regulation, labour availability and the willingness of insurers or governments to pay for services. A company providing risk modelling may benefit from greater demand for accurate risk information even if improved prevention subsequently reduces disaster losses. These examples demonstrate why the existence of commercial demand associated with climate risk does not identify a common preference for greater environmental damage.
A defensible incentive assessment must consequently combine financial, governance and operational evidence. Financial information should establish the magnitude and persistence of the relevant benefits after costs, liabilities and losses. Governance evidence should identify the actor’s actual capacity to affect corporate or public decisions. Operational evidence should demonstrate how the resulting decision changes emissions, vulnerability or financial exposure. Without this combination, an observed correlation between wealth, financial investment and climate-related commercial activity remains insufficient to support a causal conclusion concerning deliberate obstruction of mitigation.
Table 12 — Evidence required to establish climate-related financial conflicts of interest
| Proposition | Necessary financial evidence | Necessary governance evidence | Necessary causal evidence |
|---|---|---|---|
| An investor benefits from disaster recovery | Net returns from relevant holdings | Ownership and investment mandate | Demonstration of benefit attributable to recovery activity |
| An investor benefits from increasing disasters overall | Portfolio-wide gains exceeding associated losses | Relevant decision-making incentives | A defensible counterfactual linking greater disasters to net gains |
| An investor influences mitigation policy | Exposure to affected policy outcomes | Documented lobbying, voting or financing influence | Connection between intervention and actual policy decision |
| An investor delays industrial decarbonisation | Financial advantage from delayed transition | Governance authority or contractual leverage | Evidence that the intervention changed investment or operating decisions |
| An insurer benefits from catastrophe exposure | Underwriting and investment results after claims | Pricing, underwriting and capital allocation decisions | Sustained profitability attributable to the specified exposure |
| A reconstruction business earns exceptional returns | Margins, cash flow and returns on invested capital | Market position and contract terms | Distinction between competitive returns and economic rents |
Analytical evidence framework. The table specifies conditions required to test the propositions; it does not assert that any named investor satisfies them.
Climate Risk and the Strategic Responsibilities of Financial Supervision
The integration of climate-related risks into financial supervision should be understood primarily as an effort to preserve the resilience of financial institutions and the wider financial system under changing economic conditions. Supervisory authorities must consider how physical hazards can affect borrowers, collateral and insurers, while transition developments can alter asset valuations, cash flows and business models. These risks interact with conventional financial vulnerabilities, including leverage, liquidity, concentration, maturity transformation and counterparty dependencies. Their significance cannot be adequately assessed through the presence or absence of particular portfolio holdings, because financial stability depends on the combined exposure of institutions and their capacity to absorb adverse developments.
The ECB’s collateral framework demonstrates the practical application of this approach by translating climate-related transition uncertainty into a valuation adjustment relevant to central-bank lending. The mechanism does not assume that all high-emission assets will become worthless or that all low-emission assets are financially secure. Instead, it differentiates exposure according to sectoral vulnerability, company characteristics and security maturity. This is a more defensible approach than imposing a universal financial judgment based solely on industry classification, because the financial consequences of transition depend on the interaction between business models, investment strategies and changing economic conditions. Climate Factors: How the ECB Tackles Climate Uncertainty in Its Collateral Framework — European Central Bank — July 2026. European Central Bank
The resulting supervisory challenge is to distinguish accurate risk recognition from financial policies that unintentionally encourage the transfer of emissions-intensive assets outside transparent reporting systems without changing their physical operation. Institutions may legitimately seek to reduce exposure to transition risk, but public authorities should evaluate whether changes in financing conditions contribute to actual industrial transformation or simply alter the ownership and location of emissions-related financial exposure. The objective is not to require financial institutions to absorb unlimited environmental risk, but to ensure that their risk-management responses are understood in relation to broader economic and environmental outcomes.
Key Judgments — Chapter 5
Institutional investors face climate-related risks through multiple financial channels, including asset valuation, credit exposure, insurance liabilities, collateral values and changes in corporate profitability. Diversification can reduce company-specific exposure but does not necessarily eliminate correlated losses affecting the wider economy. Financial opportunities associated with adaptation and recovery do not establish an aggregate incentive to favour increasing disasters, particularly where investors also hold climate-sensitive assets elsewhere in their portfolios. The most consequential risks for financial governance arise where concentrated exposures coincide with identifiable decision-making authority and documented incentives capable of influencing emissions-related policy or investment outcomes.
What would change the assessment: Verified portfolio-level evidence demonstrating sustained positive net financial exposure to increasing climate damage across a representative group of diversified institutional investors would justify reconsideration of the current judgment. Such evidence would need to account for underwriting liabilities, valuation effects, physical damage, financial interdependencies and the distinction between realised returns and hypothetical gains. Evidence of coordinated governance or policy interventions designed to preserve economically beneficial exposure would be required to establish a corresponding incentive to delay mitigation.
Open official record: The principal requirements are sufficiently granular institutional portfolio disclosures, climate-sensitive asset valuations, insurance and reinsurance exposures, documented corporate governance interventions, investment mandates and supervisory assessments capable of distinguishing physical climate shocks from transition-related financial developments.
Chapter 6. The International Political Economy of Adaptation
Adaptation Finance as a Structural Development and Sovereign-Risk Problem
The principal judgment is that the international adaptation challenge is not simply a shortage of investable projects or a failure to attract private capital, but a structural mismatch between the geographical distribution of climate vulnerability, the fiscal capacity of exposed countries, the financing conditions available to their governments and the economic characteristics of investments required to protect populations and productive systems. Many of the investments capable of reducing climate-related losses generate substantial public benefits that cannot easily be converted into predictable private revenues. Flood defences, emergency-warning networks, drainage systems, coastal protection, climate-resilient public infrastructure and institutional disaster preparedness can improve economic welfare and reduce future fiscal liabilities, but their benefits frequently accrue across broad populations rather than to identifiable paying customers. Consequently, the capacity to mobilise adaptation investment depends on public finance, multilateral development institutions, concessional lending, grant resources, sovereign debt conditions and the effectiveness of national project-development systems.
The international financing architecture must also reconcile different categories of economic need. Preventive adaptation investment seeks to reduce expected future exposure and vulnerability. Disaster preparedness aims to strengthen response capacity before hazardous events occur. Recovery finance becomes necessary after damage has been realised, while reconstruction may replace lost assets or incorporate improved resilience. Financial instruments serving these functions differ because their timing, beneficiaries, repayment sources and risk characteristics are not identical. A concessional loan financing a revenue-generating water project cannot be treated as economically equivalent to a grant supporting early-warning capabilities, nor should an insurance payout following a disaster be recorded as preventive adaptation investment merely because both relate to climate risk. The distinction matters for international commitments and development-finance evaluation because aggregated climate-finance figures may include different instruments, objectives and accounting conventions.
The latest fully retrievable quantified financing series established in this assessment comes from the OECD’s May 2026 report on climate finance provided and mobilised by developed countries during 2013–2024. The OECD reported US$132.8 billion in 2023 and US$136.7 billion in 2024 in total climate finance provided and mobilised for developing countries. These figures encompass mitigation, adaptation and activities with combined objectives, and therefore cannot be interpreted as adaptation finance alone. Within the same statistical framework, adaptation finance amounted to US$33.6 billion in 2023 and US$34.7 billion in 2024, representing approximately one quarter of the corresponding total climate-finance flows. Public finance accounted for more than 90% of the adaptation component in those two years. These figures establish both the continuing increase in reported international climate finance and the comparatively limited scale of financing explicitly assigned to adaptation. Climate Finance Provided and Mobilised by Developed Countries in 2013–2024 — Organisation for Economic Co-operation and Development — May 2026. OECD
An important limitation concerns the interpretation of financing commitments and reported flows. The OECD aggregates include public financial resources and private financing mobilised through recognised public interventions, with particular conventions governing the attribution of multilateral flows to developed countries. They do not necessarily represent grants received by governments, net fiscal transfers or projects already completed. Public climate finance can consist of loans, grants and equity instruments, each possessing different implications for debt, repayment obligations and the economic value of the support received. Similarly, a commitment announced at an international conference does not necessarily correspond to an amount disbursed within the same year. The distinction between commitments, approvals, disbursements and completed investments is therefore essential to understanding whether international financing is actually expanding adaptation capacity.
International Climate Finance: The Scale, Composition and Limits of Existing Flows
The OECD’s latest series shows a measurable increase in aggregate climate finance during the period from 2022 to 2024, following the first achievement of the previous international US$100 billion annual financing objective in 2022. Total finance provided and mobilised rose from US$115.9 billion in 2022 to US$132.8 billion in 2023 and US$136.7 billion in 2024. The increase of US$20.8 billion between 2022 and 2024 represents growth of approximately 17.9% calculated from the published rounded totals. The slower growth between 2023 and 2024, amounting to US$3.9 billion, suggests that the strong increase recorded in the preceding period did not continue at the same pace. The pattern is relevant because financing requirements are projected to expand substantially while annual flows remain affected by public budgets, development-bank lending capacities, private-investment conditions and the availability of economically viable projects. Climate Finance Provided and Mobilised by Developed Countries in 2013–2024 — OECD — May 2026. OECD
The sectoral distribution also demonstrates that mitigation remains the largest component of reported international climate finance. OECD data show US$87.3 billion in mitigation finance during 2023 and US$86.9 billion during 2024, compared with adaptation finance of US$33.6 billion and US$34.7 billion. Financing for activities combining mitigation and adaptation objectives increased from US$11.9 billion to US$15.1 billion over the same period. These categories serve different purposes, and the combined component should not automatically be added in full to adaptation finance because doing so would attribute the entire financing value of integrated projects to one objective. The allocation of financial resources reflects both the relative investment requirements of different sectors and the availability of revenue-generating projects that can attract commercial financing. Energy-generation investments may possess identifiable electricity revenues, while flood-risk reduction, ecosystem protection or public preparedness frequently rely more heavily on government resources. Climate Finance Provided and Mobilised by Developed Countries in 2013–2024 — OECD — May 2026. OECD
Table 13 — International climate finance provided and mobilised by developed countries
| Financing category | 2022 | 2023 | 2024 | Measurement |
|---|---|---|---|---|
| Total climate finance | US$115.9bn | US$132.8bn | US$136.7bn | Annual finance provided and mobilised |
| Adaptation finance | US$32.4bn | US$33.6bn | US$34.7bn | Finance attributed to adaptation |
| Mitigation finance | Not reproduced here | US$87.3bn | US$86.9bn | Finance attributed to mitigation |
| Cross-cutting finance | Not reproduced here | US$11.9bn | US$15.1bn | Activities pursuing both objectives |
| Public adaptation finance | Not reproduced here | US$30.6bn | US$31.7bn | Public portion of adaptation flows |
| Total public climate finance | Not reproduced here | US$104.3bn | US$101.6bn | Bilateral and attributed multilateral public finance |
| Private climate finance mobilised | US$21.9bn | US$22.9bn | US$30.5bn | Mobilisation attributable to relevant public interventions |
Sources: Climate Finance Provided and Mobilised by Developed Countries in 2013–2024 — OECD — May 2026; Climate Finance Provided and Mobilised by Developed Countries in 2013–2022 — OECD — May 2024. Values reflect the OECD’s attribution methodology and reported rounding. The entries marked as not reproduced are excluded rather than estimated.
An additional consideration is that international financing flows cannot be assessed solely through their nominal dollar values. The economic value of assistance depends on whether financing is concessional, whether resources are disbursed when required, whether recipient countries bear exchange-rate risk and whether projects generate sufficient benefits to justify future repayment obligations. A nominally large loan may offer less effective support than a smaller grant when the financed activity produces public benefits without a direct revenue stream, particularly where fiscal capacity is limited. Conversely, lending may be appropriate where an adaptation project generates stable economic returns or measurable cost savings sufficient to support repayment. The appropriate financing instrument should therefore follow the characteristics of the investment rather than an institutional preference for maximizing reported financing volumes.
Grants, Loans and the Distribution of Sovereign Financial Risk
The predominance of debt instruments within international public climate finance introduces an important connection between adaptation policy and sovereign debt sustainability. According to the OECD’s May 2026 assessment, loans represented 67% of public climate finance in 2024, amounting to approximately US$68.5 billion, while grants represented 29%, or US$29.7 billion. Equity instruments accounted for approximately 3%, or US$3.3 billion. The corresponding 2023 figures were approximately 73% loans, 24% grants and 4% equity, with differences arising from rounding. These percentages concern total public climate finance rather than adaptation alone, and should not be used to describe the financing composition of adaptation projects without further disaggregation. Nevertheless, they demonstrate that debt-based financing remains an important component of the wider international climate-finance architecture. Climate Finance Provided and Mobilised by Developed Countries in 2013–2024 — OECD — May 2026. OECD
The macroeconomic consequences depend on the recipient country’s initial debt position, revenue base, borrowing currency and vulnerability to external shocks. Adaptation investment can reduce expected future losses and strengthen productive capacity, potentially improving fiscal sustainability over time. However, debt-financed projects increase contractual repayment obligations before their protective benefits have necessarily materialised. Countries facing high borrowing costs or significant foreign-currency exposure may encounter difficulties financing preventive infrastructure, particularly where climate-related disasters can simultaneously reduce government revenue and increase emergency spending. In such circumstances, the financing problem is not simply the absence of economically beneficial projects but the incompatibility between the timing of their benefits and the terms on which capital can be obtained.
The IMF’s February 2025 assessment of the macroeconomic effects of natural disasters supports the importance of pre-existing fiscal conditions. It finds that countries with limited fiscal space tend to experience more pronounced adverse output effects following disasters, while small-island economies face particularly significant economic exposure. These results imply that adaptation financing and sovereign-risk management cannot be separated. A country entering a disaster with limited budgetary flexibility may be less able to undertake emergency expenditure, sustain public investment or prevent a temporary shock from generating prolonged economic weakness. Understanding the Macroeconomic Effects of Natural Disasters — IMF — February 2025. Fondo Monetario Internazionale
The relationship between climate vulnerability and debt sustainability may also create a reinforcing cycle. Countries with high exposure to hazards can face greater perceived investment risk and more restrictive borrowing conditions, while those conditions limit their capacity to finance protective infrastructure. Inadequate adaptation leaves productive assets exposed, potentially increasing future fiscal liabilities and reducing the resources available for development. This mechanism is not inevitable: concessional finance, credible public investment management, improved infrastructure design and risk-sharing instruments can weaken the relationship. It nevertheless explains why treating adaptation entirely as a private-investment problem is insufficient, especially where the principal beneficiaries are vulnerable populations and public-service users.
Table 14 — Financial instruments and their implications for adaptation capacity
| Instrument | Financial structure | Principal advantage | Main fiscal or institutional limitation | Suitable application |
|---|---|---|---|---|
| Direct grants | Non-repayable public finance | Does not create conventional debt-service obligations | Budget availability and project governance | Public goods and vulnerable communities |
| Concessional loans | Debt with below-market or otherwise favourable terms | Provides financing at reduced cost | Future repayment and currency exposure | Projects with sufficient economic or fiscal returns |
| Commercial loans | Market-based debt | Can expand financing availability | Borrowing costs and refinancing risk | Revenue-generating projects with manageable risk |
| Public equity | Ownership participation | Shares financial risk and potential returns | Governance and valuation complexity | Commercially structured adaptation enterprises |
| Guarantees | Public assumption of specified risks | Can support private financing | Contingent fiscal liabilities | Projects constrained by identifiable financial risks |
| Disaster contingency credit | Prearranged financing for eligible events | Accelerates liquidity after shocks | Drawdown and repayment conditions | Emergency fiscal response |
| Parametric insurance | Payments triggered by defined parameters | Can provide rapid liquidity | Basis risk between trigger and actual loss | Disaster-response financing |
| Public procurement | Government contracts for infrastructure or services | Direct provision of protective assets | Cost escalation, execution and oversight | Flood protection and essential infrastructure |
Analytical classification. Instrument suitability depends on the specific project’s cash flows, public benefits, credit conditions and institutional context.
The New International Climate-Finance Architecture After COP29
The international negotiation framework has evolved toward substantially larger stated financing objectives, although the relationship between collective goals and the resources ultimately received by developing countries remains dependent on implementation. At COP29 in Baku, the Parties agreed a new collective quantified goal involving at least US$300 billion annually by 2035 for developing-country climate action, with developed countries taking the lead and financing envisaged from a wide variety of sources, including public, private, bilateral and multilateral channels. The decision also called on all actors to work toward scaling up financing to developing countries to at least US$1.3 trillion annually by 2035. These two quantities are not separate adaptation-finance commitments and should not be combined into a US$1.6 trillion total. The broader objective concerns the expansion of climate finance across public and private sources, while the US$300 billion goal establishes a distinct collective financing benchmark within that framework. COP29 UN Climate Conference Agrees to Triple Finance to Developing Countries — United Nations Framework Convention on Climate Change — November 2024. UNFCCC
The distinction is central to international financial governance because aggregate climate-finance targets do not necessarily prescribe how much money must be allocated to adaptation, which countries should receive it or how much should take the form of grants rather than loans. The allocation of funding depends on negotiated priorities, national plans, development-bank strategies, project pipelines and the willingness of private investors to participate under particular risk-return conditions. A country with substantial mitigation-investment opportunities may be able to mobilise private capital for power generation or industrial infrastructure, whereas a highly vulnerable country seeking financing for coastal protection or disaster preparedness may require a larger share of concessional or grant-based resources. The achievement of an aggregate financing objective therefore cannot establish that the adaptation requirements of the most exposed countries have been satisfied.
The international policy debate must also address the relationship between financial mobilisation and additionality. If public support encourages private investment that would not otherwise have occurred, it can expand the resources available for climate action. However, the calculation of mobilised private finance requires transparent attribution rules to avoid overstating the impact of public intervention. Likewise, financing provided through existing development programmes may contribute to climate objectives while raising questions about whether the resources are additional to other development commitments. These issues affect the credibility of reported progress because the economic outcome depends on the actual increase in available investment and resilience, not merely on the administrative classification of financing.
Adaptation Requirements, Financial Gaps and the Problem of Comparability
Estimating adaptation financing needs presents methodological difficulties distinct from those associated with measuring financial flows. Needs assessments can incorporate expected infrastructure investment, the costs of protecting economic activities, national adaptation plans and modelled responses to future climate conditions. Different methods may produce different estimates because they use different assumptions concerning future hazards, economic development, policy ambition and the scope of investments included. Financing-flow estimates, by contrast, depend on transactions, accounting conventions, donor attribution and the classification of project objectives. Comparing the two can identify broad financing imbalances, but the resulting difference should not automatically be interpreted as a precisely measured annual budget deficit unless the underlying definitions are compatible.
The UNEP’s 2025 Adaptation Gap Report estimated developing-country adaptation requirements of approximately US$310–365 billion annually by 2035, depending on the estimation approach. The report also identified international public adaptation flows of approximately US$26 billion in 2023. The large difference between the estimated requirements and historical international public finance illustrates the scale of the challenge, but the figures represent different periods and accounting categories. A complete assessment must also consider domestic public finance, private investment, cross-cutting projects and the extent to which estimated needs can be financed through existing infrastructure programmes. The comparison is therefore an indicator of financing pressure rather than a precise measurement of the future funding shortfall. Adaptation Gap Report 2025: Running on Empty — United Nations Environment Programme — October 2025.
UNEP published an Adaptation Gap Report 2026 entry dated 28 October 2026. The accessible institutional record identifies the report’s focus on adaptation planning, financing, implementation and barriers to effective action, but the linked repository entry was still marked as forthcoming when examined. Consequently, a replacement numerical series from the 2026 report cannot be established from the retrieved record, and the 2025 quantified estimates remain the verified baseline for this analysis rather than being presented as the latest figures definitively available across all sources. Adaptation Gap Report 2026 — United Nations Environment Programme — October 2026. UNEP – UN Environment Programme
The distinction between UNEP and OECD financing figures is equally important. The OECD’s US$34.7 billion adaptation total for 2024 and UNEP’s US$26 billion international public adaptation figure for 2023 do not constitute an automatically comparable two-year series. They differ in reference period, reporting coverage, aggregation conventions and the treatment of financing categories. The OECD figure includes adaptation finance provided and mobilised through its specified developed-country attribution methodology, while UNEP’s public-flow measure serves a different analytical purpose within its adaptation-gap assessment. Interpreting the numerical difference as a year-on-year increase without reconciling the methodologies would create an artificial trend.
Table 15 — Adaptation finance: verified needs, flows and international objectives
| Indicator | Value | Reference year | Institutional meaning |
|---|---|---|---|
| Developing-country adaptation needs | US$310–365bn annually | 2035 estimate | UNEP projected requirements |
| International public adaptation finance | US$26bn | 2023 | UNEP historical public-flow estimate |
| Adaptation finance provided and mobilised | US$33.6bn | 2023 | OECD developed-country-attributed series |
| Adaptation finance provided and mobilised | US$34.7bn | 2024 | OECD developed-country-attributed series |
| Public component of OECD adaptation finance | US$31.7bn | 2024 | Public adaptation finance within OECD framework |
| New collective quantified finance goal | At least US$300bn annually | 2035 target | Broad developing-country climate finance |
| Wider finance mobilisation objective | At least US$1.3tn annually | 2035 target | Broader public and private climate-finance mobilisation |
Sources: UNEP Adaptation Gap Report 2025 — October 2025; OECD Climate Finance Provided and Mobilised by Developed Countries in 2013–2024 — May 2026; UNFCCC COP29 Climate-Finance Outcome — November 2024. The categories are not additive and their differing definitions prevent direct use as a single financial series.
Multilateral Development Institutions and the Economics of Project Preparation
Multilateral development institutions occupy a central position in adaptation finance because they can combine long-term lending, concessional resources, guarantees, technical assistance and project-development capabilities. Their role extends beyond the transfer of capital. Infrastructure resilience requires engineering assessments, environmental and social safeguards, procurement systems, institutional coordination and the capacity to maintain assets throughout their operational lives. Countries with limited fiscal and administrative resources may face substantial barriers before a project becomes eligible for financing, particularly where the expected benefits take the form of avoided future damage rather than direct revenue. Development institutions can help overcome these constraints by supporting project preparation, technical standards and investment planning.
The economic value of these functions is evident in the World Bank’s Lifelines assessment. Its estimate of US$4.2 trillion in potential net benefits from resilient infrastructure in developing economies is based on the expectation that improved infrastructure design and management can reduce service interruptions and associated economic damage. However, the study also emphasises that resilience requires coordinated action across infrastructure governance, regulation, data, planning, financing and maintenance. The presence of economically attractive investment opportunities does not guarantee implementation where institutional responsibilities are fragmented or financial incentives do not reward preventive expenditure. Lifelines: The Resilient Infrastructure Opportunity — World Bank — 2019, Overview. World Bank
The design of multilateral support must therefore distinguish projects requiring direct public financing from those capable of attracting commercial investors under appropriate conditions. Some infrastructure projects produce identifiable user charges or operating savings that can contribute to debt repayment. Others provide diffuse public benefits, making them less suitable for financing models dependent on commercial revenue. Guarantees can reduce specific investment risks, but they also create contingent obligations for the public sector. Blended finance may encourage private participation, but the amount of concessional support should be justified by a credible assessment of additionality and the public benefits generated. A programme that attracts substantial private capital without delivering measurable resilience improvements cannot be considered successful simply because it increases reported financial mobilisation.
Public Procurement, Infrastructure Resilience and the Governance of Adaptation Investment
Adaptation procurement differs from conventional infrastructure purchasing because it must account for uncertain future hazards and the long operational lives of public assets. A road, bridge, drainage network or electricity installation may remain in service for several decades, during which the frequency or intensity of relevant hazards can change. Engineering decisions therefore depend on assumptions concerning future exposure, asset use, maintenance, the economic value of uninterrupted service and the acceptable level of residual risk. Procuring the lowest-cost design may reduce immediate expenditure while increasing expected future damage and maintenance requirements. Conversely, excessive protective investment can impose unnecessary fiscal costs where the incremental resilience benefit is small. The appropriate decision requires a risk-informed assessment of lifecycle costs rather than a comparison of initial construction prices alone.
The World Bank’s analysis suggests that additional resilience expenditure can generate substantial economic benefits where projects are properly selected. Its estimated incremental cost of approximately 3% of overall infrastructure investment requirements must, however, be interpreted within the study’s geographical coverage and modelling assumptions. It should not be applied indiscriminately to every project or jurisdiction. The underlying economic argument is that well-designed preventive investment can reduce future disruptions and avoid reconstruction expenditure that would otherwise be required after damage occurs. This places adaptation within the wider discipline of public investment management, where project selection, procurement, maintenance and performance evaluation determine whether financial resources are converted into lasting productive assets. Lifelines: The Resilient Infrastructure Opportunity — World Bank — 2019. World Bank
The governance of adaptation expenditure must also address potential conflicts between emergency needs and long-term infrastructure quality. Post-disaster reconstruction is often undertaken under exceptional conditions, with urgent pressure to restore basic services and economic activity. Preventive adaptation, by contrast, can be integrated into ordinary planning, competitive procurement and long-term budget frameworks. The latter approach may offer stronger opportunities for evaluating alternatives and reducing avoidable expenditure, although the benefits of preventive investment remain uncertain until future hazards occur. This uncertainty can create a political incentive to postpone adaptation where immediate fiscal pressures are visible but avoided future losses are not. Institutional budgeting rules, risk assessments and transparent investment appraisal can help address that imbalance.
The distinction has direct implications for the allocation of international finance. A financing framework that prioritises projects solely according to the amount of private capital mobilised may underfund essential public goods whose benefits cannot be monetised easily. A framework based exclusively on government grants may fail to capture commercially viable investment opportunities that could release scarce public resources for more vulnerable populations. Effective adaptation finance therefore requires differentiation according to the economic characteristics of the project, the fiscal position of the recipient and the form of risk that prevents investment from occurring.
Adaptation, Sovereign Debt and the Strategic Exposure of Vulnerable States
The sovereign dimension of adaptation is especially significant for countries whose economic activity is concentrated in climate-sensitive sectors or geographically exposed infrastructure. A severe disaster can simultaneously reduce tax receipts, interrupt exports, increase import requirements and require emergency government expenditure. Where public debt is already elevated, the shock can affect borrowing costs and fiscal flexibility, limiting the government’s ability to undertake reconstruction or protective investment. These effects can be reinforced when damaged infrastructure disrupts economically important activities such as tourism, agriculture, manufacturing or transportation.
The IMF’s findings concerning small-island developing economies illustrate the importance of these transmission mechanisms. The study identifies declines in net exports as a significant contributor to contemporaneous output losses in small-island economies following natural disasters, while investment declines play a more prominent role in other emerging-market and developing economies. The distinction is material because it indicates that the economic consequences of disasters depend on the productive structure of the affected country. An economy heavily dependent on a limited number of export sectors or transport connections may experience a particularly severe external shock when essential facilities are disrupted, whereas a more diversified economy may possess greater capacity to redirect activity and finance recovery. Understanding the Macroeconomic Effects of Natural Disasters — IMF — February 2025. Fondo Monetario Internazionale
These dynamics create a strong economic rationale for prearranged financing mechanisms and resilience investment. Contingency credit, appropriately designed insurance, emergency reserves and multilateral support can provide resources when ordinary financing conditions deteriorate. However, each instrument possesses limitations. Insurance may provide rapid compensation but can become expensive or unavailable for highly exposed risks. Contingent credit improves liquidity but creates debt obligations when drawn. Public reserves provide flexibility but require governments to retain resources that could otherwise finance current expenditure. Grant-based assistance avoids conventional repayment obligations but depends on the availability and timing of external support. A coherent sovereign-risk strategy must combine instruments according to the structure of exposure and the country’s fiscal capacity rather than relying on a single mechanism.
The Strategic Position of Europe in International Adaptation Finance
The European Union and its major member states possess a dual interest in international adaptation: participation in multilateral climate-finance commitments and exposure to the economic consequences of climate disruption beyond European borders. International supply chains, agricultural imports, transportation corridors, financial investments and geopolitical relationships connect European economic activity with countries facing significant adaptation requirements. Climate-related infrastructure failures in partner economies can therefore affect European firms and institutions even where the corresponding physical damage occurs outside European territory. This creates an economic rationale for international cooperation that extends beyond the distribution of historical responsibility.
Italy’s position is especially relevant to the resilience of Mediterranean economic relationships, transport networks and commercial connections with North Africa. Adaptation investment in regional infrastructure, water management and logistics can influence the reliability of productive and commercial systems linking Mediterranean economies. France possesses comparable interests through its European and international economic relationships, while its overseas territories introduce additional geographical dimensions to climate exposure and public infrastructure policy. Germany’s internationally integrated manufacturing economy creates exposure to supply-chain interruption and changes in production conditions across trading partners. The United Kingdom combines international financial-market exposure with development-finance and insurance-related interests. These differences mean that the four countries should not be treated as identical providers of climate finance or as having equivalent economic exposure to adaptation failures.
The European policy challenge is to integrate international adaptation with development cooperation, infrastructure investment, financial-risk management and external economic relations. Financing mechanisms should be evaluated according to their ability to reduce vulnerability, support productive capacity and strengthen the resilience of international economic relationships. Programmes designed primarily to maximise the nominal value of mobilised capital may not be appropriate for countries or projects where public benefits are high but commercial returns are limited. Conversely, properly structured private participation can expand the resources available for adaptation where projects possess identifiable and sustainable revenue streams.
The distinction between public-interest outcomes and financial mobilisation should remain central. International adaptation finance is successful when it reduces the economic and social consequences of hazardous events and improves the capacity of countries to maintain essential services and productive activity. The amount of financing announced, approved or mobilised is an important administrative indicator, but it is not sufficient evidence that vulnerability has declined. Performance should be evaluated through project completion, infrastructure availability, avoided service interruption, improved preparedness and the economic sustainability of the recipient government’s financing obligations.
Final Strategic Assessment of Pillar II
The combined evidence establishes that climate damage, financial investment and adaptation finance operate through distinct economic mechanisms whose effects cannot be inferred from the profitability of individual businesses. Natural disasters create financial losses through capital destruction, interrupted production, insurance claims and fiscal expenditure. Recovery markets generate necessary commercial activity, but the revenues earned by suppliers and contractors do not measure the net welfare effect of the disasters that create demand for their services. Institutional investors encounter these developments through diversified portfolios, underwriting liabilities, credit exposure, asset valuations and the financial consequences of both physical hazards and the transition toward lower-emission production. Their incentives therefore depend on portfolio composition and governance authority, rather than on the existence of isolated profitable holdings in recovery-oriented sectors.
The international adaptation challenge is structurally different from the commercial reconstruction market. It concerns the mobilisation and effective allocation of capital before damage occurs, particularly in jurisdictions where vulnerability is high and fiscal resources are constrained. The OECD’s latest quantified international climate-finance series demonstrates progress in aggregate financing but also shows that adaptation remains a smaller component of reported flows and continues to rely heavily on public resources. The COP29 financing objectives establish a more ambitious international framework, but their practical significance depends on additional implementation, the composition of financial instruments and the capacity of recipient countries to convert funding into effective protection.
The most consequential economic relationship is therefore between risk prevention, financial resilience and the allocation of public and private capital. Well-designed adaptation can reduce expected future losses, protect productive assets and improve fiscal stability. Insurance can redistribute defined risks and support recovery, but it cannot eliminate physical damage. Financial institutions can mobilise investment and manage exposure, but their incentives must be assessed through actual financial relationships and governance decisions. Public authorities can improve economic resilience through infrastructure, regulation and financial support, but their effectiveness depends on procurement, implementation and accountability.
Key judgments: The evidence does not establish that the expansion of disaster-related commercial activity produces a generalised financial incentive for diversified institutional investors to favour worsening climate conditions. It establishes substantial catastrophe losses, significant financial exposure, uneven insurance protection, material adaptation requirements and an important role for public institutions in overcoming financing constraints. The economic case for adaptation rests primarily on reducing expected damage and maintaining productive capacity, not on the commercial attractiveness of reconstruction expenditure.
What would change the assessment: Reliable evidence of systematic portfolio-wide financial gains from increasing climate-related damage, combined with documented influence over mitigation decisions, would strengthen the case for a generalised conflict-of-interest mechanism. Conversely, improved information demonstrating that adaptation programmes have materially reduced physical losses, fiscal volatility and service interruption across vulnerable economies would strengthen the estimated economic benefits of preventive investment and provide a stronger basis for allocating financial resources.
Open official record: The central requirements are comparable financial accounts for disaster-recovery industries, more granular information on institutional climate exposures, harmonised adaptation-finance statistics, the separation of financing commitments from actual disbursements, transparent procurement records and independent evaluations of resilience outcomes. Particular attention should be directed toward the cost and concessionality of sovereign adaptation finance, the distribution of project benefits and the relationship between international financial commitments and measurable improvements in infrastructure resilience.
PILLAR III — STRATEGIC GOVERNANCE, INDUSTRIAL TRANSFORMATION AND POLICY EFFECTIVENESS
Chapter 7. The Economic Limits of Wealth-Centred Climate Policy
Capital Formation, Fiscal Sovereignty and the Economic Conditions for Effective Decarbonisation
The principal strategic judgment is that fiscal measures directed at concentrated wealth can contribute to distributional equity, public revenue and the accountability of economically powerful actors, but their effectiveness as climate-policy instruments depends on their demonstrable influence over physical emissions, capital allocation and the financing conditions of industrial transformation. The central economic difficulty is that wealth, taxable income, ownership of productive assets and greenhouse-gas emissions are not interchangeable tax bases. A measure imposed on accumulated financial wealth may alter an investor’s disposable resources, asset holdings or portfolio allocation without necessarily changing the energy system, manufacturing technology or consumption activity responsible for greenhouse-gas emissions. Conversely, measures applied directly to carbon-intensive production and consumption can influence emissions even where the affected activities are undertaken by enterprises with dispersed ownership or by households that are not exceptionally wealthy. The appropriate design of climate-related fiscal policy therefore requires a precise connection between the economic behaviour targeted, the instrument’s transmission mechanism, the resulting investment response and the environmental outcome that government intends to achieve.
This distinction has become particularly consequential because the international economic environment in 2026 combines substantial capital requirements for energy-system transformation with competing fiscal, industrial and energy-security priorities. The International Energy Agency’s World Energy Investment 2026 estimates that worldwide energy investment will reach approximately US$3.4 trillion during 2026, representing growth of approximately 5% compared with 2025. Of that total, approximately US$2.2 trillion is expected to be invested in renewable energy, nuclear power, electricity networks, storage, low-emission fuels, energy efficiency and electrification, compared with approximately US$1.2 trillion directed toward oil, natural gas and coal. The IEA also estimates that electricity-related expenditure accounts for nearly 60% of global energy investment, reflecting the growing importance of electricity generation, networks and related infrastructure. These are investment estimates, not completed expenditures audited at the end of 2026, and the categories should not be interpreted as evidence that all capital assigned to lower-emission technologies will necessarily deliver identical emissions reductions. Nevertheless, the amounts establish the magnitude of the financial resources involved and demonstrate that climate governance must address the deployment of productive capital on a scale fundamentally different from that of selective consumption taxes. World Energy Investment 2026 — International Energy Agency — May 2026. Energy Investment: Key Findings — International Energy Agency — 2026. IEA+1
The distribution of this investment also has important consequences for the relationship between wealth concentration and climate policy. Private capital enters energy infrastructure through listed and unlisted equity, project finance, corporate borrowing, institutional investment, infrastructure funds and other financial arrangements. Public finance can support these investments through grants, concessional loans, guarantees, regulated returns and procurement contracts. The resulting financing structures differ according to technological maturity, expected revenues, construction periods, energy-market regulation and the degree of commercial risk. An emissions-reduction programme therefore cannot be evaluated solely according to the amount of wealth held by the investors financing it. The relevant question is whether the financial system supplies capital at terms compatible with the construction and operation of infrastructure capable of reducing emissions, and whether public authorities can influence investment decisions without imposing excessive fiscal costs or weakening the conditions for productive capital formation.
The economic argument against treating wealth taxation as the central climate instrument should not be confused with a general argument against progressive taxation. Governments legitimately use tax systems to finance public services, address inequalities and influence economic behaviour. However, taxation becomes environmentally effective only when it changes the incentives or resources associated with emissions-producing activities, or when the resulting revenue finances measures that achieve identifiable environmental benefits. A wealth tax may possess a substantial redistributive effect while producing only an indirect and uncertain influence on greenhouse-gas emissions. A carbon tax can create a direct price signal for covered emissions but may generate socially difficult distributional outcomes if households and enterprises lack affordable alternatives. A targeted levy on exceptionally carbon-intensive consumption may achieve a more favourable distributional profile but affect a relatively limited share of total emissions. Industrial investment incentives can influence large emissions sources, although their effectiveness depends on project implementation and technological substitution. These instruments should therefore be treated as complements or alternatives according to the underlying policy problem rather than ranked through a general ideological preference.
Wealth Taxation in the 2026 International Fiscal Environment
The OECD’s Tax Policy Reforms 2026, published on 8 September 2026, provides an important contemporary reference for the direction of national tax systems. Covering tax reforms introduced or announced during 2025 across 92 jurisdictions, the assessment finds that governments continued to balance revenue mobilisation with economic growth, investment competitiveness and household affordability. Reforms to personal income taxation frequently sought greater progressivity, while corporate taxation measures continued to emphasise investment and competitiveness. Property-tax adjustments were more frequently associated with revenue mobilisation, but direct changes to recurrent net wealth taxes remained comparatively limited. The report also identifies measures designed to attract or retain highly skilled individuals, wealthy residents and internationally mobile economic activity, demonstrating that international mobility continues to influence national tax-policy decisions. Tax Policy Reforms 2026: OECD and Selected Partner Economies — Organisation for Economic Co-operation and Development — September 2026. OECD
This evidence does not establish that progressive wealth-related taxation is economically impracticable. It establishes that governments face competing objectives and that tax design must account for differences in the mobility, liquidity and valuation of assets. Financial securities, closely held enterprises, immovable property, intellectual property and other assets do not respond identically to taxation. Publicly traded securities can generally be valued using observable market prices, whereas private enterprises may require complex valuations affected by earnings assumptions, asset structures and market conditions. Some taxpayers possess substantial wealth in illiquid businesses but relatively limited available cash, creating potential difficulties where recurrent tax liabilities must be financed through dividends, borrowing or asset sales. Internationally mobile taxpayers may alter residence or the location of certain financial assets, while immovable property cannot be relocated in the same manner. The fiscal effect of a tax consequently depends on the exact legal base, enforcement arrangements, international information exchange, applicable exemptions and the interaction with capital-income and inheritance taxation.
The distinction between taxation of accumulated wealth and taxation of economic rents is especially relevant to industrial transformation. An investment yielding ordinary commercial returns may be sensitive to increases in the effective cost of capital, particularly where the initial expenditure is substantial and the revenue stream extends over decades. By contrast, an enterprise receiving exceptional returns because of scarcity, market power or regulatory privileges may be capable of bearing a differently structured fiscal burden without an equivalent reduction in productive investment. These outcomes cannot be assumed universally; the relevant elasticity of investment and the actual economic incidence must be established for the affected assets. Nevertheless, this distinction provides a more economically precise foundation for fiscal policy than a uniform presumption that the taxation of all high-valued financial assets produces equivalent social or environmental benefits.
The OECD’s 2026 assessment also identifies a divergence in environmentally related tax reforms. Some jurisdictions increased carbon taxes or expanded carbon-pricing measures, whereas others reduced taxes on fuel or electricity to ease affordability pressures. The simultaneous implementation of these opposing measures demonstrates the institutional difficulty of maintaining consistent environmental price signals when governments confront energy-cost shocks and political demands for immediate relief. A fiscal system may therefore contain instruments intended to discourage carbon-intensive activity alongside measures that reduce the cost of energy consumption. The resulting effective incentives must be evaluated collectively, rather than assessing individual taxes in isolation. Tax Policy Reforms 2026, Chapter 3 — OECD — September 2026. OECD
Capital Mobility, Investment Elasticity and the Risk of Misaligned Fiscal Incentives
The effects of capital mobility on climate policy are frequently presented too simplistically. The relocation of financial ownership is not identical to the relocation of an industrial installation, and changes in an investor’s tax residence do not automatically alter the physical emissions of enterprises held in a portfolio. A factory may remain in the same jurisdiction even if its shareholders change, while a new industrial investment can be allocated between several countries when firms compare energy costs, fiscal incentives, infrastructure availability, regulatory stability and access to markets. The relevant distinction is therefore between the mobility of existing financial claims and the mobility of future productive investment. The first may influence tax collection and the distribution of ownership; the second can affect where new capacity is constructed and, under certain conditions, the emissions intensity of future industrial activity.
This distinction complicates the concept of carbon leakage. Relocating production to another jurisdiction can alter territorial emissions without necessarily reducing global emissions, particularly if the receiving location relies on a more carbon-intensive energy system. However, relocation can also change technology, transport requirements, supply-chain organisation and productivity, meaning that its net emissions effect cannot be inferred solely from the geographical movement of activity. The European Union’s carbon-border adjustment architecture is intended to address part of this problem by relating import obligations for selected goods to their embedded emissions and the carbon-price treatment of domestic production. The broader economic objective is to reduce incentives for emissions-intensive production to move outside the regulated market solely to avoid carbon costs, while preserving incentives for cleaner production among domestic and foreign suppliers.
Investment responses also vary by technology and sector. Electricity networks, for example, possess geographical characteristics that make relocation of existing infrastructure impossible, but new investments still depend on revenue regulation, financing conditions and project approval. Energy-intensive manufacturing may face greater international competition, yet relocation decisions can be constrained by access to skilled labour, integrated supply chains, industrial clusters and transport infrastructure. Low-carbon technology development may involve mobile research investment and intellectual property, while deployment of infrastructure depends on local physical conditions and regulatory requirements. Consequently, the impact of wealth taxation or carbon pricing on investment cannot be evaluated through one general mobility assumption. Public authorities require sector-specific assessments identifying which assets or activities can move, under what conditions, and with what environmental consequences.
The Distinction Between Carbon Pricing, Wealth Taxation and Luxury-Emissions Regulation
Carbon pricing, wealth taxation and restrictions on carbon-intensive luxury consumption address different economic margins. Carbon pricing alters the cost of releasing greenhouse gases within a defined regulatory perimeter. Its immediate incentive operates through the emissions associated with production or consumption, subject to the design of the tax or trading system. Wealth taxation alters the after-tax return or accumulation of assets, while its environmental consequences depend on any resulting change in consumption, financing or the allocation of tax revenue. Luxury-emissions regulation targets specific activities such as high-emission discretionary transport or energy-intensive consumption and may combine environmental objectives with distributional considerations. The choice among these instruments must therefore follow the specific source of emissions, the availability of alternatives and the social consequences of the intervention.
The economic appeal of targeted high-emissions consumption measures lies partly in their relatively narrow distributional incidence. Activities concentrated among high-income households may be more amenable to selective taxation without directly raising the cost of essential consumption for lower-income populations. Nevertheless, the environmental effect depends on the scale of emissions covered and the responsiveness of users. If demand is highly insensitive to price, taxation may primarily raise revenue rather than substantially reduce activity. If consumers substitute toward lower-emission alternatives, the instrument can affect physical emissions more directly. Regulatory restrictions may produce different outcomes because they can set technological or operational requirements independently of willingness to pay. A complete appraisal must consider administrative costs, cross-border substitution, enforcement and the possibility that activity moves into less transparent markets.
For industrial emissions, the relevant instruments often operate on a significantly larger physical scale. Carbon markets, performance standards, electricity-system investment, industrial technology support and infrastructure regulation affect productive processes whose emissions arise continuously and whose capital stock may remain operational for decades. Such interventions can have extensive implications for competitiveness, employment and public finance, but they also possess the capacity to influence the underlying energy and production systems. The strategic error would be to equate political visibility with environmental effectiveness, whether by assuming that a highly progressive consumption tax is sufficient for mitigation or that a large industrial subsidy must necessarily deliver significant emissions reductions.
Table 16 — Economic-policy instruments and their operational consequences
| Instrument | Legal or fiscal mechanism | Primary affected decision | Time-to-effect | Reversibility | Principal economic risk | Performance measure |
|---|---|---|---|---|---|---|
| Recurrent net wealth taxation | Tax on defined net asset values | Asset ownership, saving and portfolio decisions | Depends on tax cycle and investor response | Legally reversible; investment effects may persist | Valuation disputes, mobility and liquidity pressure | Net revenue, economic incidence, investment response |
| Capital-income taxation | Taxation of dividends, gains or other returns | After-tax return on investment | Near term for realised income; longer for investment | Generally reversible in law | Investment distortion and avoidance | Effective yield, investment and revenue |
| Luxury-emissions excise | Activity-specific tax | Discretionary high-emission consumption | Near term where demand responds | Relatively high | Substitution, avoidance and limited emissions base | Emissions and activity changes within the taxed category |
| Economy-wide carbon tax | Price on defined GHG emissions | Fuel, process and investment choices | Immediate price effect; slower capital replacement | Adjustable | Household affordability and industrial cost | Verified emissions response, effective carbon price |
| Cap-and-trade | Declining allowance supply and compliance obligations | Covered emissions and technology investment | According to annual compliance and investment cycles | Cap amendments possible, but expectations matter | Volatility, leakage and allocation effects | Verified emissions under the cap |
| Technology-neutral investment support | Tax credit, grant or financing support | Productive capital deployment | Medium to long term | Difficult after contractual commitments | Windfall subsidies and weak additionality | Commissioned capacity and verified emissions avoided |
| Industrial performance standards | Regulatory obligation | Production technology and operating practice | Depends on compliance deadlines | Limited once investments are committed | Compliance costs and technology constraints | Measured facility-level performance |
| Border carbon adjustment | Import compliance linked to embedded emissions | Supplier sourcing and emissions intensity | Gradual through compliance and investment | Subject to legislative revision | Administrative burden and trade friction | Embedded emissions and import compliance |
| Targeted household compensation | Transfer or subsidised access to alternatives | Household affordability and technology adoption | Near term for transfers; longer for capital support | Adjustable | Poor targeting and fiscal leakage | Distributional burden and access to alternatives |
The table provides a policy-design comparison, not numerical effectiveness rankings. Its analytical distinctions are informed by the OECD Tax Policy Reforms 2026 — September 2026, the European Climate Law — European Commission — 2026 and the IEA World Energy Investment 2026 — May 2026.
The Investment-Financing Constraint: Why Capital Availability Is Not Sufficient
The financing of industrial decarbonisation depends on more than the aggregate quantity of capital available. Investment may be delayed despite the existence of potential investors where projects face uncertain demand, inadequate electricity-network capacity, unavailable industrial sites, permitting delays or unpredictable regulation. Similarly, technology costs may be commercially acceptable in principle while the associated infrastructure remains incomplete. An industrial facility considering electrification must assess not only the price of electrical equipment but also grid connection, electricity reliability, operating costs and the commercial value of the output. A manufacturer considering lower-emission production must evaluate the willingness of customers to pay for the resulting product, the availability of suitable inputs and the competitive position of alternative suppliers. Fiscal incentives can help address individual barriers, but their effectiveness depends on whether they influence the binding constraint on the investment decision.
The IEA’s 2026 investment assessment underscores this problem by identifying substantial differences in investment growth between advanced economies and emerging markets. Clean-energy investment is projected to increase by approximately 7% in advanced economies and China and 4% in other emerging markets during 2026. These differences indicate that the expansion of capital deployment is geographically uneven, despite the global availability of low-emission technologies. Financing conditions, institutional capabilities, energy demand, infrastructure and energy-security priorities influence the distribution of investment. The numbers describe expected investment flows, not environmental outcomes per dollar invested, and should not be converted into claims concerning national policy superiority without examining technology mixes and the corresponding changes in physical emissions. World Energy Investment 2026: Regional Dashboards — International Energy Agency — May 2026. IEA
A further constraint concerns public-finance capacity. Governments can support industrial transformation through subsidies, guarantees, regulated procurement and infrastructure investment, but these commitments compete with other public expenditure and debt-service requirements. The OECD’s September 2026 tax-policy assessment explicitly identifies elevated debt and fiscal pressures as important considerations shaping national choices. This increases the need to evaluate the economic additionality of public support: a subsidy should not be judged solely by the amount allocated or the financial value of the private investment it accompanies, but by whether the investment would otherwise have been delayed, reduced or abandoned and whether the resulting public benefit justifies the fiscal cost. Governments Reforming Tax Systems to Boost Growth but Revenue Pressures Continue to Mount — OECD — September 2026. OECD
Distributional Legitimacy and the Political Durability of Climate Policy
The economic effectiveness of climate policy depends partly on whether its distributional consequences are politically and socially sustainable. Policies that increase energy or transportation costs without corresponding access to alternatives can generate resistance even when their environmental rationale is substantial. The underlying problem is not simply that households oppose higher prices; it is that adjustment capacity is uneven. An owner-occupier may have different opportunities to improve building efficiency from a tenant, while a rural household dependent on private transport may have fewer short-term substitutes than a household with reliable public transportation. An industrial enterprise may possess the financing and technical capability to adopt lower-emission production, while a smaller supplier may face difficulties accessing capital or understanding complex regulatory requirements.
Compensation and infrastructure policies must therefore be integrated into the original design of environmental interventions rather than treated as emergency measures after distributional problems emerge. Transfers can address immediate affordability, but their value is limited if households remain structurally dependent on carbon-intensive technology. Investment in efficiency, electricity networks, public transportation and building improvements can reduce long-term exposure, but these measures require planning and capital. A coherent framework combines an effective emissions incentive with measures that reduce the cost of adjustment and preserve access to essential services. The appropriate allocation differs by country and sector, and unsupported universal compensation percentages should be avoided.
The resulting governance question is whether a fiscal instrument can achieve its stated objective without undermining the productive investment or household adaptation that the wider transition requires. In some circumstances, a targeted tax on exceptionally carbon-intensive activity may perform well on both environmental and distributional grounds. In others, direct regulation or public investment may offer a more predictable route to reducing emissions. Wealth-related taxation can contribute to the financing of these programmes, but it should be evaluated through its fiscal and economic effects rather than assumed to deliver emissions reductions directly.
Key Judgments — Chapter 7
Wealth-centred climate policy confronts a fundamental mismatch between the taxation of accumulated financial assets and the physical mechanisms responsible for greenhouse-gas emissions. Progressive taxation can serve legitimate fiscal and distributional purposes, while selective regulation of high-emissions consumption can contribute to mitigation where the affected activities are substantial and responsive. However, large-scale decarbonisation requires investment decisions across energy generation, industrial production, buildings, transportation and electricity infrastructure. The projected US$3.4 trillion in global energy investment during 2026 illustrates the scale of capital formation involved and reinforces the need to evaluate taxation, regulation and public financial support according to their combined effects on physical emissions and productive investment.
What would change the assessment: Reproducible evidence demonstrating that a particular wealth-related instrument produces substantial, additional emissions reductions while preserving the financing of low-emission technologies would strengthen its position as a climate-policy mechanism. Evidence of persistent adverse investment responses, significant fiscal leakage or negligible emissions effects would favour a narrower environmental role for that instrument.
Open official record: The decisive evidence concerns realised tax revenues, effective economic incidence, behavioural responses, investment changes, emissions outcomes and the relationship between fiscal measures and the financing of low-emission productive assets. National tax-policy reviews should distinguish environmental effects from distributional and revenue objectives rather than treating them as automatically equivalent.
Chapter 8. European and National Policy Architecture
The European Union’s Regulatory Framework: From Emissions Reduction to Industrial and Fiscal Transformation
The European Union’s climate-policy architecture now operates through an increasingly complex combination of legally binding emissions objectives, carbon-market regulation, industrial investment mechanisms, energy infrastructure policy, border adjustments and social compensation. Its principal implementation challenge is no longer simply the formal adoption of emissions targets, but the translation of those targets into financially viable industrial investments, measurable reductions in physical emissions and distributionally sustainable changes in household and business behaviour. This challenge is especially significant because the Union contains economies with different electricity-generation systems, industrial structures, income distributions, fiscal capacities and exposure to international competition. A common regulatory framework can coordinate long-term expectations, but the real economic consequences of compliance depend on national conditions and on the availability of infrastructure and technology.
The European Climate Law establishes legally binding objectives of at least a 55% reduction in net greenhouse-gas emissions by 2030 relative to 1990, a 90% reduction by 2040, and climate neutrality by 2050. The 2040 target was incorporated through the amendment formally adopted by the Council on 5 March 2026 and entered into force in April 2026. The 2040 architecture includes a domestic reduction contribution of at least 85% relative to 1990 and permits a contribution from qualifying international carbon credits of up to 5 percentage points from 2036, under the specified conditions. This distinction is essential because a headline target allowing a limited international-credit contribution cannot be interpreted as requiring the entire reduction to occur domestically, nor does the existence of a permitted flexibility imply that the corresponding international credits have already been acquired or used. 2040 Climate Target: Council Gives Final Green Light — Council of the European Union — March 2026. European Climate Law — European Commission — April 2026. Consilium+1
The practical significance of this legislative framework lies in the long investment horizons it creates. Electricity networks, industrial facilities, buildings and transportation infrastructure are capital-intensive assets whose economic lives often extend well beyond a single government mandate. Legally defined emissions objectives can reduce uncertainty about the broad direction of environmental regulation, but they do not eliminate uncertainty concerning carbon prices, technological requirements, public support or compliance costs. Investors therefore require credible implementation arrangements that connect long-term targets with nearer-term investment decisions. A target lacking corresponding network capacity, permitting procedures or financing instruments may influence expectations without enabling the productive transformation necessary to meet it. Conversely, projects undertaken without a coherent regulatory framework may face greater uncertainty regarding future demand and the economic value of lower-emission output.
EU ETS: Carbon-Market Performance, Fiscal Revenues and the Industrial Transition
The EU Emissions Trading System remains a central instrument of European emissions governance. Its cap-and-trade architecture establishes a declining quantity of allowances for covered activities, with compliance obligations requiring regulated entities to surrender allowances corresponding to their verified emissions. The system creates a financial incentive to reduce emissions where doing so costs less than the relevant allowance price, subject to market conditions, allowance allocation rules and the availability of technical alternatives. The relationship between the cap, actual emissions and allowance prices is influenced by changes in electricity demand, industrial output, fuel prices, renewable generation and the market’s stability mechanisms. Consequently, observed emissions reductions should not automatically be attributed in full to carbon pricing without assessing those other factors.
The European Commission’s verified emissions release of 10 April 2026 recorded a 1.3% reduction in EU ETS emissions during 2025 compared with 2024. The Commission reported that emissions in covered sectors had approximately halved since the system’s launch in 2005 and that the system remained on track toward the objective of a 62% reduction by 2030 relative to the 2005 baseline. Within electricity generation, fossil-fuel combustion emissions declined by approximately 0.4% during 2025, while EU net electricity generation increased by approximately 1.7%. These figures indicate that the performance of the regulated system cannot be evaluated through electricity production volumes alone: the changing composition of generation and the emissions intensity of production are relevant to the final outcome. EU Emissions Trading System Sustains Downward Trend in Covered Emissions — European Commission — April 2026. Climate Action
The fiscal dimension of the EU ETS is equally important. According to the European Commission, allowance auctions generated more than €43 billion in revenue during 2025, of which approximately €24 billion directly benefited member states. The remainder supported relevant EU-level funding arrangements, including the Innovation Fund, Modernisation Fund, recovery-related mechanisms and the Social Climate Fund’s financing architecture. From 2013 through the end of 2025, cumulative EU ETS auction revenues exceeded €258 billion. These figures are revenues from allowance auctions, not a measure of private investment mobilised or public expenditure already completed. The distinction matters because auction receipts enter different financing channels, and their eventual economic effects depend on programme design, project selection, disbursement and implementation. What Are ETS Revenues Used For? — European Commission — 2026. European Commission
The European Commission’s account of the 2024 auction results provides an additional fiscal reference. Total auction revenues amounted to approximately €38.8 billion, with €24.4 billion allocated directly to member states. Of the latter amount, approximately €21.2 billion fell under the relevant obligation to support climate and energy-transition activities under Article 10(3) of Directive 2003/87/EC. This distinction illustrates why total auction revenue, member-state receipts and expenditure subject to a particular legal obligation cannot be treated as interchangeable figures. The Commission also reports that member states are required to use collected ETS revenues, or an equivalent financial value, for qualifying climate and energy purposes, with reporting arrangements intended to support oversight. What Are ETS Revenues Used For? — European Commission — 2026. European Commission
Table 17 — EU climate-law and carbon-market indicators
| Instrument or indicator | Verified value | Reference date | Legal or economic significance |
|---|---|---|---|
| EU net GHG target | At least −55% | 2030 versus 1990 | Legally binding intermediate EU objective |
| EU net GHG target | −90% | 2040 versus 1990 | Binding target incorporated in 2026 |
| Domestic component of 2040 target | At least −85% | 2040 versus 1990 | Minimum domestic contribution |
| Permitted international-credit contribution | Up to 5 percentage points | From 2036 toward 2040 | Conditional flexibility within the legal framework |
| EU climate neutrality | Net zero | 2050 | Long-term legal objective |
| EU ETS emissions change | −1.3% | 2025 versus 2024 | Verified emissions in the regulated system |
| EU ETS 2030 reduction objective | −62% | 2030 versus 2005 | Target for covered emissions |
| EU ETS auction revenue | More than €43bn | 2025 | Auction receipts |
| Member-state portion of auction revenue | Approximately €24bn | 2025 | Receipts directly benefiting member states |
| Cumulative EU ETS auction revenue | More than €258bn | 2013–2025 | Historical cumulative auction receipts |
Sources: European Climate Law — European Commission — April 2026; EU ETS Verified Emissions — European Commission — April 2026; EU ETS Revenue Allocation — European Commission — 2026. The targets have different reference years and coverage and must not be plotted as a directly comparable time series.
ETS2, Household Exposure and the Political Economy of Carbon Prices
The second European emissions trading system introduces a distinct distributional and regulatory challenge because it extends carbon-market obligations to fuels supplied to buildings, road transport and additional covered sectors. Unlike the original system’s direct relationship with many large industrial installations, ETS2 operates upstream through regulated fuel suppliers. Those suppliers are required to account for the emissions associated with fuels placed on the relevant market and surrender allowances accordingly. The economic burden can then be transmitted through fuel prices to households, transport users and businesses, although the extent of pass-through depends on market conditions, taxation, commercial arrangements and competition.
The timing of implementation is significant. On 9 October 2026, the Council formally adopted an amendment strengthening the ETS2 Market Stability Reserve ahead of the planned 2028 launch. The measure extends the reserve beyond 2030 and doubles the quantity of allowances released when the specified price condition is met, from 20 million to 40 million allowances when the carbon price exceeds €45 per tonne of CO₂ equivalent in 2020 prices. It also provides more gradual adjustments to allowance releases when the number in circulation declines below 260 million. The objective is to limit excessive volatility and improve the predictability of the system. The €45 condition is a market-stability trigger expressed on a specified price basis, not a universal permanent carbon-price ceiling. ETS2: Council Signs Off on Rules Strengthening the Market Stability Reserve — Council of the European Union — October 2026. Consilium
The decision to strengthen the stability mechanism reflects a broader problem of political economy. Carbon pricing can encourage emissions reductions, but households differ in their ability to respond to price incentives. An owner of a highly efficient residence or an electric vehicle may face a different adjustment problem from a household occupying an inefficient rented building or relying on a conventional vehicle because public transportation is unavailable. The distributional burden is therefore determined not only by income but also by infrastructure, housing tenure, geography and the availability of alternatives. A higher carbon price can create an economic incentive for substitution without making substitution immediately feasible.
The Social Climate Fund is intended to address these concerns through support for vulnerable households, transport users and micro-enterprises affected by the transition. However, its financial architecture requires careful treatment because the timing of ETS2 influences the financing framework. Commission guidance published before the deferral described a maximum fund amount of €65 billion for 2026–2032, accompanied by member-state co-financing requirements, and specified an alternative maximum of €54.6 billion if ETS2 were postponed to 2028 under the relevant legal provisions. Those figures should not be presented without distinguishing the applicable legislative timing and subsequent financial arrangements. They are programme ceilings or financing structures, not amounts already disbursed to households. Guidance on Social Climate Plans — European Commission — 2025. European Commission
The policy objective should therefore extend beyond compensating households for carbon costs. Temporary income support can reduce immediate financial pressure, but structural reductions in exposure require improved building efficiency, alternative transportation, access to reliable electricity and investment in infrastructure. The interaction between social assistance and capital investment is crucial because it determines whether a household remains dependent on compensation or acquires the practical ability to reduce carbon-intensive consumption. ETS2 should consequently be evaluated through both emissions performance and the distribution of adjustment capacity, rather than solely through allowance prices or nominal revenue.
Carbon Border Adjustment and European Industrial Competitiveness
The Carbon Border Adjustment Mechanism introduces a further dimension by connecting climate policy with international trade and industrial competition. European manufacturers operating under carbon-pricing obligations may face competition from imports produced in jurisdictions with different emissions costs. Without an adjustment mechanism, some industrial activity could move or new investment could be directed toward lower-carbon-cost jurisdictions, potentially reducing territorial emissions without generating proportionate reductions in global emissions. The EU’s border adjustment aims to address this risk in specified emissions-intensive product categories by introducing obligations related to the embedded emissions of imports and the relevant carbon-pricing treatment.
The economic effectiveness of the mechanism depends on the accuracy of embedded-emissions data, the treatment of actual foreign carbon costs, administrative compliance and the interaction with the gradual reduction of free allowance allocation. A border adjustment cannot guarantee equal production costs between European and non-European manufacturers because competitiveness also depends on energy prices, productivity, labour costs, transportation, financing and exchange rates. Nor does the mechanism automatically solve the competitive problems of European exporters operating in third-country markets. Its contribution is more specific: reducing one source of disparity in the carbon-cost treatment of domestic and imported products within the regulated perimeter.
For national industrial policy, the border mechanism also creates investment incentives along international supply chains. Suppliers seeking access to the European market may face greater demand for verifiable emissions information and may have an incentive to reduce the emissions intensity of covered products. However, the resulting impact depends on the proportion of production exported to the Union, the cost of cleaner technology and the availability of reliable emissions measurement. Administrative complexity can also impose disproportionate burdens on smaller suppliers or businesses with limited reporting capacity. Effective implementation therefore requires reliable monitoring, proportionate compliance procedures and coordination with the industrial policies intended to support European decarbonisation.
Italy: Industrial Conversion, Electricity Networks and the Economics of Implementation
Italy’s climate-policy challenge must be examined through the combination of its manufacturing structure, energy-system transformation, investment requirements and the distribution of transition costs among enterprises and households. The country’s updated Piano Nazionale Integrato per l’Energia e il Clima, submitted in 2024, establishes an extensive programme of energy-system change through 2030. It envisages renewable electricity generation of approximately 237 terawatt-hours by 2030, including approximately 10 terawatt-hours associated with green-hydrogen production, and a renewable share of approximately 63.4% of gross final electricity consumption, compared with the 37.1% recorded for 2022 in the plan’s reference framework. These are policy-plan projections and objectives, not observed 2030 outcomes. They demonstrate the envisaged magnitude of electricity-system change, particularly through photovoltaic and onshore wind generation, alongside the preservation and improvement of existing renewable installations through repowering and refurbishment. Piano Nazionale Integrato per l’Energia e il Clima — Ministero dell’Ambiente e della Sicurezza Energetica — June 2024. National Energy and Climate Plans — European Commission, Italy Assessment — 2025. Ministero Trasporti+1
The economic feasibility of this transformation depends on more than installed generation capacity. Solar and wind installations require network connections, permitting, transmission and distribution reinforcement, system flexibility and arrangements capable of balancing supply and demand. Their integration affects the conditions faced by manufacturing enterprises that require reliable and competitively priced electricity. The relationship is especially important for industrial activities in which electricity costs influence production margins and the feasibility of electrifying processes previously supplied by fossil fuels. A policy that stimulates new renewable generation without corresponding network development may create investment bottlenecks, delays or local constraints. Conversely, well-coordinated generation and network investment can improve energy availability and strengthen the commercial rationale for industrial electrification.
Italy’s public-finance implications are also significant. Industrial transformation requires investment by private enterprises, regulated energy-system operators and public institutions, while households may require support for building improvements, transportation changes and the adoption of more efficient technologies. The fiscal challenge is to distinguish support that addresses a genuine financing or coordination barrier from expenditure that would subsidise investment already commercially viable under prevailing conditions. Competitive allocation, transparent eligibility and measurable project outcomes are therefore central to fiscal effectiveness. This is particularly important where public resources are allocated to technologically mature projects, because poorly designed subsidies can transfer substantial economic value without generating proportional additional investment.
A further strategic issue concerns Italy’s position within international supply chains. Manufacturers supplying European and global markets are exposed not only to domestic energy prices but also to the requirements imposed by customers, financial institutions and regulatory systems concerning product emissions and traceability. Decarbonisation can become a condition of market access or contractual competitiveness, particularly where customers seek lower-emission intermediate goods. The economic case for industrial investment is therefore partly defensive and partly strategic: enterprises may need to reduce emissions to comply with regulation, but they may also seek to preserve or expand their market positions as demand shifts. This makes the timing of infrastructure and industrial investment consequential for long-term competitiveness, rather than merely for near-term compliance.
France: Carbon Budgets, Electricity-System Advantages and the Consumption Footprint
France’s climate-governance framework differs materially from Italy’s because its national strategy combines long-term carbon budgets with a distinct electricity-generation structure and a policy architecture that explicitly addresses both territorial emissions and the carbon footprint associated with national consumption. On 15 July 2026, the French government announced the adoption of the third Stratégie nationale bas-carbone, or SNBC-3, establishing the principal national framework for reaching climate neutrality by 2050. The strategy sets a 50% reduction objective for greenhouse-gas emissions by 2030 compared with 1990, alongside longer-term sectoral trajectories. The French government also identified the consumption-related carbon footprint as an explicit policy concern, recognising that a substantial portion of the emissions associated with French consumption occurs outside national territory. La France adopte sa troisième Stratégie nationale bas-carbone — Ministères de la Transition écologique — July 2026. La Stratégie nationale bas-carbone — Ministères de la Transition écologique — Updated September 2026. ecologie.gouv.fr+1
The significance of this approach is that domestic electricity decarbonisation and the broader environmental effects of consumption must be evaluated separately. A relatively low-carbon electricity supply can improve the emissions performance of electricity-intensive activities, but it does not eliminate fossil-fuel dependence in transport, heating, industrial processes or imported products. Electrification can therefore offer substantial opportunities where suitable technologies exist, although the investment requirements, customer costs and infrastructure constraints differ across sectors. The economic feasibility of replacing conventional heating systems, transport equipment or industrial processes depends on the cost and reliability of electricity, equipment prices, access to financing and the timing of capital replacement.
The explicit treatment of the consumption footprint also strengthens the connection between French climate policy and trade. A reduction in domestic industrial emissions does not necessarily represent an equivalent decline in emissions embodied in final consumption if imports remain emissions-intensive. The relevant policy response cannot consist solely of restricting imports or assigning responsibility to foreign producers; it requires a combination of product standards, supply-chain transparency, changes in domestic demand and international technological cooperation. The institutional difficulty is that France can regulate domestic activities more directly than the production conditions of every imported product, making European market rules and international trade arrangements particularly relevant.
France’s fiscal challenge also involves reconciling substantial public investment requirements with the distributional consequences of building, heating and transportation policies. The state’s role in energy planning, infrastructure and social policy can support coordination, but public intervention must still establish that spending produces additional investment and measurable reductions in emissions or vulnerability. A coherent French framework therefore requires consistency between national carbon budgets, the energy programme, adaptation planning and household support, with sufficient transparency to distinguish announced trajectories from delivered infrastructure and actual emissions outcomes.
Germany: Industrial Competitiveness, Energy-System Transformation and the 2026 Climate Programme
Germany’s national architecture establishes more demanding long-term objectives than the EU’s collective 2040 headline target in certain respects. Under the federal climate-protection framework, Germany targets at least a 65% reduction in greenhouse-gas emissions by 2030 and at least an 88% reduction by 2040, both relative to 1990, with net greenhouse-gas neutrality by 2045. These objectives are embedded in the German legal and administrative framework and must be distinguished from the European Union’s collective targets, which apply to the Union as a whole rather than imposing an identical national percentage on every member state. Treibhausgasminderungsziele Deutschlands — Umweltbundesamt — Updated June 2026. Umweltbundesamt
Germany adopted its Klimaschutzprogramm 2026 on 25 March 2026, establishing a programme containing 90 measures, of which 67 concern the energy industry, manufacturing, buildings, transport and agriculture. The German environment ministry estimates that the programme can deliver approximately 27 million additional tonnes of CO₂ emissions avoidance in 2030, with €8 billion in additional implementation funding for 2027–2030. These values represent governmental programme estimates and budgetary provisions rather than verified future emissions reductions or completed expenditure. Their significance lies in the attempt to connect a legally defined national emissions trajectory with specific measures and fiscal resources, providing an institutional basis for subsequent evaluation of implementation. Klimaschutzprogramm 2026 — Bundesministerium für Umwelt, Klimaschutz, Naturschutz und nukleare Sicherheit — March 2026. Download
The German programme addresses the technical and industrial character of the transition by including electricity-system flexibility, the electrification of transport and heat, circular-economy measures and carbon capture and storage in industrial processes. The choice of these instruments reflects the different technological constraints facing large manufacturing activities. Some emissions can be reduced through changes in electricity generation or efficiency, while others require modifications to industrial processes, new infrastructure or alternative fuels. The cost, maturity and commercial viability of these technologies differ, making the sequencing of investment essential. Industrial transformation cannot be adequately governed through a uniform tax on ownership or capital because the physical mitigation options vary substantially among sectors.
Germany’s competitiveness challenge is particularly connected to the relationship between energy reliability, the cost of industrial transformation and access to export markets. Manufacturers investing in low-emission production must assess whether new technologies can operate competitively at expected energy and input prices. Public financial support may be justified where infrastructure gaps or technology risks prevent otherwise socially beneficial investment, but subsidies must be evaluated against their fiscal costs and the potential displacement of private expenditure. Industrial policy also creates a coordination problem: suppliers and customers may be unwilling to invest unless they expect corresponding changes elsewhere in the supply chain. Government can influence this coordination through infrastructure planning, procurement and regulatory certainty, but the ultimate outcome depends on implementation rather than the nominal value of announced programmes.
A defensible assessment of Germany’s 2026 programme must therefore distinguish forecast reductions from verified results. The estimate of 27 million tonnes of additional CO₂ avoidance in 2030 is an ex ante programme assessment. It cannot be treated as an observed reduction in 2026, nor should the €8 billion funding allocation be interpreted as a realised investment multiplier without evidence of disbursement and private-investment mobilisation. The most relevant performance indicators are operational infrastructure, measured emissions, industrial capital expenditure, energy costs and the extent to which programme interventions resolve identifiable investment barriers.
United Kingdom: Independent Carbon Budgets, Territorial Accounting and Financial-Market Exposure
The United Kingdom operates under a separate legal architecture established by the Climate Change Act 2008 and subsequent statutory instruments. Its carbon budgets impose legally binding limits on the net UK carbon account over successive five-year periods, providing a framework distinct from the European Union’s collective emissions targets. The Sixth Carbon Budget establishes a limit of 965 million tonnes of CO₂ equivalent for 2033–2037, while the Seventh Carbon Budget was formally set at 535 million tonnes for 2038–2042 under the Carbon Budget Order 2026, dated 25 June 2026. The latter corresponds to a trajectory described by the government as an approximately 87% reduction relative to 1990. These figures are five-year cumulative carbon-budget limits, not annual emissions allowances, and should not be compared directly with individual-year national inventory totals without appropriate treatment of their different units and coverage. The Carbon Budget Order 2026 — United Kingdom Legislation — June 2026. Carbon Budgets — Department for Energy Security and Net Zero — 2026. legislation.gov.uk+1
The latest provisional territorial emissions statistics available at the October 2026 cut-off provide an important benchmark for evaluating the UK’s trajectory. The Department for Energy Security and Net Zero estimated 367 million tonnes of net territorial greenhouse-gas emissions in 2025, a reduction of approximately 2% compared with 2024 and 54% relative to 1990. These figures were published on 2 April 2026 and are explicitly provisional; the final 2025 estimates are scheduled for February 2027. The government also reported that the available statistics provide an early indication of emissions performance but are not used as final evidence of compliance with legally binding carbon budgets. 2025 UK Greenhouse Gas Emissions: Provisional Figures — Department for Energy Security and Net Zero — April 2026. GOV.UK
The Office for National Statistics published a separate residence-based emissions assessment on 28 October 2026, estimating 473 million tonnes of CO₂ equivalent in 2025, a decline of approximately 1% from 2024 and 42.4% from 1990. This figure differs substantially from the DESNZ territorial estimate because it is produced under the environmental-economic accounts framework, which allocates emissions according to UK-resident economic activities rather than the identical territorial inventory boundary. The ONS also reported that manufacturing emissions declined from approximately 64 million tonnes in 2024 to 58 million tonnes in 2025, while consumer expenditure accounted for 26.5% of the residence-based total. The difference between the ONS and DESNZ totals is therefore a difference in accounting conventions and coverage, not evidence that one institution’s figure should replace the other’s. Greenhouse Gas Emissions, UK: Provisional Estimates, 2025 — Office for National Statistics — October 2026. Office for National Statistics
The UK’s implementation challenge consequently involves both the physical transformation of emissions-producing sectors and the governance of financial exposure within an internationally connected economy. The electricity system, building stock, industrial processes and transport infrastructure require investment, while the financial sector is exposed to domestic and international climate risks through lending, insurance, investment management and other activities. The national carbon-budget framework provides a legal mechanism for maintaining long-term accountability, but delivery must still be evaluated through verified emissions, infrastructure development and sector-specific policy implementation. The existence of legally binding budgets does not guarantee their achievement, and the distinction between forecast compliance and observed results remains essential for public assessment.
Comparative National Policy Assessment
The European Union, Italy, France, Germany and the United Kingdom share broad decarbonisation objectives but operate under different legal mandates, energy-system conditions and institutional capacities. A comparative assessment must preserve those differences rather than treating national targets as identical or assuming that policy ambition can be determined from a single headline percentage. Legal targets use different years, territorial definitions and levels of government responsibility. Some apply to net emissions, others to specified sectors or accounting perimeters, while national programmes may include modelled contributions that have not yet been realised.
Table 18 — European and national climate-policy architecture as of October 2026
| Jurisdiction | Principal instrument | Verified target or programme figure | Reference horizon | Main implementation constraint |
|---|---|---|---|---|
| European Union | European Climate Law | At least −55% net GHG | 2030 vs 1990 | Coordinated implementation across member states |
| European Union | Amended European Climate Law | −90% net GHG, including at least −85% domestically | 2040 vs 1990 | Investment, flexibility rules and sectoral implementation |
| European Union | EU ETS | −62% in covered emissions | 2030 vs 2005 | Industrial compliance, cap trajectory and competitiveness |
| European Union | ETS2 | Planned full launch in 2028 | 2028 onward | Fuel-price transmission and social compensation |
| Italy | Updated PNIEC | 63.4% renewable share of gross final electricity consumption | 2030 | Grid capacity, permitting and investment execution |
| France | SNBC-3 | −50% GHG | 2030 vs 1990 | End-use fossil dependence, consumption footprint and investment |
| Germany | Federal climate framework | −65% GHG | 2030 vs 1990 | Industrial technology and energy-system integration |
| Germany | Federal climate framework | −88% GHG | 2040 vs 1990 | Long-term investment and infrastructure |
| Germany | Klimaschutzprogramm 2026 | Estimated 27 Mt additional CO₂ avoidance | 2030 | Programme delivery and financing |
| United Kingdom | National climate framework | Net zero | 2050 | Delivery across sectors and infrastructure |
| United Kingdom | Sixth Carbon Budget | 965 MtCO₂eq cumulative | 2033–2037 | Legally binding five-year compliance |
| United Kingdom | Seventh Carbon Budget | 535 MtCO₂eq cumulative | 2038–2042 | Long-term emissions and investment trajectory |
Official sources: European Climate Law — European Commission — 2026; Italy’s Updated PNIEC — MASE — 2024; France’s SNBC-3 — French Government — 2026; German Climate Targets — Umweltbundesamt — 2026; UK Carbon Budget Order — June 2026. The targets differ in coverage, baselines and legal form and are not directly comparable percentages of a common emissions inventory.
European Competitiveness and the Conditions for Policy Convergence
The central question for European industrial competitiveness is whether climate policy can induce the replacement of carbon-intensive capital while preserving or strengthening the conditions for productive investment. A carbon price can create an economic incentive for lower-emission production, but the feasibility of investment depends on energy costs, technology availability, industrial infrastructure, access to finance and market demand. National governments possess different fiscal capacities to support adjustment, while enterprises operating within the single market may compete under a shared regulatory framework but face different local costs. This creates a tension between harmonised environmental ambition and unequal national implementation capabilities.
The European Union’s ability to manage this tension depends on the interaction between carbon-market regulation, EU-level financing instruments, national investment programmes and competition policy. A regulatory system that imposes comparable emissions requirements but leaves major infrastructure gaps unresolved can generate uneven adjustment costs. Conversely, public support distributed without adequate attention to economic additionality can distort competition and transfer excessive resources to firms whose investments would have proceeded without assistance. The relevant governance objective is therefore to establish credible and transparent conditions under which public intervention addresses genuine barriers to decarbonisation while limiting unnecessary fiscal exposure.
The four national cases demonstrate different priorities within this common framework. Italy requires effective coordination between renewable generation, grid investment and manufacturing needs. France must connect its low-carbon electricity opportunities with end-use electrification and the emissions implications of consumption. Germany faces a particularly demanding relationship between industrial transformation, energy infrastructure and export competitiveness. The United Kingdom operates outside the EU’s principal carbon-market framework but must meet its own legally binding carbon budgets while managing financial and industrial exposure to international developments. The economic success of these approaches cannot be inferred solely from statutory ambition; it requires measurable investment, operational capacity, verified emissions reductions and sustainable distributional arrangements.
Key Judgments — Chapter 8
The European climate framework has entered a phase in which legal ambition, carbon-market instruments and industrial financing must be translated into measurable operational outcomes. The amended European Climate Law, the existing ETS, the planned launch of ETS2 and the allocation of carbon-market revenues establish a substantial common regulatory architecture, but national implementation remains uneven because energy systems, industrial structures and fiscal conditions differ. Italy, France, Germany and the United Kingdom should therefore be evaluated separately according to their physical emissions, investment requirements and applicable legal instruments.
What would change the assessment: Verified evidence that member states are systematically achieving emissions reductions while maintaining competitive industrial investment and improving household access to lower-emission technologies would strengthen confidence in the effectiveness of the existing framework. Persistent delays in infrastructure deployment, rising compliance costs without corresponding reductions or materially unequal access to transition finance would justify reassessment of implementation priorities.
Open official record: The decisive monitoring requirements are national emissions inventories, ETS compliance data, actual auction-revenue expenditure, commissioned infrastructure, industrial capital investment, electricity-system performance and the distributional consequences of carbon pricing. Targets and financial allocations should remain clearly distinguished from completed projects and observed reductions.
Chapter 9. Strategic Scenarios, Policy Instruments and the 2026–2031 Outlook
The Strategic Outlook: From Climate Commitments to Measurable Economic Transformation
The principal judgment for 2026–2031 is that the effectiveness of climate governance will depend less on the introduction of additional general declarations concerning emissions responsibility than on the capacity of governments to coordinate industrial investment, carbon-market implementation, financial supervision, public infrastructure and distributional protection within a coherent programme of measurable outcomes. The central uncertainty is whether public authorities can maintain credible emissions incentives while ensuring that enterprises and households possess the technical and financial ability to respond. A policy architecture that achieves formal regulatory compliance without sufficient infrastructure deployment may create economic costs without delivering the expected reductions. Conversely, substantial private investment in lower-emission technologies may fail to produce proportional benefits if it encounters network constraints, inadequate market demand or ineffective regulatory coordination. The decisive criterion is therefore implementation performance rather than the nominal stringency of legislation or the visibility of particular fiscal measures.
The international energy-investment outlook indicates that financial resources are being mobilised on a substantial scale, but the distribution and effectiveness of those resources remain uncertain. The IEA’s estimate of US$3.4 trillion in total global energy investment during 2026, including approximately US$2.2 trillion directed toward cleaner electricity and associated technologies, provides a relevant indication of capital-market activity. Yet investment flows do not automatically reveal the quantity of emissions avoided, because different projects possess different technical characteristics, operating lives and counterfactual alternatives. Expenditure on electricity networks may enable future renewable generation without producing an immediately measurable reduction at the date of construction. Energy-efficiency investment may lower consumption per unit of output while overall demand continues to rise. Industrial technology conversion may reduce emissions intensity while changes in production volumes affect absolute emissions. Financial monitoring must therefore accompany physical performance indicators rather than substitute for them. World Energy Investment 2026 — International Energy Agency — May 2026. IEA
A further complication arises from the interaction between climate policy and geopolitical energy security. The IEA’s 2026 assessment identifies renewed concern about supply reliability and the implications of the Middle East conflict for energy investment, with governments and enterprises reassessing the balance between domestic energy resources, international supply chains and infrastructure resilience. Such conditions can strengthen investment incentives for renewable energy, nuclear power, networks and storage where these technologies reduce dependence on imported fuels. They can also encourage investment in conventional energy infrastructure where governments prioritise immediate supply security. The direction of the resulting emissions effect cannot be inferred solely from the presence of an energy-security shock; it depends on which assets are built, the technologies they displace and the period over which they operate. Impacts of Middle East Conflict Set to Reshape Energy Investment Plans — International Energy Agency — May 2026. IEA
For institutional decision-makers, the five-year outlook should therefore be assessed through alternative pathways whose outcomes remain conditional on observable developments. Numerical probabilities would imply a degree of predictive precision unsupported by the available evidence. A more defensible approach identifies competing mechanisms, the circumstances under which each becomes influential, the indicators that would support or weaken it and the consequences for fiscal, industrial and environmental policy.
Three Strategic Pathways for 2026–2031
Pathway A — Distributional Intervention Without Sufficient Industrial Transformation
Under the first pathway, governments place growing emphasis on taxation of high-income consumption, concentrated financial assets and selected emissions-intensive activities, while electricity networks, industrial infrastructure and technology deployment progress more slowly than required. This approach may generate fiscal revenue and address certain distributional concerns, especially where measures are targeted effectively and accompanied by transparent revenue allocation. However, its environmental performance would remain constrained if the affected tax bases are only weakly connected to the large-scale industrial and energy processes responsible for emissions. The resulting problem would not necessarily be excessive taxation as such, but a mismatch between the selected fiscal instruments and the technical changes required to reduce physical emissions.
This pathway could emerge where public authorities face strong demands for visible distributive action but possess limited capacity to coordinate complex infrastructure projects or undertake sustained public investment. It could also arise where financial measures are easier to legislate than reforms involving energy networks, permitting, industrial restructuring and public procurement. In such circumstances, governments may record progress in revenue collection or financial redistribution without achieving corresponding reductions in emissions-intensive production. The possibility of capital mobility could further complicate the outcome where taxes affect mobile assets or future investment decisions, although the scale and direction of such effects would depend on legal design and economic conditions.
The primary warning indicators would be increasing fiscal intervention without a corresponding improvement in verified emissions performance, low rates of commissioned energy infrastructure, delayed industrial investment and persistent reliance on carbon-intensive technologies. The appropriate policy response would not automatically be the reversal of distributional measures. It would be to connect them more directly to emissions-producing activities and the financing of infrastructure, while preserving fiscal equity objectives that can be achieved without unnecessary investment distortion.
Pathway B — Capital-Led Technological Expansion With Uneven Distributional Outcomes
The second pathway involves accelerated private investment in electricity generation, industrial technology, efficiency and related infrastructure, supported by carbon-market incentives and selective public financing. Under this configuration, the physical capacity for decarbonisation could improve substantially, particularly where projects are commercially viable and regulatory uncertainty is limited. However, the distribution of costs and benefits may remain uneven if households encounter high adjustment costs, regions lose employment in declining industries or public subsidies concentrate financial returns among established market participants without adequate accountability.
The economic mechanism is based on the mobilisation of capital toward productive technologies, but its limitations arise from the structure of the markets in which those technologies are deployed. Access to networks, industrial sites, qualified labour and financing is not uniform, and investment opportunities may cluster in regions already possessing favourable infrastructure and economic conditions. Small enterprises may face different financing costs from large corporations, while households may remain unable to purchase cleaner technologies even when those technologies are available. The resulting transition can produce measurable emissions reductions and improvements in energy-system performance while generating political resistance if the economic burden is perceived as unfair or if public expenditure creates benefits that are insufficiently transparent.
The principal warning indicators would include declining emissions alongside deteriorating household affordability, weak access to clean technologies among lower-income groups, persistent regional investment disparities and high public expenditure with limited additionality. The policy response should focus on reducing adjustment barriers, improving competitive access to finance and ensuring that fiscal support produces public benefits proportionate to its cost. This would preserve the investment momentum while addressing distributional vulnerabilities capable of undermining long-term policy stability.
Pathway C — Integrated Industrial, Financial and Social Climate Governance
The third pathway combines sector-specific emissions regulation, infrastructure investment, targeted fiscal measures, financial-risk oversight and household protection within a coordinated framework. The objective is not to maximise the number of policy instruments but to ensure that different interventions address distinct and identifiable economic barriers. Carbon pricing and performance standards influence emissions-producing decisions; public infrastructure investment enables technological substitution; financial regulation improves risk recognition; targeted transfers protect vulnerable households; and competition and procurement oversight limit the possibility that public support generates excessive private rents without corresponding environmental benefits.
The economic strength of this approach is the alignment of policy instruments with their underlying transmission mechanisms. A carbon-price signal becomes more effective when households and enterprises have access to practical alternatives. Public support becomes more defensible when it removes a specific financing or infrastructure constraint and produces measurable additional investment. Financial disclosure becomes more useful when it is connected to the physical performance of the assets financed. Adaptation investment becomes more accountable when project outcomes are evaluated through reductions in vulnerability and economic disruption rather than exclusively through amounts committed.
The principal risk is implementation complexity. Coordinating fiscal, industrial, energy, environmental and financial authorities requires institutional capacity and consistent reporting systems. Responsibilities can become fragmented, particularly where several levels of government possess overlapping mandates or where public programmes depend on private investment decisions outside direct governmental control. Consequently, integrated governance should not be treated as automatically successful. Its effectiveness depends on clearly assigned responsibilities, credible implementation schedules, independent evaluation and the capacity to revise instruments when observed results diverge from expectations.
Table 19 — Strategic pathways and decision indicators, 2026–2031
| Analytical dimension | Pathway A: Wealth-centred | Pathway B: Capital-led | Pathway C: Integrated governance |
|---|---|---|---|
| Primary mechanism | Redistribution and selected consumption restrictions | Technology investment and market incentives | Coordinated regulatory, financial and infrastructure measures |
| Principal potential benefit | Fiscal equity and targeted emissions reductions | Faster deployment of productive low-emission assets | Alignment of emissions reduction, investment and social protection |
| Main vulnerability | Weak connection to large physical emissions sources | Unequal distribution of transition costs | Administrative and institutional complexity |
| Industrial investment | Potentially constrained if fiscal design discourages investment | Central driver of the pathway | Supported through targeted removal of barriers |
| Household distribution | Depends on taxation and revenue allocation | Risk of unequal adjustment capacity | Explicit compensation and infrastructure access |
| Fiscal exposure | Revenue potential with behavioural uncertainty | Subsidy and guarantee costs | Multiple instruments requiring coordinated budget control |
| Key emissions indicator | Physical reductions attributable to targeted instruments | Operational reductions from deployed technologies | Verified sectoral reductions relative to coherent baselines |
| Key economic indicator | Net fiscal revenue and investment response | Productive investment and technology performance | Additional investment, fiscal cost and long-term resilience |
| Most important warning sign | Revenue increases without material emissions improvement | Investment growth with unaffordable adjustment burdens | Administrative spending without operational delivery |
These pathways are analytical scenarios rather than forecasts. They are not assigned probabilities or numerical effectiveness scores. Their mechanisms are informed by the IEA World Energy Investment 2026 — May 2026, OECD Tax Policy Reforms 2026 — September 2026 and European Climate Law — European Commission — 2026.
Public-Finance Priorities and the Allocation of Scarce Fiscal Resources
The public-finance challenge for 2026–2031 is to allocate scarce resources among competing climate-related activities according to their economic effectiveness, implementation feasibility and distributional consequences. Public budgets cannot eliminate all investment risks or finance the entire transition without substantial private participation. At the same time, exclusively private investment may remain inadequate where infrastructure possesses public-good characteristics, where revenue streams cannot capture the full social benefit or where financing conditions prevent economically valuable projects from proceeding. The appropriate institutional response is to identify the specific market failure or coordination problem associated with each intervention, then select a financing mechanism proportionate to that problem.
Electricity networks represent a relevant case because their development can enable investment across generation, storage, industrial electrification and other activities. The social value of network reinforcement may exceed the revenues attributable to one individual project, particularly where several investments depend on the same infrastructure. Public regulation and coordinated planning can therefore influence the timing and scale of network development. However, network expenditure should not be treated as economically beneficial solely because it supports the transition. Project selection must account for expected demand, connection requirements, reliability and the cost of alternative investments. Excessive or poorly located network capacity can create unnecessary costs, while delayed investment can prevent lower-emission technologies from operating at the required scale.
Industrial support requires a different assessment. Where technologies face high initial costs or uncertainty, public finance may help overcome barriers to deployment. Yet support should be designed to avoid subsidising activity that would occur without intervention. Competitive allocation mechanisms, performance requirements and provisions addressing failure or non-delivery can reduce fiscal exposure. The principal measure of success should be the additional productive capacity or emissions reductions achieved relative to a credible counterfactual, not the gross amount of private investment announced. This distinction is especially important where government financial support accompanies investment decisions made by large enterprises possessing substantial access to commercial capital.
Household support must similarly distinguish immediate financial relief from structural improvements. Transfers can address short-term affordability pressures, while building renovation, efficient heating and transport infrastructure can reduce long-term exposure to energy prices and carbon-related costs. The allocation between these measures should reflect national housing and transportation conditions, household incomes and the availability of alternative technologies. An intervention that offers an incentive for cleaner equipment without addressing upfront financing constraints may disproportionately benefit households already able to invest, while a programme focused solely on recurring compensation may leave vulnerability unchanged.
Table 20 — Public-finance priorities and evaluation requirements
| Spending priority | Public-policy rationale | Appropriate funding characteristics | Main implementation risk | Required evidence of effectiveness |
|---|---|---|---|---|
| Electricity networks | Remove infrastructure bottlenecks | Regulated investment and appropriate public support | Delays, cost overruns and poor location decisions | Operational connections, utilisation and reliability |
| Industrial decarbonisation | Support technology adoption and address investment barriers | Competitive grants, contracts or financing support | Subsidising investment that would happen anyway | Verified production capacity and emissions performance |
| Building efficiency | Reduce energy demand and affordability exposure | Targeted household support and financing | Regressive access and inadequate contractor capacity | Completed retrofits and measured energy savings |
| Low-emission transport | Enable substitution away from fossil fuels | Infrastructure and targeted incentives | Infrastructure gaps and uneven regional access | Usage, operational availability and emissions change |
| Adaptation infrastructure | Reduce expected damage and service interruption | Public investment, concessional finance and suitable private participation | Poor project appraisal and weak maintenance | Reduced vulnerability and improved infrastructure service |
| Transition workforce | Support labour-market adjustment | Training and regional development programmes | Skills mismatch and limited employer demand | Employment transitions and sustained job placement |
| Financial-risk oversight | Improve resilience of financial institutions | Supervisory capacity and reporting systems | High compliance costs without improved decisions | Risk identification and demonstrable supervisory response |
| Household compensation | Protect vulnerable consumers | Targeted fiscal transfers | Leakage and continued dependence on compensation | Net household burden and access to alternatives |
Analytical policy framework. The allocation of financing instruments should follow project characteristics and national fiscal conditions, not an assumed uniform preference for subsidies, taxation or private capital.
Regulatory Options: Authority, Expected Effect and Implementation Risk
Climate-related regulation should be designed through identifiable legal authority and measurable objectives. Carbon-market authorities can revise aspects of compliance and market-stability arrangements within the applicable legislative framework. Energy regulators and competent governments can influence infrastructure planning and investment conditions. Fiscal authorities can establish or amend taxation and compensation within their constitutional and statutory powers. Financial supervisors can require relevant risk management and reporting under their mandates. Procurement authorities can impose conditions on public contracts, while competition authorities can address market conduct within applicable law. These institutions do not possess interchangeable powers, and a policy requiring legislative amendment cannot be treated as administratively available simply because it would be economically desirable.
The choice of instrument should also reflect the time required for the desired effect. Tax changes may influence prices or disposable income relatively quickly, but the construction of industrial infrastructure generally requires longer periods. A financial disclosure requirement can improve information availability without immediately changing emissions, while a new production standard may require capital investment before compliance can be achieved. Public procurement can create demand for particular technologies, but its effectiveness depends on contract design, supplier capacity and the commissioning of operational assets. The appropriate sequencing should therefore connect near-term regulatory signals with realistic implementation schedules.
Table 21 — Policy options for European governments, 2026–2031
| Policy option | Competent authority | Expected effect | Implementation burden | Time-to-effect | Reversibility | Principal downside |
|---|---|---|---|---|---|---|
| Improve carbon-market stability | EU institutions under the applicable ETS framework | Greater predictability of allowance-market conditions | Legal and market administration | Near to medium term | Rules adjustable by the required legal process | Price distortions or weakened incentives if poorly designed |
| Accelerate network investment | National authorities, regulators and network operators | Greater capacity for electrification | High technical and capital requirements | Medium to long term | Low after construction | Excess costs or stranded capacity |
| Target industrial transition support | EU and national authorities under state-aid and budget rules | Additional deployment of lower-emission technologies | High appraisal and monitoring burden | Medium to long term | Limited after contractual commitment | Windfall subsidies and fiscal exposure |
| Tax selected high-emission luxury activities | National fiscal authorities within applicable law | Direct incentive against covered consumption | Moderate, depending on tax base | Near term | Generally reversible | Avoidance, relocation and limited emissions coverage |
| Strengthen wealth-related tax compliance | National tax authorities and international cooperation mechanisms | More reliable collection and improved fiscal fairness | Valuation and enforcement requirements | Medium term | Legally adjustable | Administrative costs and investment effects |
| Expand household transition support | National authorities and relevant EU funding mechanisms | Greater affordability of cleaner technologies | Targeting and delivery capacity | Near to medium term | Transfers adjustable; infrastructure long-lived | Poor targeting and persistent subsidy dependence |
| Integrate climate risks into financial oversight | Central banks and competent financial supervisors | Better identification of financial vulnerabilities | Data and supervisory capacity | Medium term | Regulatory requirements adjustable | Compliance burden and imperfect risk models |
| Improve public adaptation procurement | National and local procurement authorities | Higher resilience per unit of expenditure | Engineering, contract and audit requirements | Medium to long term | Limited after project delivery | Cost overruns and ineffective protection |
Legal and institutional reference points: European Climate Law — European Commission — 2026; ETS2 Market Stability Reserve Decision — Council of the European Union — October 2026; OECD Tax Policy Reforms 2026. Time-to-effect categories are analytical assessments, not statutory implementation deadlines.
The 2026–2031 Monitoring Framework: From Political Commitments to Verifiable Outcomes
The credibility of climate governance increasingly depends on the ability to compare commitments with implementation. Legislative targets establish obligations, financial allocations identify authorised resources and project announcements indicate intended activity, but none establishes that emissions have already declined or that infrastructure has become operational. The monitoring framework should therefore distinguish policy adoption, financing commitments, disbursements, physical delivery and realised environmental outcomes. These stages are connected but should not be collapsed into a single measure of progress.
For the European Union, verified emissions under the ETS provide an important annual indicator, while allowance-market conditions and revenue allocation can help explain the economic incentives and public-finance resources associated with compliance. For Italy, the progression from renewable-generation objectives to operational generation, connection capacity and industrial investment should receive particular attention. For France, implementation of SNBC-3 should be assessed against sectoral emissions and the relationship between territorial production and consumption-related carbon footprints. For Germany, the 2026 programme’s estimated additional emissions avoidance should be evaluated against actual project implementation and subsequent verified sectoral performance. For the United Kingdom, the formal carbon budgets provide a legally defined cumulative limit, making the relationship between annual emissions trajectories and five-year compliance central to the assessment.
The methodology must also avoid inappropriate cross-country comparisons. A reduction in electricity-sector emissions in one country cannot automatically be compared with the total national greenhouse-gas reduction of another. Carbon-budget periods cannot be treated as annual values, and objectives relative to 1990 cannot be compared directly with sectoral reductions relative to 2005. Similarly, financial expenditure in euros or pounds should not be converted into a measure of policy effectiveness without accounting for the scale, coverage and physical outcomes of the projects financed. A rigorous monitoring framework should preserve these definitions and report uncertainty where data are provisional or incomplete.
Table 22 — Principal watch indicators for 2026–2031
| Indicator | Relevant authority or data source | Measurement | Decision significance |
|---|---|---|---|
| Global energy investment | IEA | Annual expenditure by energy technology | Capital allocation and investment direction |
| EU ETS verified emissions | European Commission | Annual covered emissions | Physical compliance performance |
| EU ETS allowance-market conditions | European Commission and market records | Allowance supply, prices and stability mechanisms | Strength of the carbon-price incentive |
| Carbon-market fiscal revenue | European Commission and national authorities | Auction receipts and qualifying expenditure | Resources available for policy implementation |
| ETS2 operational development | EU institutions and competent national authorities | Legal implementation, market operations and compliance | Household and transport-related carbon-pricing exposure |
| Italian electricity transformation | MASE and competent energy-system institutions | Generation, installed capacity and network development | Feasibility of PNIEC objectives |
| French SNBC-3 implementation | French government and competent statistical institutions | Sectoral emissions and carbon-budget compliance | National transition performance |
| German 2026 climate programme | Federal government and Umweltbundesamt | Programme delivery and verified emissions | Achievement of planned additional mitigation |
| UK carbon-budget progress | DESNZ and Climate Change Committee | Annual and cumulative net UK carbon account | Statutory compliance trajectory |
| Household affordability | National statistical and fiscal authorities | Net energy burden and access to alternatives | Distributional sustainability |
| Industrial competitiveness | National and EU economic authorities | Investment, output and relevant cost indicators | Productive capacity and adjustment pressure |
| Adaptation effectiveness | National governments and development institutions | Operational resilience and avoided disruption | Real economic benefits of preventive investment |
| Financial-system exposure | Competent central banks and supervisors | Climate-sensitive assets, collateral and credit risks | Financial resilience |
Primary monitoring institutions include the International Energy Agency, European Commission, German Federal Environment Agency, French Ministry for Ecological Transition and United Kingdom Department for Energy Security and Net Zero.
Strategic Decision Thresholds and Conditions for Policy Revision
The purpose of monitoring is not merely to produce more information but to identify the conditions under which policy should change. A government should reconsider the design of an investment subsidy when evidence indicates that publicly supported projects would have proceeded without assistance or that payments are materially disconnected from operational delivery. Carbon-pricing arrangements should be reviewed where market instability or inadequate technological alternatives materially weakens the effectiveness or social sustainability of the price signal. Household-support programmes should be reassessed where expenditure is substantial but access to affordable alternatives remains limited. Industrial regulations should be examined where technical compliance requirements cannot be met because essential infrastructure is unavailable within the required period. These are decision conditions rather than automatic prescriptions, and their application requires evidence concerning the scale and cause of the observed problem.
A particularly important threshold concerns the difference between reported financial decarbonisation and reductions in real-world emissions. Financial institutions may report lower portfolio-associated emissions following changes in asset ownership, but public authorities should not infer corresponding physical improvements unless the emissions performance of the underlying companies or assets changes. Similarly, government programmes should not claim climate success from investment commitments when projects have not been commissioned or where the resulting reduction relative to a credible counterfactual has not been established. The reporting framework should therefore retain both financial and physical indicators, allowing each to be interpreted according to its purpose.
The European Union’s experience with carbon-market regulation provides a practical example of adaptive policy design. The October 2026 ETS2 market-stability amendment responds to concerns about allowance-market predictability by modifying the reserve mechanism ahead of the planned 2028 launch. The decision illustrates that regulatory adaptation need not entail abandoning an environmental objective; it can involve altering the mechanism through which the objective is pursued, subject to the applicable legal process. The effectiveness of that adjustment will depend on actual market conditions and the resulting behaviour of fuel suppliers, consumers and investors. ETS2: Council Signs Off on Rules Strengthening the Market Stability Reserve — Council of the European Union — October 2026. Consilium
For the 2026–2031 horizon, a defensible institutional approach would establish explicit review points associated with annual emissions inventories, investment reports, fiscal execution and major regulatory milestones. The review process should consider whether the relevant physical and economic conditions have changed sufficiently to justify modifications to taxes, subsidies, standards or financial rules. It should avoid treating every short-term fluctuation as evidence that the policy framework has succeeded or failed. Weather conditions, economic activity, energy prices and investment cycles can influence annual outcomes, so assessments should distinguish temporary developments from persistent changes in emissions intensity, infrastructure capacity and productive technology.
Final Net Assessment — Climate Governance, Capital Allocation and the Limits of Wealth-Centred Policy
The international climate-policy challenge is fundamentally one of transforming the physical systems through which modern economies produce energy, manufacture goods, transport people and materials, construct infrastructure and maintain essential services. The distribution of wealth and financial ownership matters because it influences consumption, investment capacity and participation in economic decision-making. Yet these relationships do not establish that concentrated wealth alone determines global emissions, nor that altering the ownership of financial assets necessarily changes the productive processes responsible for greenhouse-gas releases. Economic responsibility must therefore be assessed through distinguishable mechanisms: physical production, final consumption, financing decisions, governance authority and the effects of public regulation.
The financial opportunities generated by climate-related recovery and adaptation also require careful separation from the economic costs of environmental damage. Revenue earned by reconstruction businesses is not equivalent to a net increase in national wealth, and a profitable adaptation investment does not imply that its investors prefer greater future disasters. Financial institutions may possess exposures to businesses benefiting from increased resilience expenditure while simultaneously bearing physical and transition risks through other assets and liabilities. The existence of such holdings is insufficient to demonstrate coordinated obstruction of mitigation. Any conclusion concerning conflicts of interest requires evidence of financial benefit, actual influence and a causal relationship with relevant decisions.
The economic case for redistributive climate measures remains substantial where they address identifiable inequities, generate revenue efficiently or reduce particularly carbon-intensive consumption. Their limitations emerge when they are treated as substitutes for the extensive investment required across electricity, manufacturing, transportation, buildings and infrastructure. The IEA’s 2026 investment estimates demonstrate the scale of the capital involved, while the European regulatory framework illustrates the complexity of coordinating emissions objectives with fiscal and industrial policy. Effective mitigation consequently requires the mobilisation of both public and private resources, credible incentives, technological capability and institutions able to measure the resulting physical outcomes.
For Europe, the strategic issue is not whether climate ambition should be separated from industrial competitiveness, but how the two objectives can be made operationally compatible. The European Union’s legally binding 2030 and 2040 targets establish the long-term direction; the ETS and ETS2 provide important emissions-pricing mechanisms; and national programmes determine much of the practical investment and distributional response. Italy’s electricity and manufacturing transformation, France’s carbon-budget and consumption-footprint approach, Germany’s industrial climate programme and the United Kingdom’s statutory carbon budgets illustrate different pathways within a broader economic transition. Their success must be judged through verified emissions, infrastructure delivery, industrial investment, fiscal sustainability and the consequences for households.
The most defensible strategy for 2026–2031 is therefore an integrated approach in which emissions regulation establishes physical objectives, industrial and infrastructure policy enables technological change, financial governance improves risk recognition, fiscal instruments address environmental externalities and distributional inequities, and adaptation investment protects economic resilience. No single measure can perform all these functions effectively, and attempting to make wealth taxation, carbon pricing or private investment alone responsible for the entire climate transition would confuse distinct economic problems.
The decisive policy test is measurable performance. Governments should demonstrate not only that they have introduced taxes, issued regulations or mobilised financing, but that the resulting interventions have reduced greenhouse-gas emissions, increased productive resilience, improved access to lower-emission technologies and distributed economic costs in a sustainable manner. Financial institutions should distinguish changes in reported portfolio emissions from actual reductions in the emissions of the underlying productive system. Public authorities should evaluate climate-related spending according to additionality, operational delivery and the long-term public benefits created. International institutions should assess adaptation through reductions in vulnerability and the sustainability of financing arrangements, rather than relying exclusively on nominal commitments.
The final strategic conclusion is that climate change cannot be governed effectively through an economic theory that treats concentrated wealth as the comprehensive cause of emissions or assumes that commercial opportunities associated with disasters establish a general preference for environmental deterioration. The relevant policy challenge is broader and more demanding: aligning industrial production, household consumption, financial incentives and public institutions with measurable reductions in emissions and climate vulnerability, while maintaining the investment capacity necessary for long-term economic transformation.
This conclusion does not diminish the significance of inequality, political influence or excessive emissions associated with affluent consumption. It places those issues within a framework in which each policy intervention must be justified by its actual economic mechanism and assessed according to verifiable outcomes. Such a framework provides a more credible basis for government decision-making, financial supervision, industrial strategy and international cooperation than one built around a single category of economic actors or a presumed uniform financial incentive.
Final decision priorities: The immediate institutional priority is to preserve credible emissions incentives while accelerating infrastructure and industrial investment, maintaining transparent fiscal support and protecting households lacking affordable alternatives. The medium-term priority is to reconcile financial disclosure with physical emissions outcomes and strengthen the evaluation of public investment. The longer-term priority is to establish climate governance that remains economically viable and politically durable under changes in energy security, financial conditions, industrial competition and environmental exposure.
What would change the final assessment: The most important potential revision would arise from evidence establishing that a particular ownership or financial structure systematically determines emissions-related outcomes in a manner stronger than the influence of technology, demand, regulation and investment economics. A second would arise from robust evidence demonstrating that a narrowly defined fiscal measure can deliver large, additional emissions reductions without imposing disproportionate adjustment costs or weakening productive investment. A third would arise if the observed implementation of existing carbon-market and industrial policies consistently failed to produce measurable physical reductions despite adequate infrastructure and investment availability. Each development would justify reconsideration of the relative importance of the available policy instruments.
Open official record: The final assessment should be updated through verified national and sectoral emissions inventories, the implementation records of the European climate framework, audited or formally reported expenditure under public climate programmes, financial-system risk disclosures, infrastructure commissioning data, distributional studies and independent evaluations of adaptation performance. These records provide the evidentiary basis for distinguishing effective public intervention from measures whose apparent success depends principally on financial accounting, regulatory announcements or changes in the distribution of ownership.


