














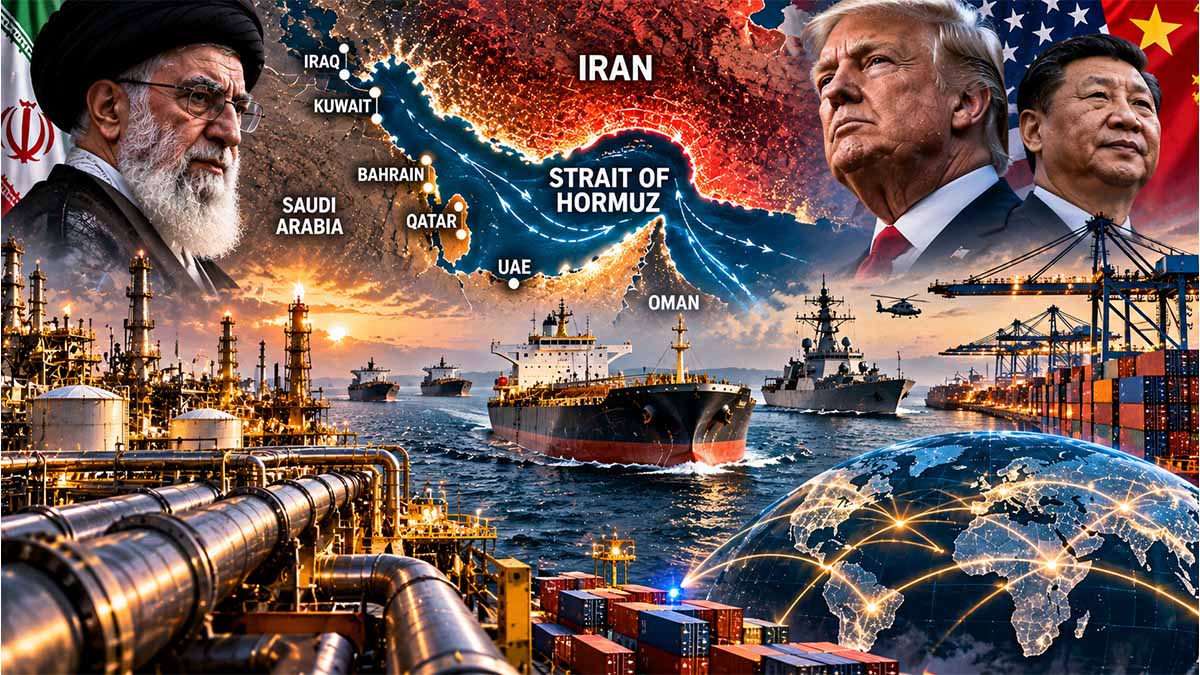
The economic consequences of maritime insecurity, constrained energy exports, disrupted logistics networks and the emergence of a structurally more expensive global trading environment.
Executive Summary — Bottom Line Up Front
Principal judgment — High confidence: The Strait of Hormuz remains commercially impaired and militarily hazardous despite ongoing diplomatic efforts. A reopening announcement would not, by itself, establish safe navigation, recover pre-conflict shipping capacity or eliminate the financial risk premium embedded in international transport.
The International Maritime Organization (IMO) reported 122 confirmed maritime incidents and 24 seafarer fatalities as of 30 October 2026. These figures establish that the crisis extends beyond a temporary interruption to shipping schedules. It is a sustained maritime-security emergency with direct commercial and humanitarian consequences. Highlighted (Confirmed) incidents
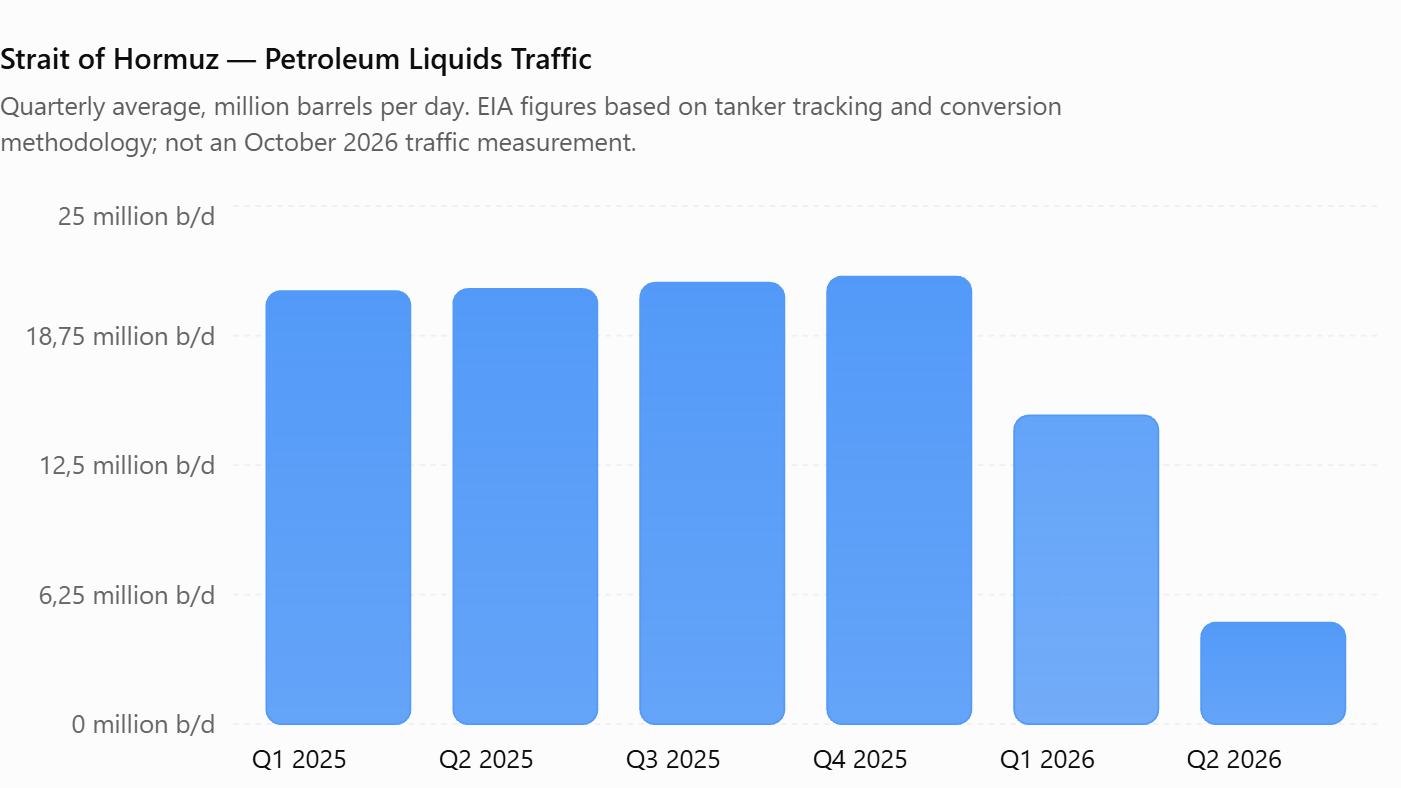
The U.S. Energy Information Administration (EIA) estimated that petroleum-liquids traffic through Hormuz declined from 21.6 million barrels per day in Q4 2025 to 4.9 million barrels per day in Q2 2026, a contraction of approximately 77.3%. These are historical quarterly figures, not a measurement of October traffic. U.S. Energy Information Administration (EIA)
Energy markets have absorbed part of the disruption through inventory withdrawals, pipeline diversion, ship-to-ship transfers and constrained production. Brent crude averaged $114 per barrel in September 2026, while the EIA’s October outlook projected $105 in Q4 2026 and $84 on average in 2027. These forecasts depend on the restoration of export capacity and therefore remain vulnerable to renewed attacks. U.S. Energy Information Administration (EIA)+1
Most probable operational pathway — Medium confidence: An uneven recovery, combining limited maritime access with intermittent security incidents, appears more defensible than either immediate normalisation or indefinite total closure. This is a qualitative judgment, not a statistically calibrated probability.
The most consequential structural risk through 2030 is that geopolitical insecurity becomes embedded in vessel deployment, insurance underwriting, freight contracting, supplier selection, feedstock sourcing and working-capital requirements even after major hostilities decline.
Immediate decision implication: Logistics directors and procurement executives should prioritise verified route access, available tonnage, alternative-port capacity, critical-material inventories and enforceable contingency provisions rather than relying on political announcements or assumed freight-market normalisation.
The Strait of Hormuz Crisis: When Maritime Insecurity Becomes a Permanent Cost of Global Trade
From the US–Iran confrontation to energy markets, shipping capacity and industrial supply chains, the Middle Eastern crisis is exposing the limits of military deterrence and the economic consequences of an increasingly fragmented international trading system.
The central contradiction of the Middle Eastern crisis in October 2026 is that diplomatic agreements have promised to restore maritime access without delivering the security conditions required for normal international commerce. The United States and Iran announced a ceasefire framework on 14 June, yet attacks on commercial vessels, threats to Gulf infrastructure and restrictions on shipping continued. For Washington, the issue is the credibility of deterrence and freedom of navigation; for Tehran, the preservation of economic and strategic leverage; for Gulf governments, the protection of energy revenues and civilian infrastructure. The consequences extend into Europe and Asia, where manufacturers face unstable feedstock availability, longer transport cycles and higher working-capital requirements. The decisive economic shift is that maritime insecurity is becoming a recurring cost of production and distribution, not merely an exceptional freight surcharge.
A diplomatic agreement cannot reopen a commercially unsafe corridor
The United States commenced military operations against Iran on 28 February 2026 and subsequently notified the United Nations Security Council under Article 51 of the UN Charter. Washington identified the protection of American interests, regional partners and international maritime commerce among its objectives. The ceasefire announced on 14 June, with diplomatic involvement from Qatar, Pakistan, Saudi Arabia, Egypt and Türkiye, appeared to establish a framework for reopening Hormuz. Yet renewed confrontations followed, prompting further United Nations interventions in July concerning attacks on vessels, neighbouring states and the restoration of navigational rights. The distinction is fundamental: a ceasefire may interrupt direct hostilities without eliminating the capacity to threaten shipping or restoring the willingness of insurers and shipowners to accept commercial exposure. United States Letter to the Security Council — United Nations — March 2026; Ceasefire Announcement — United Nations — June 2026.
The International Maritime Organization recorded 122 confirmed maritime incidents and 24 seafarer fatalities as of 30 October 2026. UK Maritime Trade Operations documented further threats against commercial tankers during October, including interference with passage, projectile strikes and vessel fires. The IMO’s earlier evacuation programme had moved 136 vessels carrying approximately 2,900 seafarers between 23 and 26 June before the security framework was interrupted following another attack. These figures reveal the weakness of treating individual successful voyages as proof of normalisation. Humanitarian passage, restricted commercial movement and reliable scheduled shipping are three different operating conditions. IMO — Confirmed Maritime Incidents — October 2026; UKMTO — Maritime Incidents — October 2026.
For Iran, selective disruption offers the possibility of imposing international economic costs without maintaining a complete physical closure. For the United States, conventional military superiority does not automatically translate into commercially acceptable risk for every tanker or container vessel. The June and July diplomatic sequence exposed the resulting strategic imbalance: Washington and Tehran could negotiate restraint while commercial operators continued pricing the possibility of renewed attacks. A durable settlement must therefore produce observable navigation security, credible implementation and repeated commercial movements rather than another declaration of reopening.
The energy figures show why bypass infrastructure cannot replace lost Gulf capacity
The U.S. Energy Information Administration measured petroleum-liquids traffic through Hormuz at 21.6 million barrels per day in the fourth quarter of 2025, falling to 4.9 million barrels per day in the second quarter of 2026. That represents a contraction of approximately 77.3%. Crude oil and condensate movements declined from 15.9 million to 3.7 million barrels per day, while refined-product traffic fell from 5.7 million to approximately 1.1 million. LNG movements suffered an even sharper contraction, from 10.5 billion to 0.8 billion cubic feet per day, a decline of approximately 92.4%. These figures describe historical quarterly averages rather than October shipping volumes, but they establish the scale of the physical shock confronting energy importers and industrial consumers. EIA — Global Energy Security Data — August 2026.
Alternative maritime routes cannot simply absorb those missing volumes. Between the fourth quarter of 2025 and the second quarter of 2026, petroleum-liquids movements through Bab el-Mandeb increased from 5.4 million to 8.1 million barrels per day, while traffic around the Cape of Good Hope actually declined from 9.9 million to 9.4 million barrels per day. The discrepancy matters because lost Hormuz exports are not automatically rerouted: some volumes depend on alternative pipelines, substitute production, inventories or reduced deliveries. The existence of another maritime corridor does not create additional crude production or the specialised infrastructure needed to export and receive LNG. EIA — Global Energy Security Data, Chokepoint Flows — August 2026.
The vulnerability of bypass infrastructure became evident in September, when attacks disrupted Saudi Arabia’s East–West pipeline, previously transporting more than 5 million barrels per day toward Red Sea export facilities. Brent reached a reported daily spot price of $131 per barrel on 15 September. The EIA subsequently reported partial restoration of pipeline operations, but the incident demonstrated that geographical diversification can transfer vulnerability rather than eliminate it. The agency estimated regional crude-production shut-ins at 10.9 million barrels per day at their May peak, declining to 4.8 million in September, with 4.5 million forecast for the fourth quarter. EIA — Global Oil Markets — October 2026.
Brent averaged $114 per barrel in September, against the EIA’s October forecast of $105 for the fourth quarter and $84 on average in 2027. Those projections assume meaningful recovery in export capacity and remain vulnerable to further infrastructure disruption. Lower anticipated oil prices would ease one component of industrial costs, but they would not automatically restore LNG availability, petrochemical feedstocks, maritime insurance or interrupted manufacturing supply chains.
The Cape route preserves trade while consuming shipping capacity
Maritime diversion has an economic consequence that extends beyond fuel expenditure. World Bank analysis estimated that sailing around the Cape of Good Hope instead of using Suez could add approximately 3,000–3,500 nautical miles and seven to ten days to typical Europe–Asia movements, absorbing an estimated 700,000–1.9 million TEUs of effective container capacity under the conditions examined in January 2024. The capacity is not physically destroyed; it becomes less productive because vessels and containers remain employed for longer periods. The distinction explains why available fleet tonnage can increase while shipping capacity remains commercially constrained. World Bank — Red Sea Shipping Diversions — January 2024.
On 1 March 2026, Maersk announced diversions of its ME11 and MECL services around southern Africa and suspended Hormuz crossings. In July, the carrier announced the restoration of selected trans-Suez movements, with its MECL service expected to gain seven days westbound and fourteen days eastbound. These decisions demonstrate that transport costs depend on route-specific operating conditions, rather than a universal surcharge applicable to every vessel. Returning to a shorter corridor releases productive capacity, but maintaining that recovery also requires predictable ports, schedules and safe passage. Maersk — Structural Changes to MECL — July 2026.
By 30 October, Hapag-Lloyd reported 84% yard density at Salalah, with berthing delays of up to 36 hours; Jeddah recorded 76% yard density, while Colombo faced reported yard densities above 110% and an inter-terminal transfer backlog exceeding 50,000 TEUs. Jebel Ali remained subject to ad hoc vessel calls. These were specific terminal observations, not uniform regional averages, but they demonstrated how diverted traffic could generate new constraints at locations intended to relieve the original disruption. Hapag-Lloyd — Middle East Operational Update, Week 44 — October 2026.
The commercial consequence is a redistribution of cost across the transport chain. Longer rotations increase vessel requirements and container occupation; congested terminals create missed connections; alternative inland corridors add handling, customs and trucking expenditure. A company may succeed in securing ocean transport yet still miss its delivery commitment because the destination network cannot release or distribute the cargo reliably.
The petrochemical shock reaches factories before it reaches consumers
The energy shock is transmitted into manufacturing through distinct feedstock and processing markets. Crude oil affects refinery economics and naphtha availability; natural gas and ethane influence other chemical-production routes; ethylene and propylene support the production of polyethylene, polypropylene and industrial intermediates used in packaging, automotive components, construction materials and consumer goods. The EIA’s reported contraction in petroleum and LNG movements therefore matters beyond the direct cost of fuel. It exposes manufacturers to disruptions in the availability of materials that cannot necessarily be replaced by purchasing an equivalent commodity on the spot market.
For packaging converters and industrial manufacturers, substitution is constrained by product specifications, equipment compatibility and regulatory requirements. A replacement polymer may be commercially available yet unsuitable for an existing production process or food-contact application. Similarly, fertilizer production depends heavily on gas-derived inputs, creating a transmission route from energy disruption into agricultural supply costs. The critical variable is not only the market price of an input, but whether it can be delivered in the required specification before production must stop.
The consequences are amplified by inventory financing. Longer delivery cycles require more goods in transit or held as precautionary stock, while higher feedstock prices increase the capital required to finance the same physical quantity. Contractual differences determine who absorbs those costs. Manufacturers bound by fixed customer prices may face immediate margin compression, while retailers can experience delayed purchasing-price increases when supply agreements are renewed. A falling Brent benchmark during 2027 would not necessarily reverse those effects if procurement contracts, insurance conditions or material availability remained constrained.
Gulf security now extends into airports, digital networks and industrial controls
Saudi Arabia’s October security requirements demonstrated that the crisis could not be contained within maritime operations. On 20 October, the British Ministry of Defence announced additional support involving RAF Typhoon aircraft, an A400M transport aircraft and military advisers, citing threats to Saudi civilian and strategic infrastructure, including King Khalid International Airport in Riyadh. These defensive measures illustrate the growing overlap between territorial security and the reliability of regional aviation and logistics connections. They do not, by themselves, establish a measurable percentage loss of Saudi air-cargo capacity. UK Ministry of Defence — Operational Support to Saudi Arabia — October 2026.
The European Union Aviation Safety Agency revised its guidance on GNSS interference in July 2026 and maintained differentiated conflict-zone advisories for Saudi Arabia, Iran, Iraq and surrounding airspace. Maritime authorities likewise identified jamming and spoofing as operational hazards. The commercial significance lies in the difference between missing navigation information and apparently credible but incorrect coordinates. Corrupted positioning data can undermine vessel visibility, estimated arrival times and automated transport decisions even without physical damage to cargo. EASA — GNSS Interference Guidance — July 2026.
The National Institute of Standards and Technology’s September 2026 draft revision of its operational-technology security guidance addressed the growing convergence of industrial systems, connected infrastructure and cloud services. The risk is concentrated where logistics providers and manufacturers depend on common digital platforms for tracking, customs processing, warehousing or production control. Multiple software suppliers may offer little genuine redundancy if their services share the same infrastructure. The reviewed record does not establish a coordinated campaign against named Gulf AI data centres; the documented vulnerability is the dependence of physical operations on reliable digital information and recoverable technical systems. NIST — Guide to Operational Technology Security, Revision 4 Draft — September 2026.
The next 24 months will separate resilient industries from exposed balance sheets
From November 2026 through October 2028, the decisive question will be whether the recovery anticipated by the EIA produces sustained commercial normalisation or merely intermittent access accompanied by recurring security premiums. Three trajectories remain plausible: a durable negotiated stabilisation, prolonged low-intensity disruption or renewed high-intensity conflict. The available evidence does not justify precise probabilities. Each produces different consequences for vessel deployment, energy procurement, feedstock availability and financing, but all demonstrate the economic importance of knowing where critical supplies originate and how they reach production facilities.
For Italy, the vulnerability runs through Mediterranean connectivity, industrial inputs and import-dependent manufacturing. Germany faces exposure through integrated manufacturing networks and specialised intermediate goods. France combines chemical, maritime and industrial interests, while the United Kingdom faces additional exposure through shipping, insurance and its documented defensive commitments in the Gulf. China, India, Japan and South Korea confront differing combinations of energy-import requirements, industrial dependence and available inventories. The EIA estimated second-quarter 2026 strategic petroleum stocks at 1,492 million barrels for China, 187 million for Japan, 69 million for South Korea and 21 million for India, although those figures cannot be interpreted as comparable days of protection without consistent consumption and coverage data. EIA — Global Energy Security Data — August 2026.
The commercial costs of inaction will fall disproportionately on companies whose supply chains appear diversified through multiple contractual suppliers but remain dependent on the same production facilities, energy inputs, maritime gateways or digital infrastructure. Building effective redundancy requires qualified alternatives, selective inventories, verified transport capacity and contractual provisions that allocate extraordinary costs without making performance economically impossible. Excessive inventories and duplicative infrastructure can also erode competitiveness, making selective resilience more valuable than indiscriminate precautionary expenditure.
The resulting burden will be divided among governments financing regional security, carriers managing longer rotations, manufacturers absorbing input interruptions, retailers maintaining larger working-capital buffers and consumers facing part of the eventual price adjustment. The costliest business decision through 2028 will not necessarily be paying more for transport or inventories. It will be preserving a low-cost operating model whose production depends on access that neither military protection nor diplomatic announcements can reliably guarantee.
Hormuz may regain substantial commercial traffic before the underlying risk premium disappears. The longer-term economic consequence of the 2026 confrontation is therefore not simply an increase in the price of moving goods, but a change in how international industry must finance, contract and organise the continuity of trade.
Navigational Index
Pillar I — Geopolitical Escalation, Maritime Security and Strategic Access
Chapter 1. The US–Iran confrontation and the security architecture of the Persian Gulf : The evolution of hostilities, diplomatic mediation, Iranian and American strategic objectives, Gulf-state interests, freedom of navigation, escalation mechanisms and the constraints on a durable settlement.
Chapter 2. The Strait of Hormuz: negotiations, actual shipping movements and residual threats : AIS-based vessel movements, oil and LNG traffic, projectiles, suspected mines, maritime advisories, vessel classifications, insurance conditions, security guarantees and criteria for operational reopening.
Chapter 3. Saudi Arabia and Gulf transport hubs under military pressure : Missile and drone interceptions, regional airspace security, commercial aviation, air cargo, major distribution hubs, Gulf port connectivity and the vulnerability of alternative export corridors.
Pillar II — Global Energy, Maritime Logistics and Industrial Supply Chains
Chapter 4. The economic geography of maritime disruption : Cape of Good Hope diversions, Red Sea and Suez exposure, ship capacity, bunker consumption, insurance premiums, container imbalances, inland corridors and terminal congestion.
Chapter 5. Energy-price transmission and petrochemical supply chains : Crude oil, refined fuels, LNG, naphtha, ethane, olefins, polymers, packaging, fertilizers, manufacturing inputs, freight pass-through and downstream price formation.
Chapter 6. Retailers, manufacturers and the international redistribution of supply-chain exposure : Industrial and commercial consequences for the European Union, Italy, France, Germany, the United Kingdom, China, India and other Asian manufacturing economies, with particular attention to procurement, inventory financing and continuity of production.
Pillar III — Hybrid Infrastructure Risks, Strategic Scenarios and Resilience to 2030
Chapter 7. Cyber-physical disruption and the vulnerability of digital logistics infrastructure : GNSS jamming and spoofing, AIS integrity, air-navigation systems, data centres, AI-based logistics platforms, cloud concentration, operational technology and resilience of critical digital services.
Chapter 8. Scenarios for 2027–2030 and the economics of supply-chain resilience : Three alternative geopolitical trajectories, scenario-specific exposure across energy and freight markets, recovery conditions, financial and contractual resilience, effective business-continuity measures, decision thresholds and strategic monitoring indicators.
Master Abstract
The central strategic problem: reopening is not normalisation
The defining characteristic of the Gulf crisis in late October 2026 is the separation between diplomatic intentions, physical access to maritime corridors and the commercial conditions necessary for normal shipping. A vessel may technically complete a passage through Hormuz without demonstrating that the route is commercially reliable for a scheduled global logistics network. Reliable service requires predictable passage times, acceptable crew-safety conditions, available maritime insurance, access to compliant vessels, functioning port infrastructure and sufficiently stable security conditions to justify repeated voyages.
That distinction matters because global shipping depends on repeatability rather than isolated movements. A tanker undertaking a high-risk voyage under exceptional commercial conditions cannot be treated as equivalent to an unconstrained service. Similarly, a temporary rise in observed tanker movements does not necessarily indicate recovery across containerised cargo, LNG, chemical carriers or refrigerated shipments.
The international security record demonstrates persistent exposure. The IMO’s confirmed maritime incident series reached 122 incidents and 24 fatalities on 30 October. UKMTO advisories also continued to describe reported projectile attacks against outbound tankers during October, including incidents near the Strait and Oman’s surrounding waters. An agreement that reduces direct military confrontation without establishing sufficiently credible security guarantees would therefore leave the essential shipping constraint unresolved. Highlighted (Confirmed) incidents+1
The geopolitical challenge is further complicated by the geography of oil and gas infrastructure. Maritime access cannot be separated from the protection of terminals, export pipelines, pumping stations, refineries, electrical systems and associated digital networks. Attacks on an alternative export corridor can undermine the very infrastructure intended to mitigate restrictions at Hormuz. This was demonstrated by the September disruption to Saudi Arabia’s East–West pipeline, which the EIA reported had previously carried more than 5 million barrels per day toward the Red Sea before the interruption. U.S. Energy Information Administration (EIA)
The commercial crisis extends beyond petroleum markets
Energy-price transmission is central but insufficient to explain the full economic impact. Elevated crude prices increase the input costs of refiners and petrochemical producers. Fuel-market tightness raises shipping and inland distribution costs. At the same time, route diversions require longer deployment of vessels, additional fuel, revised port calls and more working capital tied up in goods moving between suppliers and customers. These processes operate at different speeds and can persist after crude-oil prices fall.
For manufacturers, the most damaging outcome is not necessarily an isolated increase in the cost of shipping. It is a combined deterioration in delivery reliability, material availability and production planning. A producer may encounter delayed polymer feedstocks, higher transportation charges and increased safety-stock requirements simultaneously. Even where the nominal freight-rate increase can be passed to customers, the financing burden of additional inventory, the cost of production stoppages and the risk of supplier failure may remain with the manufacturer.
This distinction is visible in carrier operations. On 30 October, Hapag-Lloyd reported that Jebel Ali was operating with ad hoc vessel calls, Salalah had yard density of 84% and berthing delays of up to 36 hours, while the Colombo terminals were confronting substantial congestion. These figures describe particular terminals and operating conditions, not a universal Gulf-wide delay rate. They nevertheless demonstrate how regional insecurity can create secondary constraints across interconnected transport networks. Hapag-Lloyd
The consequences for Europe are differentiated. Italy’s Mediterranean industrial and maritime system is sensitive to changes in Suez accessibility, petrochemical supply and Asian sourcing. Germany’s industrial economy is exposed through manufacturing input costs, export logistics and supplier dependencies. France combines refining and energy-market exposure with maritime, aerospace, chemical and distribution interests. The United Kingdom faces risks through energy imports, internationally integrated retail sourcing, financial and insurance services and maritime security obligations. At EU level, these exposures reinforce the need to distinguish common energy-market effects from heterogeneous national industrial dependencies.
Regional security is becoming a network-wide infrastructure risk
The crisis now has implications extending beyond merchant vessels. Saudi official statements recorded missile and UAV interceptions affecting Riyadh and the western regions during October. On 24 October, Saudi Civil Defense reported debris from intercepted ballistic missiles in areas associated with Makkah and Madinah. On 29 October, the Saudi-led coalition reported the interception of two ballistic missiles directed toward Riyadh. Such reports establish an operational threat environment, but do not independently establish corresponding airport closures or measured losses of air-cargo capacity. الوكالة العربية للأنباء+1
The significance for international logistics is that Gulf distribution networks combine seaports, airports, warehousing, road transport, energy infrastructure and telecommunications. Disruption in one layer can place additional demand on another. A temporary change in airspace access can affect aircraft rotations and time-sensitive shipments, while maritime diversions can increase demand for alternative ports and inland freight corridors.
Digital infrastructure introduces a separate source of vulnerability. Modern transport systems increasingly depend on satellite positioning, automated vessel identification, cloud-hosted shipment records, terminal operating systems and forecasting software. The International Civil Aviation Organization has formally identified interference with satellite navigation as an important operational safety problem, and Saudi Arabia has submitted technical work on monitoring GNSS performance and improving resilient navigation infrastructure. These are established technical concerns, not proof of a coordinated campaign against Gulf data centres or AI installations. Saudi Arabia GPMS_DME.docx
The relevant risk is therefore broader than the physical destruction of infrastructure. Interference with location data, impaired communications, uncertain asset visibility and dependencies on concentrated digital service providers can degrade logistics decisions without necessarily shutting down an entire transport network. The resilience test is whether operators can verify information independently, continue essential functions through degraded-service conditions and reconcile records when reliable connectivity returns.
Three pathways, one persistent restructuring pressure
The strategic outlook comprises rapid stabilisation, prolonged low-intensity disruption and renewed high-intensity conflict. Rapid stabilisation would require both diplomatic commitments and observable improvement in maritime safety, commercially viable insurance and sustained transport movements. Prolonged disruption would permit selective recovery but preserve high operational uncertainty, exceptional freight costs and recurring pressure on working capital. Renewed escalation would risk further infrastructure damage, production losses, port restrictions and restrictions on alternative export corridors.
The available evidence does not justify precise numerical probabilities for these outcomes. Nor does it establish a single reliable freight-rate multiplier across all vessel classes and international routes. Quantitative scenario analysis must therefore distinguish observed historical costs, conditional engineering calculations and genuinely forecast variables.
By 2030, the central question will not simply be whether Hormuz is open. It will be whether companies have redesigned their contractual commitments, procurement networks, inventories and transport architecture to operate under a geopolitical environment in which access to critical maritime infrastructure may again be contested. The competitive difference will arise from the ability to maintain production and fulfilment under disruption without permanently absorbing the cost of maximum redundancy.
Key Evidence Table — Verified Baseline
The following indicators establish the physical, energy-market and logistics baseline against which diplomatic progress and future scenarios should be assessed.
| Indicator | Verified value or status | Reference period | Issuer and source |
|---|---|---|---|
| Confirmed maritime incidents | 122 | 30 Oct 2026 | IMO, Confirmed Maritime Incidents |
| Confirmed seafarer fatalities | 24 | 30 Oct 2026 | IMO, same incident register |
| Hormuz petroleum-liquids flows | 21.6 million b/d | Q4 2025 | EIA, Global Energy Security Data |
| Hormuz petroleum-liquids flows | 4.9 million b/d | Q2 2026 | EIA, same dataset |
| Reduction in quarterly-average Hormuz flows | 77.3% | Q4 2025 to Q2 2026 | Calculated from EIA figures |
| Brent crude spot average | $114/barrel | Sep 2026 | EIA, October Energy Outlook |
| Forecast Brent spot average | $105/barrel | Q4 2026 | EIA, October 2026 forecast |
| Forecast Brent spot average | $84/barrel | Full-year 2027 | EIA, October 2026 forecast |
| Estimated Middle East crude production shut-ins | 4.5 million b/d | Q4 2026 forecast | EIA, October 2026 |
| Saudi East–West pipeline | Temporary disruption; partial resumption reported | Sep 2026 | EIA, October 2026 |
| Salalah yard density | 84% | 30 Oct 2026 | Hapag-Lloyd, Week 44 Operational Update |
| Salalah berthing delays | Up to 36 hours | 30 Oct 2026 | Hapag-Lloyd, same update |
| Jebel Ali vessel calls | Ad hoc operations | 30 Oct 2026 | Hapag-Lloyd, same update |
The distinction between observed data and forecasts is essential. The EIA’s October forecast was completed on 1 October and does not incorporate every subsequent security incident. Similarly, quarterly traffic averages cannot establish conditions during the final week of October. U.S. Energy Information Administration (EIA)+2
Historical contraction in Hormuz petroleum traffic
Strait of Hormuz — Petroleum Liquids Traffic
Quarterly average, million barrels per day. EIA figures based on tanker tracking and conversion methodology; not an October 2026 traffic measurement.
Competing Strategic Pathways
The three scenarios are alternative dominant operating conditions through mid-2027. They should not be interpreted as guaranteed outcomes or assigned numerical probabilities without a reproducible forecasting model.
| Scenario | Hormuz status | Typical transit-time impact | Freight-rate impact | Petrochemical availability | Principal continuity response |
|---|---|---|---|---|---|
| Rapid stabilisation | Progressive restoration subject to credible security arrangements | Route-specific delays progressively decline | Risk premiums gradually compress; no assured immediate return to baseline | Recovery depends on operating plants, inventories and export terminals | Restore selected direct services; retain contingency capacity |
| Prolonged disruption | Intermittent restrictions, selective passage and continuing incident risk | Variable delays, diversions and port-dependent congestion | Persistent volatility and exceptional risk-related charges | Uneven access to feedstocks and imported finished products | Dual sourcing, qualified substitutes, selective safety stocks, alternative ports |
| Renewed high-intensity escalation | Substantial restrictions and possible further infrastructure damage | Potentially severe and unpredictable; some movements commercially infeasible | Contract-specific increases, withdrawal of capacity and possible unavailability of cover | Severe exposure for commodities dependent on inaccessible Gulf facilities | Prequalified substitutes, production prioritisation, demand allocation and liquidity reserves |
These are directional scenario consequences, not measured percentage changes in freight rates. A universal numerical range would be misleading because crude tankers, LNG carriers, chemical tankers and container vessels operate under different commercial arrangements.
Current standing of the three pathways
Rapid stabilisation — Low-to-medium confidence
Diplomatic mediation and limited improvements in physical exports provide a route toward recovery. However, continuing maritime incidents and unresolved commercial security requirements prevent an assumption of imminent full normalisation. The pathway would strengthen if sustained traffic recovery coincided with falling incident frequency and the restoration of ordinary insurance conditions.
Prolonged disruption — Medium confidence; leading working scenario
This pathway is most consistent with the combination of constrained export capacity, partial alternative-route development, active maritime threats and ongoing carrier adjustments. It also corresponds to the EIA’s expectation that some regional production recovery will continue into 2027. U.S. Energy Information Administration (EIA)
Renewed high-intensity escalation — Material downside risk; probability not quantified
The geographic spread of missile and drone threats, vulnerability of energy bypass infrastructure and unresolved US–Iran confrontation make a further escalation plausible. The scale and duration of commercial consequences depend on the targets affected, the extent of infrastructure damage and the ability of shipping and energy operators to resume safe operations.
Principal Evidence Gaps and Strategic Watch Indicators
| Monitoring priority | Decisive observation | Why it matters |
|---|---|---|
| Hormuz traffic recovery | Rolling 7- and 30-day AIS-derived counts and cargo volumes, separated by vessel class | Distinguishes isolated movements from sustainable restoration |
| Maritime security | UKMTO incidents by location, attack mechanism, vessel class and outcome | Tests whether the physical risk environment is improving |
| Insurance availability | War-risk quotations, exclusions, deductibles and cover availability for comparable voyages | Measures whether transit is commercially feasible |
| Energy-market balance | Brent and WTI settlements, regional grades, refining margins, inventories and shut-in volumes | Separates supply constraints from financial-market risk premiums |
| Bypass infrastructure | Actual throughput and availability of pipelines, export terminals and transshipment locations | Determines the effectiveness of alternatives to Hormuz |
| Container operations | Port dwell times, vessel omissions, yard density, blank sailings and equipment availability | Reveals secondary congestion and transport-network deterioration |
| Petrochemical markets | Feedstock availability, cracker operating rates, polymer spreads, export restrictions and delivery performance | Identifies industrial shortages before they appear in retail prices |
| Aviation and digital resilience | Airspace advisories, GNSS interference reports, validated service outages and system recovery times | Distinguishes security anomalies from verified operational disruption |
The most important unresolved quantitative gap is a consistent, independently reconcilable daily traffic series for October 2026, segmented by cargo and vessel type. Without it, neither a precise reopening percentage nor a reliable estimate of remaining transport capacity can be established.
Likewise, the primary-source record reviewed does not establish a comparable October series of global war-risk insurance premiums, a harmonised freight-rate series for all affected trade routes or confirmed coordinated attacks against regional AI data centres. Such uncertainties must remain distinct from the documented maritime and aerial incidents.
Preliminary Net Assessment
The strategic evidence points to a persistent divergence between the restoration of limited physical movements and the restoration of normal commercial conditions. The world’s energy and logistics systems can absorb some disruption through inventories, alternative production, longer shipping routes and infrastructure substitution. Their capacity to do so is neither unlimited nor costless.
The greatest medium-term exposure is concentrated in firms that combine geographically concentrated suppliers, constrained inventories, inflexible freight arrangements and limited visibility beyond their direct contractors. Conversely, companies with qualified substitute suppliers, contractually secured alternative transport, credible shipment data and sufficient working capital are better positioned to withstand intermittent restrictions without immediately interrupting production or distribution.
The decisive test for 2027 will be the simultaneous recovery of maritime safety, export volumes, insurance availability and operational reliability. An improvement in only one of these dimensions will not establish normalisation. Through 2030, the ability to preserve commercial continuity under uncertain access conditions will remain a fundamental measure of industrial and logistical resilience.
HORMUZ CRISIS MONITOR
An interactive strategic assessment of maritime-security incidents, petroleum export constraints, energy-price exposure and the consequences of three alternative geopolitical pathways through 2030. Historical observations, official forecasts and qualitative scenarios are explicitly distinguished.
Hormuz Petroleum Flows
Quarterly averages, million barrels per day. Select a chart point for its exact value.
Brent Oil Price Outlook
USD per barrel. Historical observation and EIA forecasts are different evidence categories.
* EIA forecasts published October 2026.
Three Strategic Pathways — 2027 to 2030
Select a pathway to change the operating assessment. Scenario effects are qualitative and conditional, not forecasts with invented numerical probabilities.
Selective passage continues, while isolated attacks, variable insurance access and secondary port congestion prevent normal operating reliability.
From Geopolitical Shock to Retail Inflation
Illustrative causal mechanism. Each link is conditional; not every energy-price change is fully passed through.
Physical Disruption
Attacks, terminal restrictions, route avoidance, constrained export capacity and interrupted vessel schedules.
Financial Transmission
Fuel surcharges, insurance conditions, spot-market exposure, inventory financing and delivery penalties.
Structural Adjustment
Supplier diversification, longer contract horizons, alternative corridors and more geographically distributed inventories.
Verified Evidence Matrix
| Indicator | Verified Status | Reference Period | Analytical Significance | Institution |
|---|---|---|---|---|
| Maritime incidents | 122 confirmed | 30 Oct 2026 | Continuing documented security exposure | IMO |
| Seafarer fatalities | 24 confirmed | 30 Oct 2026 | Human impact of maritime insecurity | IMO |
| Hormuz petroleum traffic | 21.6 million b/d | Q4 2025 | Pre-disruption comparative baseline | EIA |
| Hormuz petroleum traffic | 4.9 million b/d | Q2 2026 | Severe historical throughput contraction | EIA |
| Brent average | $114/barrel | Sep 2026 | Energy-cost pressure | EIA |
| Brent forecast | $84/barrel | 2027 annual average | Conditional recovery assumption | EIA |
| Regional production shut-ins | 4.5 million b/d | Q4 2026 forecast | Expected constrained supply | EIA |
| Salalah yard density | 84% | 30 Oct 2026 | Terminal congestion exposure | Hapag-Lloyd |
| Salalah berthing delay | Up to 36 hours | 30 Oct 2026 | Schedule reliability constraint | Hapag-Lloyd |
| Jebel Ali vessel calls | AD HOC | 30 Oct 2026 | Non-standard operating patterns | Hapag-Lloyd |
Indicators That Can Change the Assessment
These are monitoring requirements, not live feeds.
01 — Verified Vessel Movements
Rolling 7- and 30-day tanker, LNG and container movements, corroborated against port and terminal records.
02 — Maritime Threat Frequency
UKMTO advisories, confirmed projectile strikes, mine-related incidents and geographic concentration.
03 — Commercial Insurance Conditions
War-risk cover availability, exclusions, quotations, deductibles and vessel-specific restrictions.
04 — Energy and Petrochemical Supply
Crude settlements, export throughput, feedstock availability, cracker operating rates and polymer spreads.
05 — Logistics Network Performance
Port congestion, vessel omissions, equipment repositioning, transit-time variability and inland transport capacity.
06 — Hybrid Infrastructure Security
Validated GNSS interference, airspace notices, confirmed digital-service outages and recovery performance.
PILLAR I — GEOPOLITICAL ESCALATION, MARITIME SECURITY AND STRATEGIC ACCESS
Chapter 1. The US–Iran Confrontation and the Security Architecture of the Persian Gulf
OPEN-SOURCE STRATEGIC INTELLIGENCE ASSESSMENT | 31 OCTOBER 2026 | FORECAST HORIZON 2027–2030
Strategic Judgment: The Persian Gulf Has Become a Contested System of Regional Security, Maritime Access and Economic Coercion
The confrontation between the United States and the Islamic Republic of Iran has developed into a regional security crisis in which the distinction between military escalation, diplomatic negotiation, commercial maritime access and the stability of the international energy system has become increasingly difficult to sustain. The principal strategic problem is no longer confined to whether Washington and Tehran can negotiate an interruption of direct hostilities. It concerns whether any negotiated settlement can establish a sufficiently durable regional security arrangement to protect international navigation, constrain attacks against civilian and strategic infrastructure, restore commercially viable energy exports and prevent renewed military confrontation from spreading through the interconnected maritime corridors of the Persian Gulf, Gulf of Oman, Arabian Sea and Red Sea. By the end of October 2026, the available institutional record indicates that diplomatic agreements and repeated de-escalation initiatives have not yet produced the level of operational stability required for a dependable restoration of regional maritime commerce. The conflict must therefore be understood as a simultaneous contest over military deterrence, freedom of navigation, the economic costs of coercion, the strategic autonomy of Gulf states and the credibility of international security commitments.
The central assessment is that a negotiated reduction in hostilities remains possible, but a durable settlement requires more than a bilateral ceasefire between Washington and Tehran. Iran’s capacity to impose costs on maritime navigation, the exposure of Gulf energy and transport infrastructure, the involvement of regional armed actors and the interests of states that depend on uninterrupted hydrocarbon exports create a security environment in which an agreement can be formally operative while substantial commercial and military risks continue. This distinction is demonstrated by the sequence of developments documented in 2026. The United States formally notified the United Nations Security Council that it commenced combat operations against Iran on 28 February, invoking self-defence under Article 51 of the UN Charter. A ceasefire and reopening framework was subsequently announced in June, but renewed confrontations occurred during the following weeks. By July, the United Nations was again calling for an end to attacks against vessels, neighbouring states and Iranian targets. The continued registration of attacks against commercial ships into October demonstrates that the restoration of political dialogue has not, by itself, removed the physical threat to maritime operations. Letter dated 10 March 2026 from the Permanent Representative of the United States to the United Nations — United Nations Security Council — March 2026; Statement on the Conflict in the Middle East — United Nations Secretary-General — June 2026; Statement on the Middle East — United Nations Secretary-General — July 2026.
The available evidence supports three distinct conclusions. First, the confrontation has crossed the threshold from a diplomatic dispute reinforced by sanctions and military signalling into direct interstate hostilities involving attacks, counterattacks and contested maritime access. Second, the crisis has become geographically distributed: military threats are not limited to the narrowest portion of the Strait of Hormuz, and the protection of alternative energy export infrastructure can no longer be treated as independent of the wider regional confrontation. Third, the international consequences arise not only from the destruction of physical assets but also from the inability of companies and governments to predict whether access, insurance, transport capacity and energy deliveries will remain available across consecutive operating periods. The resulting uncertainty creates an economic mechanism through which relatively limited or intermittent military action can impose costs considerably beyond the immediate location of an attack.
For governments and multinational enterprises, the most important implication is that the Persian Gulf can no longer be assessed solely as an energy-production region protected by established bilateral security partnerships. It constitutes a strategic network whose vulnerabilities connect maritime geography, air defence, energy terminals, pipelines, sovereign policy choices, external military deployments and international financial markets. Restoring the network requires credible arrangements across several of these domains. Progress in one area may remain economically insufficient if insecurity persists in another.
The Evolution of Hostilities: From Direct Military Confrontation to an Unstable Negotiated Framework
February–March 2026: Direct hostilities and the formal American strategic position
The documented opening of the 2026 phase of direct military confrontation occurred on 28 February, when the United States commenced combat operations against Iran in cooperation with Israel. In its diplomatic communication dated 10 March and distributed as Security Council document S/2026/161, Washington stated that the operations were intended to defend American personnel and interests against Iranian threats, protect regional allies and partners, and preserve maritime commerce through the Strait of Hormuz. The United States presented its action as an exercise of the inherent right of self-defence reflected in Article 51 of the UN Charter. This declaration provides an authoritative record of the American government’s stated legal and strategic rationale. It does not, by itself, establish international agreement that every operation met the legal requirements of necessity, proportionality or attribution applicable to self-defence. Those questions require separate examination of the underlying attacks, the military measures undertaken and the applicable international legal framework. Letter dated 10 March 2026 from the Permanent Representative of the United States of America to the United Nations, S/2026/161 — United Nations Security Council — March 2026.
The strategic importance of this notification extends beyond its formal legal character. By explicitly linking military operations to the protection of maritime commerce and allied security, Washington connected its confrontation with Iran to the international economic system and to the credibility of American regional security commitments. The United States therefore confronted a problem involving several overlapping objectives: limiting threats from Iranian military capabilities, protecting American forces and regional partners, maintaining the credibility of deterrence, preventing a sustained interruption of strategic maritime access and preserving the possibility of a diplomatic settlement that would not be interpreted as acceptance of coercive restrictions on navigation. These objectives are not necessarily mutually reinforcing. Military operations intended to degrade Iran’s ability to threaten shipping can create incentives for further attacks against maritime targets or regional infrastructure, particularly if Tehran concludes that its conventional military position is deteriorating and that the economic consequences of continued confrontation represent one of its remaining sources of leverage.
For Iran, the confrontation creates a different but equally complex strategic calculation. The Iranian government must weigh the preservation of its military and political decision-making capacity, the economic consequences of restrictions on exports, the credibility of deterrence against further attacks and the diplomatic value of retaining the ability to threaten economically significant infrastructure. The geography of the Gulf offers a potentially asymmetric means of increasing the costs of confrontation for adversaries whose economies and security interests extend far beyond the region. Yet the same geography exposes Iran to substantial risks. Restrictions that disrupt regional energy flows can also damage Iran’s own commercial relationships, reduce export opportunities, increase pressure from neighbouring governments and encourage additional military cooperation between Gulf states and external security providers. Consequently, maritime coercion may strengthen Iran’s short-term bargaining position under some circumstances while weakening the prospects for a stable regional settlement if neighbouring states interpret the threat as a permanent feature of Iranian security policy.
These competing calculations create a deterrence problem rather than a simple bilateral contest of military strength. The United States may possess the ability to conduct extensive conventional operations without being able to guarantee uninterrupted commercial passage. Iran may retain the capacity to threaten shipping or infrastructure without being able to impose a complete and sustainable closure of the regional maritime network. The distinction between conventional military superiority and control over commercial risk is essential: international shipping operators make decisions according to the probability and consequences of loss, the availability of insurance and the economic viability of voyages, not merely according to the balance of military forces. A maritime corridor can therefore remain commercially impaired even when one belligerent lacks the ability to prevent every vessel from passing through it.
June 2026: The announcement of a ceasefire and the limits of formal commitments
The diplomatic sequence changed significantly on 14 June, when the United Nations Secretary-General welcomed an announced peace agreement between the United States and Iran providing for an immediate and permanent ceasefire, reopening of the Strait of Hormuz and a framework for further negotiations. The UN statement acknowledged the contributions of Pakistan, Qatar, Egypt, Saudi Arabia, Türkiye and other regional actors. The announcement demonstrated that the parties and mediators had identified a possible diplomatic framework linking the cessation of direct hostilities with restoration of maritime access. However, the language of a permanent ceasefire must be distinguished from evidence that the ceasefire was continuously observed, that every relevant armed actor accepted its terms, or that safe passage had become commercially reliable. The subsequent record demonstrates why these distinctions matter. Statement on the Conflict in the Middle East — United Nations Secretary-General — 14 June 2026.
The announced settlement was followed by further diplomatic activity associated with the 17 June memorandum of understanding and mediation efforts conducted in Doha under Qatar’s auspices. In its briefing to the Security Council on 2 July, the United Nations described renewed military confrontations during the preceding weekend despite continuing negotiations, while welcoming a joint decision to de-escalate and exercise restraint. The significance of this sequence lies in the coexistence of formal diplomatic progress and continuing military incidents. It indicates that an agreement can create a negotiating framework without resolving the underlying incentives or operational uncertainties that make renewed escalation possible. For negotiators, the problem is not merely obtaining another declaration of restraint. It is establishing whether the obligations are sufficiently precise, whether conduct can be observed and attributed, whether violations trigger agreed responses and whether commercial actors have reason to expect that arrangements will remain effective beyond the immediate diplomatic interval. UN Calls for Maximum Restraint to Preserve Ceasefire between the United States and Iran — United Nations Department of Political and Peacebuilding Affairs — 2 July 2026.
A diplomatic settlement addressing a narrow set of bilateral military questions may be insufficient if it leaves unresolved the status of commercial vessels, the conditions for transit, restrictions on particular cargoes, the treatment of vessels connected to sanctioned counterparties, and the operational authority of maritime and military forces operating near international navigation routes. A framework that permits the resumption of selected movements without transparent and consistently applied conditions could produce partial recovery while retaining significant uncertainty for shipowners and charterers. Similarly, an understanding that reduces direct American-Iranian attacks but does not materially reduce attacks by other armed actors against regional infrastructure would leave Gulf governments exposed to security risks originating outside the immediate bilateral negotiating structure.
July 2026: Renewed confrontation and the erosion of ceasefire credibility
The fragility of the June framework became more evident during July. On 8 July, the United Nations Secretary-General expressed concern that renewed military confrontations in the Gulf could undermine diplomatic progress between Iran and the United States. The UN urged restraint and emphasised protection of civilians, civilian infrastructure and navigational rights. On 12 July, the Secretary-General identified attacks by Iran against vessels in Hormuz, American attacks against Iran and Iranian attacks against targets in neighbouring countries as dimensions of the renewed escalation. On 15 July, the organisation again called for full restoration of navigational rights and freedoms around the Strait. This sequence shows that the principal obstacle was no longer simply the absence of diplomatic dialogue. It was the inability of existing understandings to prevent renewed military action and the extension of that action into geographically and economically sensitive areas. Note to Correspondents on the Renewed Military Confrontations in the Gulf — United Nations Secretary-General — 8 July 2026; Statement on the Middle East — United Nations Secretary-General — 12 July 2026; Note to Correspondents: Iran and the Gulf — United Nations Secretary-General — 15 July 2026.
The diplomatic implications are substantial. An agreement whose implementation is repeatedly interrupted by attacks becomes less effective as a mechanism for reducing uncertainty, even if the governments involved continue to support negotiations in principle. Commercial actors respond to the observed reliability of commitments rather than their declared permanence. Gulf governments likewise have limited incentive to treat a ceasefire as a durable security arrangement if their cities, export facilities and maritime approaches remain vulnerable. For the United States, a settlement that does not restore practical freedom of navigation risks weakening one of the objectives explicitly identified in its March communication to the Security Council. For Iran, continued attacks may preserve bargaining pressure but can also make it more difficult to obtain the economic and political benefits associated with de-escalation.
September–October 2026: The widening gap between diplomatic progress and operational security
By September, the regional conflict had developed a further strategic dimension through attacks affecting alternative export infrastructure. The United States Energy Information Administration reported that Saudi Arabia’s East–West oil pipeline, which had been carrying more than 5 million barrels per day toward the Red Sea before the relevant attacks, experienced a temporary interruption. The EIA associated this disruption with a pronounced increase in international oil prices, including a Brent daily spot price of $131 per barrel on 15 September. The agency subsequently reported that pipeline operations had partly resumed by 22 September, while exports and production continued to face constraints. This sequence provides a concrete illustration of the geographical extension of the crisis: infrastructure designed to reduce dependence on Hormuz can itself become exposed to military threats, so the strategic value of a bypass route depends on the security of its entire operating chain rather than simply the existence of an alternative pipeline or terminal. Global Oil Markets, Short-Term Energy Outlook — U.S. Energy Information Administration — 6 October 2026.
The international maritime record remained adverse into October. The International Maritime Organization’s confirmed incident register reached 122 attacks or maritime incidents by 30 October 2026, and its detailed records identify repeated damage to commercial vessels throughout the month. The register includes incidents involving vessels in the Strait of Hormuz and in surrounding waters, demonstrating that maritime insecurity was geographically distributed rather than confined to one point in the navigational channel. These verified incidents do not establish that every case involved the same weapon, command structure or perpetrator. They do establish that the risk environment relevant to commercial shipping had not returned to normal conditions. Middle East — Highlighted Confirmed Maritime Incidents — International Maritime Organization — 30 October 2026.
Documented sequence of strategic developments
| Date | Event or institutional record | Verified significance | Strategic interpretation |
|---|---|---|---|
| 28 February 2026 | United States commenced combat operations against Iran, according to its subsequent UN notification | Direct interstate military confrontation | Maritime security became an explicit objective of American military operations |
| 10 March 2026 | United States notified the Security Council under Article 51 | Formal statement of American legal and strategic justification | Demonstrates Washington’s stated self-defence rationale, not independent judicial validation |
| 14 June 2026 | Ceasefire, Hormuz reopening and further negotiations announced | Formal diplomatic settlement framework | Established a potential pathway toward de-escalation |
| 17 June 2026 | Memorandum of understanding subsequently referenced in UN mediation reporting | Framework for continuing implementation negotiations | Created a diplomatic process requiring compliance and verification |
| Late June–early July 2026 | Renewed confrontations despite mediation | Fragility of ceasefire implementation | Diplomatic commitments had not eliminated military incentives |
| 12 July 2026 | UN identified renewed attacks involving Iran, the United States, neighbouring states and shipping | Conflict affected several geographical and operational domains | Bilateral negotiations alone could not resolve every regional security exposure |
| September 2026 | Saudi East–West pipeline disrupted; partial resumption subsequently reported | Alternative export infrastructure proved vulnerable | Bypass capacity cannot be equated with secure export capacity |
| 30 October 2026 | IMO confirmed incident register reached 122 | Persistent documented danger to commercial navigation | Military and commercial normalisation remained distinct |
Sources: United States Letter S/2026/161 — United Nations — March 2026; Ceasefire Announcement — United Nations — June 2026; UN Security Council Briefing — July 2026; EIA Global Oil Markets — October 2026; IMO Confirmed Incidents — October 2026.
American Strategic Objectives: Deterrence, Maritime Access and the Credibility of Regional Security Guarantees
The United States faces a fundamental strategic dilemma in the Persian Gulf: it must preserve freedom of navigation and protect its regional partners without allowing the protection of maritime commerce to become an open-ended requirement for repeated military escalation. The American position is shaped by several mutually connected considerations. The Gulf remains critical to the functioning of international energy markets even when American domestic petroleum production reduces the country’s direct dependence on imported regional crude. American economic exposure is transmitted through international oil benchmarks, petroleum-product prices, financial markets, allied energy security and the operating costs of globally integrated businesses. Consequently, disruption of Gulf exports can affect the United States even where the lost physical cargoes were originally destined for Asian refineries or other international purchasers. The defence of navigational access therefore functions simultaneously as an economic-security objective, a demonstration of military credibility and a mechanism for sustaining the confidence of regional partners whose infrastructure and commercial interests depend upon external security arrangements.
The American strategic problem is especially difficult because military deterrence and maritime reassurance are not identical objectives. Deterrence seeks to convince an adversary that hostile action will generate unacceptable consequences. Maritime reassurance requires convincing commercial shipowners, insurers, operators and governments that an international corridor can be used repeatedly without unacceptable risk. Military retaliation may contribute to deterrence, but it cannot guarantee reassurance if the subsequent threat environment becomes more unpredictable. The difference matters particularly in a region where attacks can involve relatively inexpensive unmanned systems, missiles, mines or other weapons directed against high-value infrastructure and commercial assets. The financial consequences of a successful strike need not be proportional to the military cost of the operation. A damaged vessel, temporary terminal shutdown or interruption to a strategically important pipeline can generate secondary costs through heightened insurance requirements, emergency procurement, altered shipping schedules and precautionary reductions in commercial activity.
The United States must also distinguish between its objectives concerning Iran itself and its responsibilities toward neighbouring states. Operations undertaken to degrade Iranian military capabilities do not automatically provide long-term protection to Saudi Arabian cities, Gulf energy installations, commercial airports, maritime terminals and other critical infrastructure. Regional protection requires persistent surveillance, early warning, air and missile defence, intelligence cooperation, logistics and arrangements for responding to threats that may originate from actors other than Iran’s regular armed forces. The operational burden of such arrangements can increase even when direct US–Iran hostilities decline, particularly where the confrontation has stimulated attacks from other parts of the regional security environment. The United Kingdom’s decision in October 2026 to strengthen defensive support to Saudi Arabia illustrates this wider requirement. The British Ministry of Defence announced the use of RAF Typhoon aircraft for defensive counter-air missions, an A400M aircraft to support defence logistics, advisers for Saudi staff officers and continued support for air-defence operations. London explicitly linked the deterioration of regional security to the protection of Saudi infrastructure and to the economic consequences for British businesses. Operational Update: UK Military Support to the Kingdom of Saudi Arabia — UK Ministry of Defence — 20 October 2026.
This development is important because it demonstrates that Gulf security is not determined exclusively by American and Iranian decisions. Other governments retain separate national interests, defence commitments, domestic political constraints and operational capabilities. Their participation can strengthen regional protection by distributing responsibilities and expanding available defence resources. It can also complicate escalation management if different governments interpret threats, legal authorities or acceptable military responses differently. A regional security architecture therefore requires not simply the presence of military capabilities but arrangements for coordination, intelligence sharing, engagement authorities and political control. The existence of allied forces does not demonstrate that every participating state has accepted the same operational objectives or that all security guarantees are legally interchangeable.
The distinction between protecting international navigation and enforcing restrictions against particular Iranian commercial activities introduces an additional policy difficulty. An economic strategy involving sanctions, restrictions on Iranian exports or interdiction measures can create friction with a broader policy objective of keeping internationally used maritime routes commercially accessible. The two objectives can coexist legally and operationally under carefully defined conditions, but their implementation creates different risks for neutral shipping, shipowners, cargo interests and coastal states. A strategy that reduces Iran’s economic capacity while simultaneously seeking maximum maritime openness requires clear distinctions between lawful sanctions enforcement, national military operations, recognised navigational rights and the protection of third-party commercial traffic. Without such distinctions, shipping companies may face uncertainty over which authorities control particular movements, whether vessels can be delayed or inspected and how compliance with one government’s requirements affects exposure to another state’s retaliatory measures.
American policy must ultimately reconcile the immediate utility of coercive pressure with the longer-term objective of preventing the Strait of Hormuz from becoming a recurring instrument of geopolitical leverage. A temporary military advantage that does not change the incentives supporting future maritime coercion would provide limited strategic resolution. Conversely, a diplomatic settlement that reduces military confrontation while preserving opaque restrictions or selective threats against shipping could generate formal stability without restoring commercial confidence. The more durable American objective is therefore not the demonstration of control over an isolated passage but the establishment of a regional environment in which interfering with legitimate commercial navigation ceases to offer a strategically attractive or economically effective bargaining instrument.
Iranian Strategic Objectives: Regime Security, Asymmetric Leverage and the Economics of Deterrence
Iran’s position in the confrontation is defined by an asymmetry between the conventional military capabilities available to the United States and the ability of Tehran to influence a geographically concentrated system of global economic infrastructure. The Strait of Hormuz provides a potential means of creating strategic costs that extend beyond the immediate military balance. Iran’s geographic proximity to shipping routes, coastal infrastructure and Gulf energy facilities creates opportunities to threaten maritime operations through several military instruments and to complicate the ability of external forces to guarantee uninterrupted transit. The value of this leverage does not depend on maintaining a perfectly enforced closure. It can arise through the threat of sporadic attacks sufficient to affect shipowners’ willingness to operate, the pricing of maritime insurance and the commercial decisions of charterers and cargo owners.
The distinction is central to understanding Iran’s bargaining position. A complete and sustained closure of the Strait would impose extensive economic costs on multiple regional states, including countries with which Tehran may wish to preserve diplomatic and commercial relationships. It would also reduce the availability of legitimate maritime outlets and could intensify pressure for international intervention. By contrast, selective interference or intermittent threats may allow Iran to demonstrate the capacity to impose economic costs while maintaining a degree of flexibility over the intensity of confrontation. This does not establish that every attack is directed or controlled by Tehran, nor that all acts of maritime violence form part of a unified strategy. It identifies a structural feature of the regional security environment: geographically concentrated infrastructure permits limited hostile activity to create consequences considerably larger than the immediate damage sustained.
Iran’s principal negotiating interests are likely to be shaped by the relationship among national security, economic recovery and the credibility of future guarantees. Restrictions on oil exports, damage to infrastructure and prolonged instability can increase the domestic costs of confrontation. At the same time, Tehran may assess that relinquishing coercive leverage without obtaining credible concessions would expose it to renewed external pressure. This creates an enforcement problem common to asymmetric negotiations: one side may demand verifiable limitations on activities that threaten commercial or military security, while the other seeks assurances that compliance will produce tangible and sufficiently durable benefits. Where the concessions are reversible at different speeds, agreement becomes more difficult. Restrictions can sometimes be restored rapidly, whereas repairing infrastructure, recovering foreign investment, restoring insurance relationships or rebuilding confidence in commercial contracts may require much longer.
The resulting bargaining structure makes sequencing important. A credible arrangement might require initial restraint, transparent procedures for restoring transit, corresponding measures affecting economic restrictions and an independent or mutually accepted method for assessing violations. However, these are analytical requirements for an effective mechanism, not evidence that the governments have already agreed to such provisions. The accessible diplomatic record establishes mediation, framework discussions and announcements of restraint; it does not justify reconstructing undisclosed clauses, verification procedures or enforcement commitments as though they had been formally adopted.
The Iranian position also has an important regional dimension. Continued maritime insecurity can impose costs on Arab Gulf states that are not direct parties to every aspect of the American-Iranian dispute. The greater those costs become, the stronger the incentive for affected governments to diversify their security relationships, increase defensive investments or pursue diplomatic arrangements designed to limit dependence on unpredictable escalation. These responses can produce contradictory effects for Tehran. They may encourage negotiated accommodation if Gulf governments conclude that regional stability requires direct engagement with Iran. They may instead encourage closer defence cooperation with the United States and European powers if neighbouring states regard maritime coercion and attacks against infrastructure as enduring threats. The strategic consequences therefore depend not only on the immediate military results of confrontation but also on how Iran’s conduct influences the preferences and long-term security choices of neighbouring governments.
The economic constraints are similarly important. Energy exports contribute to national revenues and foreign-exchange availability, while disruption can affect investment, infrastructure maintenance and the commercial relationships necessary for sustained production. The EIA’s September assessment described renewed American restrictions on Iranian oil exports and sanctions measures alongside continued instability affecting regional energy movements. These instruments can intensify pressure on Tehran, but their effectiveness should not be inferred solely from announced designations or restrictions. The relevant outcomes are realised export volumes, payment channels, shipping availability, counterparties’ compliance and the resulting impact on public revenues and economic activity. Global Oil Markets, September Short-Term Energy Outlook — U.S. Energy Information Administration — 9 September 2026.
The Gulf Monarchies and the Redistribution of Regional Security Responsibilities
The Gulf monarchies occupy a strategically distinct position because they are simultaneously exposed to Iranian and regional military threats, dependent on the commercial accessibility of surrounding waters and capable of influencing diplomatic arrangements through their economic relationships, infrastructure and international security partnerships. Their interests cannot be reduced to unconditional alignment with either Washington or Tehran. Saudi Arabia, the United Arab Emirates, Qatar, Bahrain, Kuwait and Oman possess different geographic exposures, economic structures and diplomatic responsibilities. The durability of any regional security settlement depends in part on whether these differences are accommodated rather than obscured by a generalised concept of collective Gulf security.
Saudi Arabia’s interests are particularly broad because of the international importance of its petroleum production, refining and export infrastructure and the geographical reach of its energy transport system. The kingdom has a powerful incentive to preserve predictable export access while preventing attacks against its cities and strategic facilities from becoming normal features of regional competition. The East–West pipeline demonstrates both the value and limits of geographic diversification. By enabling exports from the Red Sea, the corridor reduces the need for certain crude movements to pass through Hormuz. Yet its September interruption showed that a bypass can shift vulnerability rather than eliminate it. Effective diversification therefore requires protection of pumping infrastructure, storage, terminals, export routes and associated operating systems, not merely the construction of additional pipeline capacity.
The October British defence announcement provides further evidence of the extent to which Saudi security concerns involve both national infrastructure and civilian airspace. The Ministry of Defence specifically referred to Houthi attacks against civilian targets, including King Khalid International Airport, and identified defensive counter-air operations as an appropriate response. The presence of threats affecting airport infrastructure is consequential even where no comprehensive quantitative estimate of aviation disruption is available. Commercial aviation, air cargo and high-value logistics depend on predictable airspace access, insurance arrangements, operating schedules and the ability to maintain reliable links between regional distribution centres and international markets. Military defence measures can reduce exposure, but they do not independently prove that commercial operations have been restored to ordinary reliability. Operational Update: UK Military Support to the Kingdom of Saudi Arabia — UK Ministry of Defence — 20 October 2026.
The United Arab Emirates faces a related but differently configured strategic challenge. Its commercial role derives from an extensive system of ports, logistics facilities, transport connectivity and international business relationships. The Emirates have an interest in preventing regional conflict from undermining confidence in their function as global commercial and financial gateways. Their geographic position offers access to export and maritime infrastructure outside the Persian Gulf proper, but that geography does not eliminate exposure to attacks, regional airspace restrictions or disruption to the movement of goods between interconnected facilities. From a strategic perspective, the UAE’s priority is therefore to preserve both physical connectivity and the perception of predictable commercial governance. The EIA’s October outlook referred to additional UAE bypass pipeline capacity expected in 2027, an illustration of the longer-term investment response to constrained Gulf export routes. Such future capacity must nevertheless be distinguished from infrastructure already operational and commercially available. Global Oil Markets — U.S. Energy Information Administration — October 2026.
Qatar occupies a distinctive diplomatic position through its role in mediation between Iran and the United States. Its strategic importance is not limited to its energy exports. Qatar’s participation in negotiations provides a channel through which the parties can explore arrangements that would be more difficult to establish through direct coercion alone. The June ceasefire announcement and July United Nations briefing identify Qatar among the important regional participants in the diplomatic process, while the continuation of Doha discussions demonstrates that mediation remained operational despite renewed confrontation. The value of this role is particularly significant when direct trust between the principal belligerents is insufficient to sustain implementation. Mediators can facilitate communication, clarify proposed obligations and help preserve channels during periods of military escalation. They cannot, however, guarantee compliance unless the parties themselves accept arrangements that make compliance verifiable and non-compliance consequential. UN Calls for Maximum Restraint to Preserve Ceasefire between the United States and Iran — United Nations Department of Political and Peacebuilding Affairs — July 2026.
Oman’s position is defined by geography as well as diplomacy. Its coastline and proximity to the Strait of Hormuz make it indispensable to the practical operation of the regional maritime system. Oman and Iran were the states that proposed the traffic separation scheme adopted by the International Maritime Organization in 1968. This arrangement supplies an established navigational framework for vessel movements, but its existence does not guarantee protection from hostile action. Oman’s role therefore involves the intersection of coastal-state responsibilities, navigational safety, relations with neighbouring governments and the broader diplomatic requirement to prevent military confrontation from making an internationally used maritime passage commercially inaccessible. The IMO continues to identify the traffic separation scheme as part of the Strait’s formal shipping-route architecture. Middle East: Strait of Hormuz and Shipping — International Maritime Organization — October 2026.
Bahrain and Kuwait face particular exposure through the presence of important American military facilities and their geographical position within the Gulf. The July record identified attacks and defensive responses affecting both states, while the confrontation between the United States and Iran generated the possibility that host countries could experience military consequences arising from operations directed principally at another government. The Security Council’s July discussion referred to aerial threats against Bahrain and Kuwait and to the risk that attacks against military facilities could affect surrounding civilian areas. This creates a difficult problem for host governments: cooperation with external security providers may be essential to deterrence, but the presence of strategically important installations can also increase their exposure to retaliatory action. The Situation in the Middle East, Security Council 10189th Meeting — United Nations — 2 July 2026.
Comparative strategic interests of the principal Gulf actors
| Actor | Primary strategic interest | Principal exposure | Potential contribution to stability | Structural constraint |
|---|---|---|---|---|
| United States | Protection of forces, partners and international navigation | Escalation involving military installations and commercial routes | Deterrence, diplomacy, defensive coordination | Military superiority does not eliminate asymmetric maritime risk |
| Iran | Security, economic access and deterrent credibility | Military pressure, export constraints, damaged commercial relationships | Verified restraint and negotiated security commitments | Coercion can intensify regional opposition |
| Saudi Arabia | Export reliability, national infrastructure and territorial security | Energy infrastructure, aerial threats and strategic corridors | Regional diplomacy, infrastructure investment and security coordination | Alternative routes remain exposed to attack |
| United Arab Emirates | Commercial connectivity and economic predictability | Ports, aviation, logistics and energy corridors | Alternative export capacity, diplomacy and maritime logistics | Commercial confidence depends on regional conditions |
| Qatar | Security, energy continuity and diplomatic influence | Regional escalation and maritime transport dependencies | Mediation and communication channels | Limited ability to compel belligerent compliance |
| Oman | Safe navigation and stable relations with neighbours | Strait approaches and nearby maritime activity | Coastal-state cooperation and diplomatic facilitation | Navigation rules cannot alone prevent military attacks |
| Bahrain | Territorial security and protection of strategic installations | Host-country exposure during US–Iran confrontation | Defence coordination and diplomatic engagement | Concentration of sensitive military infrastructure |
| Kuwait | Territorial security and regional stability | Missile and drone threats, military and energy infrastructure | Defence cooperation and diplomatic engagement | Vulnerability to escalation crossing national boundaries |
The table identifies strategic interests and exposure mechanisms rather than quantifying national risk. Comparable numerical estimates would require harmonised country-level data on military incidents, infrastructure vulnerability, insured losses and economic dependence, which are not established by the material available for this chapter.
International Law, Freedom of Navigation and the Limits of Maritime Security Enforcement
The legal architecture of the Persian Gulf confrontation is important because competing military and economic objectives must be assessed against distinct bodies of international law rather than treated as interchangeable assertions of strategic necessity. The use of force between states is governed principally by the United Nations Charter and relevant customary international law, while navigation through international straits is addressed by the law of the sea. The protection of merchant shipping during armed conflict additionally raises questions under international humanitarian law, including the distinction between military objectives and civilian objects, proportionality and precautions in attack. Sanctions enforcement, port-state powers, flag-state jurisdiction and the interception or inspection of commercial vessels introduce further legal considerations. Although these regimes interact, a claim of self-defence does not automatically confer unlimited authority to restrict neutral commercial shipping, and the existence of a maritime-security threat does not suspend all navigational protections.
The United Nations Convention on the Law of the Sea establishes an important framework for international straits. Article 37 defines the geographical application of the transit-passage regime, while Article 38 provides for passage by ships and aircraft through qualifying straits used for international navigation. Article 39 imposes corresponding obligations on vessels and aircraft exercising transit passage, including proceeding without delay and respecting applicable navigational and safety requirements. Articles 42 and 44 address the legislative competence and obligations of states bordering straits, including the general requirement not to hamper transit passage. These provisions create a legal framework in which coastal-state authority exists alongside internationally recognised navigational rights. Their application to particular disputes must nevertheless account for treaty participation, applicable customary law and the actual circumstances of the movement concerned. United Nations Convention on the Law of the Sea, Part III, Articles 37–44 — United Nations.
The Strait of Hormuz is particularly sensitive because its physical geography makes maritime traffic dependent on a confined route close to the coastlines of Iran and Oman. The existing traffic separation scheme, adopted through the IMO framework in 1968 following a proposal by the two coastal states, provides navigational organisation intended to reduce collision risks. It is not, however, a demilitarisation agreement or a guarantee against hostile action. A traffic separation scheme can improve the orderly movement of vessels under ordinary circumstances, but it cannot independently resolve questions concerning missile threats, mines, military interception, insurance exclusions or the treatment of ships during armed conflict. Consequently, restoration of the internationally recognised routing arrangement cannot be equated with restoration of effective freedom of navigation. Middle East: Strait of Hormuz Shipping Route — International Maritime Organization — October 2026.
The IMO’s intervention during 2026 illustrates the distinction between a legal entitlement to navigate and the practical ability to do so safely. At its extraordinary Council session in March, the organisation called for a safe maritime framework designed to facilitate the evacuation of merchant vessels confined within the Gulf region. The framework was conceived as a provisional humanitarian measure requiring cooperation among governments and relevant maritime stakeholders. It did not purport to replace the underlying international law governing passage, nor did it grant the IMO authority to impose a military security arrangement on states unwilling to cooperate. The organisation’s effectiveness depended on the provision and continued reliability of practical safety assurances. Council, 36th Extraordinary Session — International Maritime Organization — March 2026.
The limitations became evident in June. The IMO reported that its evacuation operation had enabled 136 vessels, carrying an estimated 2,900 seafarers, to leave the affected area over the period 23–26 June, according to the organisation’s operational records. The daily totals were 14 vessels on 23 June, 41 on 24 June, 51 on 25 June and 30 on 26 June. These movements demonstrate that a coordinated framework could facilitate substantial vessel movements even in a contested operating environment. However, following an attack against a vessel in the Gulf of Oman, the organisation paused the evacuation mechanism because the necessary safety assurances required reassessment. The framework therefore provides a useful empirical example of both the potential value and the fragility of negotiated maritime-security arrangements. It also shows why the number of successfully completed voyages must be evaluated alongside the conditions under which those voyages occurred. Operational FAQs: IMO Strait of Hormuz Evacuation Plan — International Maritime Organization — June 2026; IMO Pauses Evacuation in Strait of Hormuz Following Attack — International Maritime Organization — 25 June 2026.
Verified IMO evacuation movements, June 2026
| Date | Vessels evacuated | Share of four-day total | Operational significance |
|---|---|---|---|
| 23 June | 14 | 10.3% | Initial movements under the coordinated framework |
| 24 June | 41 | 30.1% | Expansion of vessel evacuations |
| 25 June | 51 | 37.5% | Highest recorded daily total |
| 26 June | 30 | 22.1% | Further movements during the documented operating period |
| Total | 136 | 100.0% | Approximately 2,900 seafarers evacuated |
Source: Operational FAQs: IMO Strait of Hormuz Evacuation Plan — International Maritime Organization — June 2026. Percentages are calculated from the IMO’s daily vessel totals and rounded to one decimal place.
These movements also expose an important analytical distinction between humanitarian evacuation, commercially scheduled traffic and sustainable restoration of maritime access. The evacuation of stranded vessels under exceptional conditions demonstrates the possibility of coordinated movement but does not establish that commercial carriers can maintain normal sailing frequencies, that insurers will offer economically acceptable cover or that cargo owners can rely on ordinary delivery commitments. Such differences matter when assessing the legal and commercial consequences of negotiating a phased reopening: the capacity to authorise or facilitate passage represents only one requirement within the wider system necessary for uninterrupted international trade.
A durable maritime settlement would require the parties to distinguish military restraint from navigational administration. Military restraint concerns the termination of attacks and threatening behaviour. Navigational administration concerns route organisation, notification procedures, vessel identification, coastal-state responsibilities, emergency assistance and communication. Commercial recovery concerns insurance, shipowner confidence and contractual feasibility. Failure to address these separately creates a risk that political negotiators declare success on the basis of formal access while the shipping industry continues to treat the corridor as an exceptional-risk environment.
Diplomatic Mediation and the Conditions for an Enforceable Regional Settlement
The diplomatic involvement of Qatar, Pakistan, Oman, Saudi Arabia, Egypt and Türkiye demonstrates the importance of regional and external actors capable of maintaining communication across competing strategic interests. Mediation has particular value when direct exchanges between belligerents are politically sensitive or vulnerable to sudden military incidents. It can enable the presentation of proposals, clarification of demands, sequencing of obligations and the preservation of channels during periods when public rhetoric would otherwise make negotiations difficult. However, effective mediation requires more than the willingness of intermediaries to convene meetings. It depends on whether the principal parties can define commitments that are sufficiently specific to monitor and sufficiently valuable to maintain.
The June agreement and subsequent Doha discussions illustrate the practical problem. A ceasefire framework can provide a starting point for negotiations while leaving unresolved the scope of prohibited operations, treatment of attacks by associated armed groups, responsibilities for maritime incidents and procedures for responding to allegations of non-compliance. A vessel attack can create immediate pressure for retaliation before independent investigators have established the precise circumstances. If the parties disagree about whether an incident constitutes a violation, a single event can destabilise a broader agreement. The detailed record of renewed confrontations at the end of June provides evidence of precisely this difficulty: the United States and Iran attributed violations to one another while military activity resumed, creating a gap between the existence of a memorandum and the effectiveness of its implementation. The Situation in the Middle East, Security Council 10189th Meeting — United Nations — 2 July 2026.
An enforceable settlement would therefore need to address several separate functions. The parties would have to define which military actions are prohibited, how incidents involving unidentified aircraft or vessels are investigated, whether commercial movements can proceed without discriminatory interference and which authorities are responsible for providing operational assurances. An arrangement would also have to clarify how third-state interests are protected and whether the commitments apply to maritime infrastructure beyond the narrowest portion of Hormuz. Importantly, these requirements should not be confused with verified treaty provisions. The publicly examined record does not establish that a comprehensive monitoring system incorporating all these functions has already been negotiated or accepted.
The issue of attribution deserves particular attention. In a region involving national armed forces, maritime-security organisations and multiple armed non-state actors, identifying the origin of an attack does not automatically establish the legal responsibility of a particular state. Technical evidence regarding weapon characteristics, launch locations or operational patterns may support an assessment, but stronger conclusions concerning state responsibility require appropriately supported evidence of conduct, direction, control or other recognised grounds of attribution. Diplomacy becomes especially fragile when military responses are undertaken before the necessary evidentiary distinctions have been resolved. An effective incident mechanism would therefore need to provide credible procedures for preserving evidence and reducing the danger that disputed attribution produces additional escalation.
The economic dimension of implementation is equally significant. A settlement that provides some degree of military security without improving the commercial viability of transit may fail to produce the expected economic benefits. Maritime insurers and vessel operators have independent responsibilities to evaluate risk, while port and terminal operators must assess whether their facilities and personnel can operate safely. Their decisions are not automatically controlled by diplomatic declarations. In practice, commercial confidence can lag behind political de-escalation, especially when previous agreements have been followed by renewed attacks. Conversely, a documented series of uneventful transits, improved maritime advisories and restoration of ordinary insurance conditions can strengthen confidence in an agreement even before broader political disagreements have been resolved.
Settlement architecture: requirements, verification and structural limitations
| Settlement component | Required operational function | Evidence of effectiveness | Principal limitation |
|---|---|---|---|
| Bilateral cessation of attacks | Reduce direct US–Iran military confrontation | Sustained absence of documented direct attacks | Does not necessarily restrain other armed actors |
| Commercial maritime protection | Prevent attacks against merchant vessels | Verified reduction in incidents and commercially viable voyages | Safety guarantees may be geographically or temporally limited |
| Incident attribution | Establish responsibility for alleged violations | Credible investigations supported by technical evidence | Delays or disputed findings can undermine compliance |
| Coastal-state coordination | Maintain predictable navigational arrangements | Consistent procedures and functioning maritime communications | Does not replace military threat reduction |
| Infrastructure protection | Secure terminals, pipelines and essential facilities | Sustained operations without hostile interruptions | Large geographic area and multiple potential threat sources |
| Diplomatic implementation | Resolve disputes before renewed escalation | Continuing negotiations and documented corrective measures | Requires sustained political willingness |
| Commercial normalisation | Restore reliable shipping and insurance conditions | Stable voyages, insurance availability and predictable port operations | Commercial confidence may recover more slowly than diplomatic relations |
These requirements represent an analytical framework for evaluating a future settlement, rather than an assertion that they are all contained within existing agreements.
External Security Powers and the Emerging Burden of Regional Protection
The Gulf security environment is also shaped by the interests of powers whose economic exposure exceeds their geographical proximity to the crisis. European states, Asian importers and other international trading partners have incentives to support maritime stability, but they do not possess identical military capabilities, legal authorities or tolerance for involvement in regional confrontation. The result is a security system in which reliance on American capabilities coexists with efforts by other governments to protect their own commercial interests, maintain diplomatic relationships with Gulf states and avoid becoming directly involved in an escalating interstate conflict.
The United Kingdom provides a documented example of this combination of objectives. Its October decision to reinforce Saudi Arabia’s defensive capabilities was linked to the protection of civilian areas and strategic infrastructure, while its public statements also emphasised the consequences of regional instability for British businesses and energy costs. This approach illustrates how a European power can support Gulf security through defensive military measures without necessarily adopting an identical operational posture toward every dimension of the American-Iranian confrontation. The distinction matters because defensive air operations, maritime escort, sanctions enforcement and offensive strikes involve different authorities, responsibilities and escalation risks. Treating them as elements of a single undifferentiated intervention would obscure material differences in the obligations and political choices of participating governments. Operational Update: UK Military Support to the Kingdom of Saudi Arabia — UK Ministry of Defence — October 2026.
For the European Union collectively, the strategic exposure extends through the international energy-pricing system, industrial import dependencies and the reliability of maritime routes connecting Europe with the Gulf and Asia. Yet the Union does not constitute a single military actor with uniform national interests. Italy’s geographic position in the Mediterranean makes changes in maritime routing particularly relevant to its ports and industrial connections. France combines Mediterranean and Gulf security interests with national defence capabilities and internationally significant energy and industrial companies. Germany’s exposure is strongly associated with the functioning of manufacturing supply chains and international energy markets, while the United Kingdom maintains separate defence, maritime and diplomatic responsibilities outside the EU institutional framework. These differences influence how governments distribute the costs of regional instability and which interventions they regard as legitimate, necessary or proportionate.
Asian economies introduce another dimension because much of the international petroleum and LNG trade associated with the Gulf serves customers in Asia. China, India, Japan and South Korea have strong commercial incentives to preserve predictable energy flows, but their relationships with Washington, Tehran and Gulf governments differ. Their potential contribution to stabilisation therefore cannot be inferred from energy dependence alone. Importing states may favour diplomatic restraint and commercial continuity while opposing measures that threaten their own supply arrangements or expose vessels to additional military risk. Conversely, prolonged disruption can encourage greater diversification of energy sourcing and investment in alternative infrastructure, reducing some future dependencies while increasing the cost of adjustment during the transition.
The strategic consequence is that a durable regional settlement requires an arrangement sufficiently compatible with the interests of several categories of actors: belligerent states seeking security, Gulf governments seeking protection from regional spillover, commercial operators requiring predictable access and external powers concerned with international energy markets. The incentives are overlapping but not identical. This makes a purely bilateral security agreement potentially necessary but insufficient for comprehensive stability.
The Political Economy of Escalation: Why Limited Military Incidents Can Produce Disproportionate International Consequences
The international economic effects of Gulf insecurity emerge through a concentration of critical infrastructure and market dependencies rather than through the immediate physical losses alone. A single attack can affect a vessel or installation directly, but its wider significance depends on the extent to which it changes expectations about subsequent attacks, available transport capacity and the reliability of critical infrastructure. Where many market participants depend on the same geographic corridor, individual decisions to delay voyages, change routes or increase precautionary inventories can amplify the aggregate effects of an initial security incident.
The September disruption of Saudi Arabia’s East–West pipeline provides a particularly useful example because it demonstrates that the market consequences of military action depend on the strategic function of the affected asset. The pipeline served as a major alternative to exports through Hormuz. Its temporary interruption therefore weakened a mechanism that had been mitigating earlier constraints on Gulf maritime traffic. According to the EIA, the disruption was accompanied by a sharp increase in Brent prices and contributed to heightened concern over near-term oil availability. Its significance was not limited to the barrels directly interrupted; it altered the perceived reliability of a route that had become strategically important precisely because another export corridor was under pressure. Global Oil Markets, Short-Term Energy Outlook — U.S. Energy Information Administration — October 2026.
The same mechanism applies, with different operational characteristics, to commercial ports, airports, industrial utilities and digital infrastructure. The probability of disruption interacts with the availability of alternatives. Where substitutes are plentiful and immediately accessible, a localised incident may be absorbed without wider consequences. Where alternatives are constrained or subject to correlated security threats, the cost of a disruption can rise substantially. Governments and businesses therefore need to distinguish nominal infrastructure capacity from reliably usable infrastructure capacity. A pipeline’s rated throughput does not establish that its pumping stations, terminals, electrical supply and maritime connections can function under hostile conditions. An airport’s physical capacity does not establish uninterrupted access to safe airspace. A port’s nominal annual container capacity does not establish its ability to absorb additional diversion traffic without congestion.
This interaction produces a broader financial consequence. Once markets begin to incorporate geopolitical risk into decisions concerning inventories, insurance, financing and contractual delivery obligations, the economic costs of insecurity can persist after the immediate military situation improves. Companies may be reluctant to abandon alternative suppliers or transport arrangements until sufficient evidence demonstrates that normal operations are sustainable. Shipowners may demand additional compensation for exposure to exceptional risk. Financial institutions may reassess credit arrangements for businesses dependent on particular routes or counterparties. The resulting adjustments can reduce vulnerability over time, but they can also increase costs for enterprises whose business models were optimised for predictable and relatively inexpensive international logistics.
At the level of state policy, these effects create competing incentives. Rising international energy prices can impose costs on importing economies while generating additional revenues for exporters able to maintain shipments. Yet exporters whose physical volumes are constrained may be unable to benefit fully from higher benchmark prices. Similarly, measures that increase the cost of maritime disruption can strengthen pressure for diplomatic agreement, but they can also increase the perceived value of retaining coercive capabilities. The resulting balance cannot be reduced to a simple proposition that economic pain automatically produces compromise. The consequences depend on the distribution of losses, the domestic political resilience of the parties and the credibility of the concessions available through negotiation.
The Security Architecture to 2030: Deterrence Alone Will Not Deliver a Durable Settlement
The evolution of Gulf security through 2030 will depend on whether the governments involved can transform a fragile cessation of hostilities into arrangements that change the incentives for renewed attacks. A system based exclusively on the threat of retaliation may prevent some actions, but it remains vulnerable to miscalculation, disputed attribution and the ability of lower-cost systems to threaten high-value assets. A system based exclusively on diplomatic declarations may reduce political tension without establishing practical guarantees for international commerce. A more durable arrangement would combine restraint, reliable communication, maritime-security cooperation, protection of essential infrastructure and mechanisms capable of addressing violations before they lead to renewed escalation.
The first structural requirement is a credible distinction between the protection of legitimate commercial navigation and the pursuit of other military or economic objectives. When these functions are conflated, maritime commerce risks becoming both a strategic instrument and a target of retaliation. The second is the participation or practical accommodation of Gulf states whose territories and infrastructure are directly exposed to the consequences of confrontation. A bilateral agreement that excludes their security concerns may leave important causes of regional instability unresolved. The third is the recognition that maritime access is not confined to the legal status of the Strait: commercial traffic depends on the operational reliability of ports, vessels, crews, associated infrastructure and supporting services throughout the wider region.
A fourth requirement concerns crisis communication and the management of incidents involving actors whose command relationships and strategic objectives may not be identical. The involvement of multiple armed groups and states creates risks of escalation even when Washington and Tehran have decided to reduce direct confrontation. A credible framework would therefore need to limit the ability of isolated or ambiguously attributed incidents to produce uncontrolled military responses, while preserving the rights and responsibilities of affected states under international law. This requirement becomes more important where defensive operations, maritime-security activity and military actions against regional armed groups occur simultaneously.
A fifth requirement is commercial verification. Political progress must eventually produce a measurable change in the behaviour of shipowners, insurers and infrastructure operators. A durable settlement should permit normal commercial decisions without dependence on exceptional military assurances for every voyage. The persistence of restricted operations or extraordinary insurance conditions would indicate that the security architecture remains incomplete even if the principal governments describe diplomatic negotiations as successful.
The practical challenge lies in the distribution of costs and commitments. The United States and its partners may be willing to provide certain defensive capabilities, but the maintenance of extensive military protection can involve substantial recurring costs. Gulf governments may invest in alternative infrastructure and defensive systems, but those investments do not remove the need for regional diplomatic stability. Iran may seek economic benefits from negotiation, but these benefits require credible and durable changes in external restrictions and commercial behaviour. Each participant must therefore assess not only the immediate outcome of an agreement but also the long-term distribution of vulnerability, financial burden and strategic influence.
Strategic security options and implementation constraints
| Policy option | Principal authority | Expected strategic effect | Implementation burden | Time to effect | Reversibility and principal risk |
|---|---|---|---|---|---|
| Verified bilateral military restraint | United States and Iran | Reduce direct conflict and escalation pressure | Political negotiation, monitoring and compliance | Potentially immediate for cessation; longer for credibility | Reversible; renewed violations can destroy confidence |
| Maritime safety coordination | Coastal states, maritime authorities and participating governments | Improve predictability and emergency response | Communications, procedures and sustained cooperation | Short to medium term | Operationally reversible; dependent on continuing security conditions |
| Defensive infrastructure protection | Gulf governments and authorised security partners | Reduce vulnerability of selected strategic assets | Significant equipment, personnel and maintenance requirements | Varies by existing capability and deployment | Redeployable in part; coverage gaps and high recurring costs |
| Alternative export infrastructure | Infrastructure owners, national authorities and investors | Reduce dependence on single routes | Major capital expenditure, construction and permitting | Medium to long term | Limited once capital is committed; alternative assets may remain exposed |
| Independent incident investigation | Competent national and international authorities | Reduce disputed attribution and retaliatory miscalculation | Access to evidence and cooperation among parties | Case-dependent | Procedurally reversible; politicisation can undermine trust |
| Broader regional diplomatic framework | Participating regional and external governments | Address threats beyond the bilateral US–Iran relationship | High diplomatic complexity and conflicting objectives | Medium to long term | Politically reversible; incomplete participation limits effectiveness |
These options are not mutually exclusive. Their effectiveness depends on how they interact and whether the parties’ commitments are sufficiently durable to alter expectations about future behaviour. A defensive deployment can limit the damage caused by attacks without removing the incentive to launch them. Alternative export infrastructure can reduce dependence on one route while introducing another set of vulnerabilities. Diplomatic engagement can reduce political confrontation without independently guaranteeing commercial safety. The central policy problem is therefore one of integration rather than identifying a single instrument capable of resolving every source of instability.
Key Judgments
The first judgment, with high confidence, is that the Gulf crisis has become a sustained interstate and regional security confrontation rather than an isolated maritime emergency. The American notification of combat operations, successive UN statements concerning renewed hostilities, the documented participation of regional mediators and the persistence of maritime attacks establish that military, diplomatic and commercial developments have become structurally connected. The conflict’s implications cannot be evaluated solely through direct US–Iran military exchanges because the interests and vulnerabilities of neighbouring states are integral to the regional operating environment.
The second judgment, with high confidence, is that the June ceasefire framework did not establish sustained operational security. Subsequent confrontations, the interruption of the IMO’s maritime evacuation mechanism and continuing verified incidents demonstrate that announced restraint and reliable implementation remained different conditions. The evidence does not justify treating the existence of a negotiated framework as proof that maritime normalisation has been achieved.
The third judgment, with medium confidence, is that an uneven process of partial stabilisation remains more plausible than an immediate return to pre-conflict security conditions. The EIA’s expectation of gradual recovery in regional oil production demonstrates that material workarounds and partial restoration are possible. Nevertheless, the vulnerability of alternative infrastructure and the continuing maritime threat environment create reasons to expect that recovery will be geographically differentiated and exposed to reversal. This judgment does not imply a precise probability or a fixed timetable for complete normalisation.
The fourth judgment, with high confidence, is that Gulf security cannot be reduced to the balance of American and Iranian conventional military capabilities. The protection of Saudi infrastructure, the role of regional mediators, the involvement of external defence partners and the vulnerability of commercial maritime systems demonstrate that an effective settlement requires a wider configuration of political and operational arrangements.
The fifth judgment, with medium confidence, is that future regional security arrangements will face persistent pressure to combine deterrence, infrastructure protection and verifiable diplomatic commitments. Each instrument addresses a different source of risk, while none independently eliminates the capacity for renewed disruption. Their effectiveness through 2030 will depend on the credibility of implementation and the willingness of participating governments to sustain commitments when political or military circumstances deteriorate.
What Would Change the Assessment
The assessment would become materially more favourable if the governments directly involved in the confrontation established a clearly documented and consistently observed arrangement covering attacks against commercial shipping, protection of essential infrastructure and procedures for resolving alleged violations. A sustained reduction in maritime incidents, evidence of stable vessel movements, improved commercial insurance availability and the resumption of ordinary port and export operations would provide stronger evidence of practical normalisation than political declarations alone. The restoration of a credible IMO-supported safe-passage mechanism would be an additional positive indicator, although its humanitarian objectives and operational scope would need to be distinguished from comprehensive commercial reopening.
Conversely, renewed direct attacks between the United States and Iran, further strikes against strategically significant energy infrastructure, deterioration in the security of neighbouring Gulf states or a prolonged inability to resume ordinary commercial movements would weaken the stabilisation assessment. Particularly consequential would be evidence that military activity had spread to infrastructure previously regarded as an effective alternative to Hormuz, because this would undermine the resilience benefits of geographic diversification.
The principal unresolved official records concern the full operative provisions and implementation arrangements associated with the June diplomatic framework, verified compliance reporting, the scope of security commitments provided to commercial shipping and the distinction between attacks attributable to national armed forces and those involving other actors. These gaps are material because they determine whether a future agreement can credibly reduce the incentives for renewed confrontation rather than merely suspend military activity for a limited period.
Chapter 1 — Final Net Assessment
The Persian Gulf confrontation reveals the limitations of a regional security system dependent on military deterrence without sufficiently credible mechanisms for preventing the recurrence of coercive threats against strategically important commercial infrastructure. The available record demonstrates that Washington and Tehran have repeatedly combined military pressure with diplomatic engagement, while Gulf governments and external partners have sought to protect their own territories, economic interests and transport networks from the consequences of escalation. The resulting system has permitted negotiations and partial operational recovery without establishing a durable separation between interstate confrontation and international commerce.
The strategic objective through 2030 should therefore be understood as the creation of conditions under which maritime security no longer depends on exceptional arrangements that can be suspended after individual incidents. Such conditions would require verified restraint, meaningful participation by affected regional states, protection of critical infrastructure and credible observance of international navigational rights. The political difficulty is that the parties seek different forms of security, economic advantage and strategic reassurance, while the instruments available to each can impose costs on the others without necessarily resolving the underlying dispute.
The decisive conclusion is that a ceasefire can interrupt hostilities, but only an enforceable regional security arrangement can substantially reduce the recurring geopolitical risk attached to Gulf commerce. Until that distinction is reflected in observable operational conditions, governments and international businesses must treat the Persian Gulf as a strategically contested environment in which diplomatic progress is important but insufficient evidence of durable stability.
Chapter 2. The Strait of Hormuz: Negotiations, Actual Shipping Movements and Residual Maritime Threats
Principal Judgment: A Navigable Strait Is Not Necessarily a Commercially Open Strait
The operational condition of the Strait of Hormuz as of 31 October 2026 cannot be established through diplomatic statements, isolated successful transits or the existence of an internationally recognised navigation corridor. The determining measures are repeated vessel movements, cargo volumes, the reliability of inbound and outbound passage, the severity of attacks, commercially acceptable insurance conditions and the ability of ships to complete scheduled journeys without exceptional intervention. These requirements are especially important because navigation restrictions are not binary. A passage may remain physically possible for some vessels while becoming commercially unacceptable for others; oil tankers, LNG carriers, chemical tankers, bulk carriers and container vessels possess different cargo characteristics, safety obligations, insurance exposures and contractual requirements. A convincing assessment of reopening must therefore distinguish between the number of vessels physically crossing the Strait, the volume and type of cargo actually carried, and the proportion of ordinary commercial services restored.
The historical petroleum figures establish the scale of the disruption but also identify an important limitation in the public data. The U.S. Energy Information Administration estimated petroleum-liquids movements through Hormuz at 21.6 million barrels per day in the fourth quarter of 2025 and 4.9 million barrels per day in the second quarter of 2026. The latter represents approximately 22.7% of the earlier quarterly average, but it does not establish that October throughput remained at that level. Quarterly tanker-flow estimates cannot resolve the day-to-day situation at the end of October, particularly where attacks, selective passage and interruptions to individual export terminals create substantial variation. A complete operating assessment would require a consistent daily AIS series reconciled with vessel identity, cargo type, load condition, terminal departures and arrivals. Without that reconciliation, statements describing the Strait as a specific percentage reopened would imply precision that the evidence cannot support. Global Energy Security Data — U.S. Energy Information Administration — August 2026.
October Incident Evidence: The Threat Persisted During Outbound Commercial Passage
The International Maritime Organization’s incident register provides evidence of continuing physical danger. By 30 October 2026, it recorded 122 confirmed incidents and 24 seafarer fatalities across the affected regional maritime environment. Its October entries identify numerous damaged vessels, including attacks within the Strait itself and incidents near Oman, the United Arab Emirates, Qatar and Saudi Arabia. The geographical distribution is consequential: vessels escaping the narrowest part of Hormuz may still face threats in adjacent operating areas, so successful passage through one segment does not automatically establish safe completion of the wider voyage. Middle East — Highlighted Confirmed Maritime Incidents — International Maritime Organization — October 2026.
UK Maritime Trade Operations provided a more detailed contemporary record of specific incidents. Its 5 October advisory, numbered 152-26, reported that an inbound tanker approximately 11 nautical miles north of Khasab had been hailed by Iran’s Islamic Revolutionary Guard Corps and instructed to turn back under threat of attack. The master reportedly complied. This incident is analytically distinct from a projectile strike because it demonstrates a form of coercive interference capable of preventing transit without requiring physical damage. UKMTO also reported an outbound tanker struck by a projectile on 10 October, causing a fire, and a tanker attacked near Sohar anchorage on 11 October in an incident subsequently reclassified after confirmation of a UAV strike. The contrast among these incidents demonstrates why the term maritime insecurity must be separated into interference with navigation, kinetic damage, crew-safety consequences and interruption of commercial movements. Recent Maritime Incidents — UK Maritime Trade Operations — October 2026.
Additional UKMTO reports dated 22, 23, 29 and 30 October described outbound tankers struck by unidentified projectiles, a vessel disabled during transit, a reported vessel fire near Khasab and a tanker fire following an attack approximately 40 nautical miles south of Lavan Island. The precise consequences differed, and several reports explicitly stated that authorities were investigating. This distinction must be preserved: an official receipt of a report is not equivalent to a completed forensic determination of the weapon, attacker or command responsibility. Nevertheless, the continued reporting of attacks during the final days of October directly contradicts any assessment that political reopening announcements had already produced consistently safe commercial passage. UKMTO Incident Reporting and Advisories — October 2026. UKMTO
Selected October maritime-security incidents
| Date | Vessel or location | Documented incident | Operational significance |
|---|---|---|---|
| 5 October | Inbound tanker, north of Khasab | Reported IRGC demand to reverse course | Direct interference with passage |
| 5 October | ON PEACE, Hormuz | Damaged; 12 seafarers injured in IMO register | Significant personnel-safety exposure |
| 10 October | Outbound tanker, Hormuz | Projectile strike and reported fire | Continuing kinetic risk during passage |
| 11 October | Sohar anchorage | UKMTO later confirmed UAV strike | Threats beyond the transit channel |
| 13 October | GFS PRIDE, Hormuz | IMO recorded vessel sunk | Potential total vessel loss |
| 22 October | Outbound tanker near Limah, Oman | Projectile strike; continued voyage | Passage possible despite attacks |
| 23 October | Outbound tanker, Hormuz | Projectile strike reportedly disabled vessel | Risk of immobilisation |
| 29 October | Outbound vessel near Khasab | Fire reported; cause initially unresolved | Serious operational uncertainty |
| 30 October | Outbound crude tanker, Hormuz | Time-late projectile-strike report | Continuing danger at cut-off |
Sources: IMO Confirmed Maritime Incidents — October 2026; UKMTO Recent Incidents — October 2026.
The coexistence of attacks and completed voyages is not contradictory. It describes a corridor in which some traffic continues despite risk. For maritime insurers and shipowners, this condition differs substantially from sustained normalisation. A shipping operator must assess the potential consequences of an incident, including loss of a vessel, crew injury, pollution liabilities, salvage costs and delayed cargo, rather than relying exclusively on the number of vessels that completed passage successfully. The relevant commercial decision is consequently sensitive to both the frequency and severity of hostile incidents.
Cargo Classification and the Limits of Aggregate Traffic Measures
A serious assessment of Hormuz cannot treat all maritime traffic as an interchangeable volume. Crude carriers transport unrefined petroleum from producing regions to refineries; product tankers transport gasoline, diesel, aviation fuel and other refined products; LNG carriers require specialised cryogenic containment and compatible terminals; LPG carriers operate under different cargo-handling requirements; chemical carriers transport products whose compatibility, segregation and safety specifications can restrict substitution; container vessels carry large numbers of discrete shipments dependent on regular liner networks. These distinctions determine whether an interrupted cargo can be replaced through inventories, another exporter, another terminal or an alternative mode of transport. An observed increase in the number of smaller vessels crossing Hormuz would not necessarily compensate for the continued absence of large crude carriers or LNG shipments, because vessel counts and economic throughput are different measures.
For crude, the appropriate indicator is the volume loaded and delivered, classified by origin, destination and vessel characteristics, with allowances for laden versus ballast voyages. For LNG, the indicator must include actual cargo movements, liquefaction availability, terminal compatibility and the ability of receiving markets to replace lost deliveries. For containers, nominal TEU capacity is insufficient without service frequency, cargo load factors and confirmed port connections. For petrochemicals, the availability of compatible chemical carriers and tank storage can matter as much as total shipping capacity. An insurer’s willingness to cover a particular voyage may differ with cargo value, vessel characteristics and intended route; therefore a general statement that maritime insurance has become available cannot establish that every commercially relevant cargo stream has recovered.
The separation of vessel classes also prevents a common error in geopolitical reporting: equating oil-market recovery with the restoration of container and industrial supply chains. Additional petroleum exports through a pipeline or alternative oil terminal may improve energy availability without restoring a container service to Jebel Ali. Conversely, a carrier may resume scheduled calls to a particular terminal while crude exports from another part of the Gulf remain constrained. The consequences for global businesses are highly dependent on the exact commodity and transport chain involved.
Reopening criteria by cargo segment
| Segment | Physical evidence required | Commercial confirmation required | Principal residual constraint |
|---|---|---|---|
| Crude oil | Loaded tanker departures and deliveries | Stable voyage access and acceptable charter terms | Export-terminal and tanker availability |
| Refined fuels | Confirmed product cargoes and receiving terminals | Product quality and destination compatibility | Refinery output and available stocks |
| LNG | Laden LNG carrier movements | Receiving-terminal slots and shipping commitments | Liquefaction, cryogenic shipping and contract constraints |
| LPG | Loaded gas-carrier movements | Compatible ships and receiving infrastructure | Specialised equipment |
| Chemicals | Cargo-specific chemical tanker movements | Tank segregation and cargo compatibility | Specialist tonnage and storage |
| Containers | Restored scheduled services and port calls | Reliable booking and onward connections | Network rotation and terminal capacity |
| Dry bulk | Completed cargo shipments | Suitable vessels and handling infrastructure | Commodity-specific port access |
The table represents the minimum evidence required to evaluate commercial recovery. It is not a declaration that these conditions have already been satisfied.
Mines, Threat Attribution and the Requirement for Verified Incident Mechanisms
Suspected mine incidents require particular evidentiary restraint. A projectile strike, UAV attack, floating explosive device and attached limpet mine involve different mechanisms and potentially different operational responsibilities. Damage to a vessel’s hull does not independently establish that a limpet mine was used. Determination of the mechanism may require physical examination, explosive residue analysis, damage-pattern assessment, crew testimony and competent investigative findings. UKMTO advisories frequently describe the cause of reported attacks as unidentified or under investigation. Where the official record does not establish the weapon type, assigning a specific mine mechanism would distort both the evidence and the operational response.
The commercial consequences of suspected mines are nevertheless important even before attribution is established. A credible underwater explosive threat may require additional inspections, route precautions or restrictions on certain activities. However, the appropriateness of such measures depends on confirmed intelligence and maritime authority guidance rather than a general assumption that every unexplained hull incident involves mines. The strongest operational approach is therefore to separate the level of confidence in an incident’s occurrence from confidence in the weapon used and responsibility for its deployment.
Insurance, Security Guarantees and a Testable Definition of Normalisation
The operational restoration of Hormuz requires the alignment of four conditions: demonstrably safe navigation, repeatable commercial traffic, adequate port and export infrastructure, and insurable voyages at economically sustainable terms. Diplomatic arrangements affect these conditions but do not replace them. A government may permit or encourage transit without controlling the underwriting decisions of marine insurers or the safety assessments of shipowners. Similarly, an escort or passage mechanism may improve the prospects of particular voyages without guaranteeing that ordinary schedules can resume across every vessel class.
The relevant monitoring framework should compare rolling seven-day and thirty-day observations, segmented by vessel type, with pre-conflict baseline volumes. Each measure must retain the distinction between observed and inferred cargo. Incident frequency should be evaluated alongside injury, damage and vessel-loss severity. Insurance should be assessed using like-for-like quotations, policy exclusions and cover availability rather than a single reported premium. Port recovery should be measured through actual loading and discharge activity, not announced terminal capacity.
Chapter 2 judgment — High confidence: Hormuz remained an exceptionally hazardous commercial corridor at the end of October 2026. A timetable for sustainable normalisation cannot be established from diplomatic announcements alone. The decisive evidence would be sustained, verified transit recovery accompanied by fewer attacks, acceptable insurance and reliable port operations.
Chapter 3. Saudi Arabia and Gulf Transport Hubs Under Military Pressure
Principal Judgment: Protecting Airports, Cities and Distribution Networks Is Now Part of Gulf Economic Security
Saudi Arabia’s exposure to regional military escalation extends beyond the immediate physical protection of oil installations and export terminals. The kingdom’s international economic role depends on the simultaneous functioning of energy infrastructure, commercial airports, road corridors, logistics centres, telecommunications and urban distribution networks. A threat to one of these systems can impose additional demands on the others, particularly where the alternative transport arrangements require cargo to be redirected through facilities with limited spare capacity. The increasing integration of Saudi Arabia into international manufacturing, distribution, tourism and aviation networks makes reliability of transport infrastructure economically consequential even when an attack causes limited physical damage. For an operator deciding where to establish regional inventories or distribution activities, the relevant question is not merely whether a particular airport remains open, but whether flight schedules, ground handling, customs clearance, road access and the supporting digital infrastructure can function predictably under recurring security alerts.
The British Ministry of Defence provided a significant official indication of this threat environment on 20 October 2026, when it announced additional defensive military support to Saudi Arabia in response to escalating Houthi attacks. The package included RAF Typhoon aircraft for defensive counter-air missions, an A400M transport aircraft supporting the movement of defence materiel and British advisers assisting Saudi military personnel. The ministry explicitly identified attacks against civilian targets, including King Khalid International Airport in Riyadh, as part of its rationale. Its public statement distinguished these defensive deployments from offensive action by the Typhoon aircraft against Houthi targets. This distinction is important because air defence, aviation-route protection and offensive military operations carry different legal authorities, escalation implications and operational objectives. Operational Update: UK Military Support to Saudi Arabia — UK Ministry of Defence — 20 October 2026.
The October deployment followed an earlier British announcement on 22 September, under which an RAF Voyager air-to-air refuelling aircraft would support Saudi defensive activity following a request from the Saudi government. The two decisions demonstrate a developing requirement for sustained rather than purely episodic defensive support. They also establish that international military cooperation was being directed toward the protection of national infrastructure and civilian areas, not exclusively toward the security of commercial vessels. The implications for air-cargo operations remain conditional: a defensive deployment provides evidence of an assessed threat and a response to it, but it does not establish how many commercial flights were cancelled, how much cargo capacity was lost or whether airport operating hours were reduced. Those consequences require airport and airline operating records. UK Military Support to the Kingdom of Saudi Arabia — UK Ministry of Defence — 22 September 2026.
Riyadh, Makkah and Madinah: Military Threats and Differentiated Economic Exposure
Threats affecting Saudi metropolitan areas have different economic implications depending on the local concentration of passenger flows, business activity, government functions and distribution infrastructure. Riyadh combines government and commercial functions with a major international airport and significant freight and passenger connectivity. A security incident affecting its airspace can impose consequences on domestic and international schedules, cargo transfers, aircraft rotations and the continuity of time-sensitive commercial movements. The physical vulnerability of the airport should not, however, be conflated with a verified reduction in cargo throughput. The commercial effect depends on whether airspace restrictions are imposed, how long they remain in force, whether aircraft are diverted and whether operators can restore connections without losing critical transfer windows.
The western cities of Makkah and Madinah possess distinct exposure because of their religious significance and dependence on transport connections serving pilgrims and other visitors. Aerial threats in their surrounding regions introduce safety and continuity concerns for passenger transport and essential services, but the economic consequences differ from those affecting Riyadh’s commercial and institutional functions. An assessment that treats the three cities as operationally interchangeable would obscure differences in the type of traffic exposed, the availability of alternative connections and the consequences of disruption.
Saudi official reporting during October described aerial interceptions in the vicinity of major population centres, while the British government’s documented concern about King Khalid International Airport supports the broader judgment that national airspace protection had become a significant security priority. Yet successful interceptions, debris impacts, direct infrastructure strikes and actual airport closures are separate categories of evidence. A successful interception can prevent an incoming weapon from reaching its intended target while still requiring temporary safety precautions. Conversely, debris from an interception can create local hazards without establishing a sustained interruption to regional aviation. The appropriate economic assessment must rely on verified NOTAMs, airline cancellations, airport movement records and cargo-handling data rather than interpreting every military announcement as a measurable loss of transport capacity.
The European Union Aviation Safety Agency’s active conflict-zone advisories provide an independent institutional basis for recognising airspace exposure. Its Saudi Arabia bulletin, issued on 30 September and revised on 9 October 2026, remained relevant to the October operating environment. EASA also maintained differentiated advisories for neighbouring airspace, demonstrating that route-specific assessments were required rather than a uniform assumption that all regional airspace was unavailable. Conflict Zones Advisories — European Union Aviation Safety Agency — October 2026.
Saudi and Gulf aviation risk differentiation
| Location or system | Principal economic function | Documented risk basis | Required operating evidence | Potential commercial consequence |
|---|---|---|---|---|
| Riyadh / King Khalid International Airport | Business travel, passenger connections, air cargo and government connectivity | UK Ministry of Defence identified attacks affecting civilian targets | Airport movements, NOTAMs, airline schedules | Disrupted connectivity and cargo transfers |
| Makkah region | Religious travel and essential urban services | Regional aerial-security reporting | Civil aviation and national authority records | Passenger and service-continuity exposure |
| Madinah region | Pilgrimage connectivity and regional transport | Regional aerial-security reporting | Airport and airspace operating records | Diversions and schedule adjustments |
| Saudi national airspace | Domestic and international flight corridors | EASA Saudi Arabia conflict-zone bulletin | Flight paths, restrictions and cancellations | Additional flight time or reduced network reliability |
| Gulf connecting airspace | International passenger and cargo connectivity | Separate EASA regional advisories | Air traffic and carrier operating data | Displaced aviation traffic |
| Defence logistics | Movement of military equipment and personnel | UK A400M and refuelling support announcements | Military deployment records | Increased defensive operating capability |
The absence of a verified airport-wide cargo-loss series prevents calculation of a defensible national reduction in airfreight capacity.
The Economic Consequences of Airspace Restrictions for Global Hub Networks
The economics of aviation hubs depend on maintaining connections among flights arriving and departing within coordinated time windows. A major airport does not simply process independent aircraft movements; it supports a scheduled network in which passengers, luggage and freight are transferred across services. A relatively short interruption affecting a large group of arrivals can cause missed connections and generate subsequent delays because aircraft and crews become displaced from their planned rotations. The severity of these effects depends on schedule density, spare aircraft capacity, alternative routing, available air traffic corridors and the duration of the restriction. Consequently, the economic cost of a security incident may arise through disruption of the network timetable even when no aircraft or terminal building is damaged.
For freight, the effect is particularly significant because international cargo uses both dedicated freighters and the cargo compartments of passenger aircraft. A reduction in passenger flight frequency can reduce belly-cargo capacity, while diversion of dedicated freighters can impose additional fuel and handling costs. The substitution between the two is limited by aircraft payload characteristics, shipment dimensions, dangerous-goods restrictions, refrigeration requirements and route availability. A high-value electronics shipment may support an alternative airfreight service whose premium would be commercially unacceptable for lower-value goods. Likewise, a pharmaceutical shipment requiring controlled temperature conditions cannot necessarily be moved through any available airport without confirming suitable handling and storage.
A reliable assessment of Gulf aviation resilience must therefore use several indicators simultaneously: aircraft movements, available cargo tonne-kilometres, dedicated freighter frequency, passenger belly capacity, cargo-terminal throughput and flight-cancellation rates. Using passenger numbers alone would miss the economic significance of freight carried on passenger services. Conversely, using reported cargo tonnage alone may understate schedule reliability problems affecting urgent shipments. The appropriate decision variable for manufacturers is the probability that a defined shipment can complete its door-to-door movement within the required delivery period, not simply the aggregate capacity of the airport.
Red Sea Export Infrastructure and the Vulnerability of Geographic Diversification
Saudi Arabia’s East–West oil pipeline provides a direct demonstration of the limitations of physical diversification when regional military threats can reach alternative infrastructure. The EIA estimated that the system had transported more than 5 million barrels per day toward Yanbu on the Red Sea before the September attacks that temporarily interrupted operations. The interruption affected a route that had become particularly important because of difficulties associated with Hormuz. The EIA reported partial restoration by 22 September, but the episode demonstrated that the existence of a bypass does not guarantee the availability of its capacity during a crisis. Global Oil Markets — U.S. Energy Information Administration — October 2026.
The relevant infrastructure chain comprises more than the pipeline itself. Pumping stations, electrical supply, storage, terminal facilities, vessel loading, security procedures and maritime access all contribute to actual export availability. A disruption affecting any indispensable component can limit the commercial usefulness of the entire corridor. Moreover, shipments leaving Yanbu may depend on safe navigation through different Red Sea routes, so physical diversion away from Hormuz can replace one geographical exposure with another.
The economic consequence for international buyers is that the nominal existence of alternative capacity cannot be equated with a guaranteed substitute supply. Refiners and traders must establish the volumes actually available, their crude specifications, expected loading dates and shipping arrangements. A general statement that Saudi Arabia possesses a Red Sea export route does not establish that a purchaser can obtain a particular grade of crude at a specified time.
Regional Distribution Hubs: The Interaction of Security, Congestion and Alternative Transport
The wider Gulf logistics system demonstrates the difficulty of substituting one transport hub for another. Hapag-Lloyd’s 30 October operating update described Jebel Ali as receiving ad hoc vessel calls, Salalah as operating at 84% yard density with delays of up to 36 hours and Jeddah as reporting 76% yard density. These observations do not establish that military attacks caused every individual delay, since congestion, weather and changes in vessel scheduling can contribute independently. They nevertheless establish that the alternative network was operating under differentiated constraints. Week 44 Middle East Operational Update — Hapag-Lloyd — October 2026.
For regional distributors, the effect is a reduction in the predictability of replenishment. A shipment redirected through an alternative port may require additional customs clearance, trucking, storage or transshipment before reaching the original customer. If several operators adopt the same alternative, its available capacity can deteriorate rapidly. Emergency reliance on landbridges is particularly constrained by the number of available vehicles, border processing, cargo characteristics and inland terminal capacity. A port that can physically receive additional containers may still lack sufficient road or warehouse capacity to clear them.
The appropriate response is to evaluate regional distribution networks as integrated systems rather than comparing airports, ports and roads in isolation. A distribution centre’s resilience depends on whether its inbound materials and outbound deliveries can be maintained under plausible combinations of maritime restrictions, airspace interruptions and inland congestion. Regional concentration creates commercial efficiency under stable conditions but can increase the consequences of a single geographically widespread incident.
Gulf hub resilience assessment
| Hub function | Primary dependency | Disruption pathway | Practical continuity requirement |
|---|---|---|---|
| Riyadh air cargo | Airspace and flight connectivity | Aerial threats and schedule disruption | Alternative uplift and prearranged cargo handling |
| Saudi Red Sea oil exports | Pipeline and Yanbu terminal system | Infrastructure damage and maritime restrictions | Verified export availability and alternative supply |
| Jebel Ali container logistics | Direct vessel services and terminal operations | Restricted calls and service redesign | Alternative ports and inland connections |
| Salalah transshipment | Berths, yard and onward vessel services | Concentrated diversion traffic | Confirmed terminal and feeder capacity |
| Jeddah distribution | Maritime access and hinterland capacity | Security, congestion and schedule variability | Integrated port-road planning |
| Gulf industrial supply | Inbound materials and energy infrastructure | Combined transport and utility disruptions | Supplier and inventory diversification |
Chapter 3 — Net Assessment
Saudi Arabia and neighbouring Gulf economies face a security problem in which the protection of transport infrastructure must be coordinated across air, maritime, energy and inland networks. The British defensive deployments announced in September and October provide direct evidence of heightened concern over the protection of Saudi civilian and strategic infrastructure. EASA’s conflict-zone advisories establish the continuing requirement for differentiated airspace risk assessment, while the September interruption of the East–West pipeline demonstrates that energy-export alternatives are not immune from regional attacks.
The decisive judgment, with high confidence, is that Gulf hub resilience depends on the continuity of complete transport chains rather than the physical availability of individual facilities. Airports, ports, pipelines and distribution centres can remain partly operational while commercial reliability deteriorates. The critical evidence still required is consistent airport-level traffic and cargo data, verified restrictions, infrastructure recovery times and confirmed capacity available through alternative distribution corridors.
PILLAR II — GLOBAL ENERGY, MARITIME LOGISTICS AND INDUSTRIAL SUPPLY CHAINS
Chapter 4. The Economic Geography of Maritime Disruption: Cape of Good Hope Diversions, Fleet Capacity, Insurance and the Reconfiguration of Global Transport Corridors
OPEN-SOURCE STRATEGIC INTELLIGENCE ASSESSMENT | 31 OCTOBER 2026 | ANALYTICAL HORIZON 2027–2030
Principal Judgment: Maritime Disruption Is Transforming the Economics of Distance, Shipping Capacity and International Trade
The economic significance of the present Middle Eastern maritime crisis extends far beyond the direct interruption of vessel movements through the Strait of Hormuz. It lies in the simultaneous deterioration of several interconnected elements of international transport: the availability of commercially accessible navigation routes, the effective capacity of the global merchant fleet, the predictability of port operations, the allocation of empty containers, the insurability of individual voyages and the ability of shipping networks to maintain regular connections between production centres and final markets. These mechanisms create costs even where ships continue moving and trade volumes do not decline proportionately. A vessel diverted around the Cape of Good Hope may complete its voyage without suffering physical damage, yet the additional sailing distance consumes fuel, immobilises shipping capacity for longer periods, changes the timing of cargo delivery, disrupts the positioning of containers and increases uncertainty for subsequent voyages. When those effects occur across multiple services, the economic consequences extend from the individual carrier to the availability and price of international transport capacity.
The principal assessment, with high confidence, is that the critical operational variable is no longer simply whether a maritime corridor is physically open, but the quantity of reliable transport capacity that remains available after route length, vessel rotation, congestion and security restrictions are taken into account. This distinction explains why international shipping markets can experience significant price increases even when nominal fleet capacity continues to expand. Ships constitute a finite stock of productive transport assets. Their economic output depends on the volume of cargo transported over a specified period, rather than their nominal carrying capacity alone. A longer round voyage reduces the frequency with which the same vessel can deliver cargo. Maintaining an unchanged weekly service therefore requires additional ships, greater operating speeds, fewer port calls or some combination of these measures. Each option involves costs or operational trade-offs. When operators cannot obtain additional tonnage, preserve contractual schedules or redirect sufficient capacity, the result may be fewer departures, longer booking lead times and a reduction in the effective supply of maritime transport.
The available historical evidence provides a quantitative foundation for this assessment. The World Bank estimated that diversion of a typical Europe–Asia shipping service around the Cape of Good Hope instead of the Suez Canal could add approximately 3,000–3,500 nautical miles and seven to ten days to the journey, with the additional distance potentially absorbing 700,000–1.9 million twenty-foot equivalent units (TEUs) of container capacity under the conditions examined in January 2024. These figures are historical route-specific estimates and must not be interpreted as measured system-wide losses in October 2026. They nevertheless establish a defensible relationship between maritime geography, additional voyage time and the reduction of effective fleet productivity. Will a Prolonged Rerouting of Ships from Suez Trigger a New Supply Chain Crisis? — World Bank — January 2024.
The consequences are visible in the operational decisions of shipping companies during 2026. On 1 March, Maersk announced that its ME11 service connecting the Middle East and India with the Mediterranean and its MECL service connecting the Middle East and India with the United States East Coast would be diverted around the Cape of Good Hope because of deteriorating regional security. The company also announced suspension of vessel crossings through Hormuz until further notice. In July, Maersk subsequently reported a partial return of selected services to the Red Sea and Suez corridor, demonstrating that routing decisions were being modified as security assessments evolved rather than governed by a permanent geographical preference. Its 9 July announcement concerning the MECL service specified an expected improvement in sailing times of seven days westbound and fourteen days eastbound following the return to the trans-Suez route. The difference between these directions is significant: the economic consequences of rerouting depend on the actual service rotation, intermediate port calls, prevailing operating speed and location of the cargo rather than a universal additional-distance estimate. Rerouting of ME11 and MECL Service around the Cape of Good Hope — Maersk — March 2026; Structural Changes to MECL — Maersk — July 2026.
By late October, the problem had evolved from the initial decision to avoid dangerous maritime corridors into the management of a fragmented transport network. Hapag-Lloyd’s operational reporting indicated restrictions on Jebel Ali calls, substantial congestion at Salalah, intensive utilisation of facilities in Jeddah and congestion affecting Indian Ocean transshipment centres. The carrier’s separate African operational update confirmed that Jebel Ali port calls remained suspended for two named services, while other services were undergoing vessel substitutions and changes in operating schedules. This demonstrates an important operational reality: even where regional maritime traffic is maintained through alternative ports, the resulting network may not reproduce the geographic reach, reliability or handling capacity of the original services. Week 44 — Middle East Operational Update — Hapag-Lloyd — October 2026; Week 44 — Africa Operational Update — Hapag-Lloyd — October 2026.
The deeper structural effect is therefore a redistribution of maritime activity across a network that was designed around different assumptions about route accessibility, port connectivity and transport costs. The Cape of Good Hope can provide a commercially viable alternative to the Red Sea and Suez Canal for numerous Europe–Asia services, but it cannot substitute directly for access to ports located inside the Persian Gulf. Similarly, Mediterranean terminals can receive vessels arriving via the Atlantic and Gibraltar, yet they do not automatically replace cargo-handling and feeder functions performed by Gulf or Indian Ocean hubs. The resulting distinction between rerouting, transshipment, inland diversion and direct market substitution is essential for evaluating the real economic cost of the crisis. Each solution addresses a different constraint, and none can be assumed to restore the pre-disruption transport network without additional resources.
The Reconfiguration of Maritime Geography: Hormuz, Bab el-Mandeb, Suez and the Cape of Good Hope
The Middle Eastern shipping system contains two distinct but economically interconnected maritime chokepoints. Hormuz governs access between the Persian Gulf and the Gulf of Oman, while Bab el-Mandeb provides the southern connection between the Red Sea and the Gulf of Aden. The Suez Canal then connects the Red Sea to the Mediterranean, creating a shorter maritime route between Europe and much of Asia. Restrictions affecting these locations generate different consequences depending on the origin and destination of the cargo. A container vessel sailing from East Asia to Northern Europe may avoid insecurity in the Red Sea by rounding southern Africa. A vessel originating from an export terminal inside the Persian Gulf cannot use the Cape of Good Hope as an alternative means of leaving the Gulf if it cannot first transit Hormuz. A crude shipment loaded at a Red Sea terminal is not necessarily subject to the same access restrictions as a shipment loaded in the Upper Gulf. These differences define the practical geography of substitution.
The importance of the Suez route is illustrated by the earlier Red Sea crisis. The World Bank estimated that diversion around southern Africa added 3,000–3,500 nautical miles and seven to ten days to typical Europe–Asia movements, while another World Bank assessment identified route-dependent extensions reaching approximately ten to twenty days for certain East Asian services. These estimates should not be averaged because they refer to different geographical endpoints and operating assumptions. The broader analytical point is that route displacement is highly heterogeneous: a diversion may materially affect one shipping service while leaving another comparatively unchanged, depending on where its commercial origin, destination and intermediate calls are located. Will a Prolonged Rerouting of Ships from Suez Trigger a New Supply Chain Crisis? — World Bank — January 2024.
Shipping companies subsequently incorporated that reality into service design. Maersk’s March 2026 decision to route ME11 and MECL around the Cape was explicitly based on deteriorating security conditions. Its July announcement restoring the MECL trans-Suez routing offered a rare carrier-specific quantification of the potential recovery benefit: average improvements of seven days westbound and fourteen days eastbound. These values provide direct evidence that the same strategic corridor can impose different schedule penalties by direction. They also demonstrate why a shipping network cannot be accurately evaluated through a single geographical distance multiplier. A vessel’s rotation may include ports with different terminal productivity, cargo volumes, tides, inland connectivity and contractual priorities. Returning to a shorter route may recover some voyage time while exposing the service to different congestion or security constraints, meaning that a shorter theoretical maritime passage does not necessarily restore the original door-to-door delivery time. Structural Changes to MECL — Maersk — July 2026.
The Cape diversion additionally changes the distribution of economic activity across maritime regions. Longer routes increase the demand for bunker fuel, vessel services and port capacity along alternative corridors. At the same time, ports that previously benefited from regular direct services may experience reduced calls or changes in cargo composition. Transshipment terminals can absorb additional cargo, but only within the limits imposed by berths, cranes, yard storage, customs procedures, reefer connections, equipment availability and hinterland transport. These constraints are not interchangeable. A terminal may have sufficient nominal berth capacity but insufficient yard capacity to accept more containers. Another may offer ample container storage but limited inland trucking or rail capacity. A third may possess sufficient infrastructure while being unable to accommodate the vessel sizes or handling requirements associated with diverted services.
The 2026 operating environment is further complicated by the interaction between route substitution and commercial access to the Gulf. Maersk’s October operational notices describe the expansion of multimodal transport solutions across Saudi Arabia, Kuwait, Bahrain, the United Arab Emirates, Qatar and Iraq. The company’s arrangements include transshipment through Salalah and Khor Fakkan, bonded inland movements and connections through feeder services. These developments show that alternative logistics configurations were being used to preserve access to regional markets when conventional direct routes could not be relied upon. They also indicate that the substitution process involves commercial and regulatory complexity: inland moves remain subject to available transport capacity, applicable laws, customs arrangements, cargo specifications and the operating status of the receiving terminals. Maersk Operations Updates on the Situation in the Middle East — Maersk — October 2026.
Comparison of principal route alternatives
| Route or corridor | Primary commercial function | Security and operational constraint | Potential substitution | Principal economic limitation |
|---|---|---|---|---|
| Strait of Hormuz | Access between Persian Gulf ports and the Gulf of Oman | Maritime attacks, restricted passage and vessel-specific risk | Limited for cargo already inside Gulf ports | No equivalent maritime bypass for a vessel requiring direct access to an internal Gulf terminal |
| Bab el-Mandeb–Suez | Shorter Europe–Asia and Middle East–Europe route | Red Sea security conditions and service-specific risk decisions | Cape of Good Hope | Longer rotations, bunker consumption and vessel requirements |
| Cape of Good Hope | Alternative Europe–Asia and other long-haul ocean routes | Longer distance and exposure to different weather and port conditions | Can replace selected Suez movements | Additional ship-days, fuel, inventory time and schedule complexity |
| Saudi Red Sea gateways | Alternative maritime access for Saudi domestic and regional cargo | Port capacity, inland connections and regional security | Inland transport and alternative maritime services | Inland capacity, customs, handling and final-delivery constraints |
| Omani ports outside Hormuz | Transshipment and alternative Gulf-region access | Terminal congestion and downstream inland transport | Feeder services and bonded road corridors | Additional cargo handling and equipment requirements |
| UAE eastern maritime gateways | Outside-Strait access and regional redistribution | Port throughput, congestion and inland connectivity | Road or feeder connection to final destination | Does not automatically restore all Gulf direct services |
| Indian Ocean transshipment hubs | Consolidation and redistribution of long-haul cargo | Yard density, inter-terminal transfers and vessel schedule coordination | Multiple hub combinations | Additional transshipment time and risk of missed connections |
| Mediterranean gateways | European receiving and onward distribution capacity | Changes to vessel arrival patterns and inland corridor availability | Atlantic/Gibraltar arrivals replacing Suez-routed services | Variable rail, road and terminal capacity |
The relevant commercial question is not which alternative route is shortest in abstract geographical terms, but which combination of maritime, terminal and inland services can deliver a specified cargo at an acceptable total cost and reliability. A route is only a genuine substitute when it provides compatible capacity, suitable cargo handling, lawful customs access and a feasible final delivery connection.
Petroleum Flows and the Redistribution of Transport Demand Across Global Chokepoints
Although container shipping attracts considerable attention because of its visibility in international consumer trade, the reallocation of petroleum movements provides a distinct measure of changing maritime geography. The EIA’s August 2026 Global Energy Security Data report provides quarterly estimates for petroleum liquids transported through major maritime chokepoints and around the Cape of Good Hope between the first quarter of 2025 and the second quarter of 2026. These data are especially useful because they permit comparison of distinct corridors using a common unit, million barrels per day, and consistent reporting periods. They do not provide a complete October 2026 daily traffic series, nor should the flows through different chokepoints be added together as if they represented independent cargo volumes. Individual shipments may pass through more than one geographical location during a voyage. Global Energy Security Data — U.S. Energy Information Administration — August 2026.
Quarterly petroleum-liquids movements through major chokepoints
Million barrels per day; EIA estimates based on tanker-tracking data and conversion methodology.
| Corridor | Q1 2025 | Q2 2025 | Q3 2025 | Q4 2025 | Q1 2026 | Q2 2026 |
|---|---|---|---|---|---|---|
| Strait of Hormuz | 20.9 | 21.0 | 21.3 | 21.6 | 14.9 | 4.9 |
| Strait of Malacca | 22.3 | 23.8 | 23.4 | 24.9 | 21.3 | 16.6 |
| Suez Canal and SUMED Pipeline | 4.6 | 5.1 | 5.6 | 5.9 | 5.7 | 5.8 |
| Bab el-Mandeb | 3.9 | 4.5 | 4.6 | 5.4 | 5.6 | 8.1 |
| Cape of Good Hope | 9.0 | 9.3 | 9.0 | 9.9 | 8.2 | 9.4 |
| Danish Straits | 5.0 | 4.8 | 4.9 | 5.0 | 4.9 | 4.7 |
| Turkish Straits | 3.8 | 3.7 | 3.7 | 3.7 | 3.3 | 4.1 |
| Panama Canal | 2.8 | 2.5 | 2.8 | 2.8 | 2.9 | 3.2 |
Source: Global Energy Security Data, Table 2 — U.S. Energy Information Administration — August 2026.
The changes between Q4 2025 and Q2 2026 require careful interpretation. Hormuz experienced a contraction from 21.6 million barrels per day to 4.9 million barrels per day, an absolute decline of 16.7 million barrels per day, equivalent to approximately 77.3%. Over the same interval, estimated flows through Bab el-Mandeb increased from 5.4 million to 8.1 million barrels per day, while movements around the Cape of Good Hope changed from 9.9 million to 9.4 million barrels per day. Malacca flows declined from 24.9 million to 16.6 million barrels per day. These movements establish a significant change in the international distribution of petroleum traffic, but they do not support the simplistic conclusion that every barrel no longer moving through Hormuz was diverted to another maritime route. Some volumes may have been replaced by alternative production or stock withdrawals, some may have moved through pipelines to different export points and some may have represented production or export volumes that were not delivered during the period.
The distinction between substitution and displacement is economically decisive. If an oil shipment previously loaded in the Persian Gulf is instead supplied by a producer outside the region, the shipping system may experience a change in vessel deployment without a direct one-for-one rerouting of the original voyage. If a producer redirects crude toward a Red Sea terminal, the resulting shipment may follow a different maritime itinerary, changing exposure to other chokepoints. If production is shut in because export infrastructure is unavailable, the missing cargo does not create an immediate alternative shipping movement. Consequently, the reduction in Hormuz flow cannot be used mechanically to calculate additional tanker voyages around Africa or to estimate the corresponding increase in international freight demand.
The EIA’s recorded Cape of Good Hope movement of 9.4 million barrels per day in Q2 2026 is particularly instructive because it remained below the 9.9 million barrels per day recorded in Q4 2025. Despite the severe decline in Hormuz flows, the Cape did not exhibit a corresponding proportional increase in petroleum-liquids traffic over that comparison period. This does not invalidate the importance of Cape diversions for container services or for individual tanker routes. It shows that global energy supply restrictions, alternative export arrangements, regional production changes and maritime rerouting must be analysed as separate mechanisms. Applying container-route diversion assumptions directly to crude-oil traffic would misrepresent the observed system.
The Bab el-Mandeb increase likewise requires a route-specific interpretation. The rise from 5.4 million to 8.1 million barrels per day corresponds to approximately 50% growth between the two quarters. Yet higher recorded throughput through one chokepoint does not prove that the route was risk-free or that all shipping categories had resumed ordinary operations. Petroleum movements, container liner services and dry-bulk shipping respond to different supply constraints, contractual structures and security assessments. A change in the composition of traffic can produce an increase in aggregate oil volumes even while certain classes of commercial vessels continue to avoid the route.
This differentiated evidence is essential for strategic planners. A company importing chemicals or containerised components cannot assume that rising petroleum throughput demonstrates the availability of container services. Likewise, an increase in transits by smaller vessels does not necessarily demonstrate that larger tankers can obtain insurance or commercially viable loading and discharge arrangements. The appropriate unit of analysis depends on the exposure under examination: cargo volume, vessel number, deadweight tonnage, TEU capacity, vessel type, trade direction or port-to-port transit reliability.
Calculated changes in petroleum movements, Q4 2025 to Q2 2026
| Corridor | Q4 2025 | Q2 2026 | Absolute change, million b/d | Percentage change |
|---|---|---|---|---|
| Hormuz | 21.6 | 4.9 | −16.7 | −77.3% |
| Malacca | 24.9 | 16.6 | −8.3 | −33.3% |
| Suez and SUMED | 5.9 | 5.8 | −0.1 | −1.7% |
| Bab el-Mandeb | 5.4 | 8.1 | +2.7 | +50.0% |
| Cape of Good Hope | 9.9 | 9.4 | −0.5 | −5.1% |
Source: Calculated from Global Energy Security Data, Table 2 — U.S. Energy Information Administration — August 2026. Percentage changes use Q4 2025 as the denominator and are rounded to one decimal place. Chokepoint flows overlap geographically and must not be summed as independent world oil trade.
The Cape of Good Hope: Distance, Vessel Rotation and the Economics of Lost Fleet Productivity
The economic cost of routing vessels around southern Africa is frequently described in terms of additional fuel consumption and voyage duration, but its more important systemic consequence is the requirement to deploy additional capital and operating resources in order to preserve the same frequency of cargo movements. Container shipping networks are typically organised around fixed service rotations, with scheduled port calls and weekly or otherwise regular departures. Under such arrangements, the number of vessels required to operate a service depends on the duration of the complete rotation, including sailing time, port operations and schedule buffers. When the round-voyage duration increases, an operator must either obtain additional vessels or accept a reduction in service frequency. Both outcomes can affect freight prices and the reliability of trade connections.
The relationship can be expressed in straightforward operational terms. A service with a complete rotation of seventy days requires ten vessels to maintain weekly departures, assuming vessels are available and the service can preserve its scheduled sequence of calls. If the rotation extends to eighty-four days, the same weekly frequency requires twelve vessels. This represents a 20% increase in the vessel count required for that illustrative service, without any increase in the amount of cargo carried by each departure. The example is not a reported 2026 fleet deployment. It demonstrates the capacity mechanism through which longer routes create additional demand for ships. The actual adjustment depends on the rotation’s original duration, the additional time imposed by the diversion, the ability to modify port calls and the availability of suitable vessels.
A vessel may attempt to compensate for longer routes by increasing its operating speed. This can reduce the number of additional days required, but it generally increases fuel consumption because the energy needed for propulsion rises nonlinearly with speed. The relevant cost cannot be inferred from speed alone: hull characteristics, displacement, weather, propulsion efficiency, loading conditions and maintenance requirements all affect consumption. Nevertheless, the commercial trade-off is clear. Higher speed can preserve schedule frequency at the expense of fuel expenditure and potentially greater emissions, while slower operation can reduce daily fuel costs but require more vessel-days to transport the same annual volume. The optimal decision depends on bunker prices, charter costs, cargo urgency, freight income and the ability to recover additional costs through contractual surcharges.
This distinction becomes especially important during periods when shipping capacity is already committed. A carrier cannot necessarily acquire an additional vessel of the required class at the moment a route is disrupted. Replacement tonnage may be unavailable, commercially expensive or located far from the affected service. Vessel specifications also matter. A ship suitable for a particular container route may face limitations involving port draft, terminal equipment, reefer connections or the dimensions of navigational infrastructure. Tankers face different compatibility requirements involving cargo type, terminal arrangements, vessel age, vetting and charter-party conditions. The existence of nominal excess tonnage in one segment of the global merchant fleet therefore does not guarantee capacity can be substituted into another segment.
The World Bank’s historical estimate that Cape diversions could absorb between 700,000 and 1.9 million TEUs of container-shipping capacity should be read in this context. It describes the loss of effective carrying availability associated with longer service rotations, not physical destruction of containers or vessels. The same ships and containers may continue to exist, yet a greater proportion of their productive time is consumed by the additional distance. This creates a divergence between nominal fleet capacity and commercially available capacity during a given period. It also explains why the delivery of new container vessels does not necessarily produce an immediate reduction in freight rates when routing disruptions absorb the additional tonnage. Will a Prolonged Rerouting of Ships from Suez Trigger a New Supply Chain Crisis? — World Bank — January 2024.
Illustrative vessel requirements under longer service rotations
The following calculation isolates the mechanical effect of voyage duration on the minimum vessel requirement for a scheduled weekly service. It is a planning sensitivity, not a measurement of operator deployments during October 2026.
| Complete service rotation | Minimum vessels for weekly departures | Additional vessels versus 70-day baseline | Increase in vessel requirement |
|---|---|---|---|
| 70 days | 10 | 0 | Baseline |
| 77 days | 11 | 1 | +10% |
| 84 days | 12 | 2 | +20% |
| 91 days | 13 | 3 | +30% |
| 98 days | 14 | 4 | +40% |
Calculation: minimum vessels = ceiling of complete rotation duration divided by seven days. Assumptions: uninterrupted weekly departures, one vessel per departure, uniform rotation duration and no additional reserve vessels beyond those implicit in the schedule. The table does not include temporary blank sailings, maintenance reserves, variable port productivity or vessel-size differences.
This calculation illustrates why even a relatively modest extension of voyage duration can create nonlinear fleet requirements. A service that already possesses some schedule slack may absorb a limited disruption without acquiring another vessel. Once the cumulative rotation exceeds the number of ship-weeks supported by the existing fleet, however, maintaining weekly departures requires additional tonnage or a change in service design. The resulting capacity adjustments do not occur continuously; they are influenced by the integer number of vessels needed to complete a rotation. This can create periods when a small additional delay has little immediate effect, followed by a threshold at which an extra ship becomes commercially necessary.
There is also an important difference between one-way diversion time and complete service rotation time. The seven-to-ten-day extension historically estimated for a typical Europe–Asia trip cannot automatically be inserted as the increase in a full round-voyage rotation. Depending on the service, both outbound and inbound voyages may be diverted, or the route may change asymmetrically because of port sequences and directional operating conditions. Maersk’s July 2026 MECL announcement demonstrates that directional differences can be material, with a seven-day average improvement westbound and fourteen days eastbound after returning to the Red Sea route. A rotation model must therefore sum the specific effects in both directions and incorporate any changes to port calls, rather than multiplying a generic route estimate without examining the actual service. Structural Changes to MECL — Maersk — July 2026.
Bunker Fuel, Charter Costs and the Financial Structure of Diversion
The financial consequences of rerouting consist of several distinct components that should not be collapsed into a single percentage increase in freight rates. Additional nautical miles create a direct fuel requirement, while longer vessel employment increases time-related costs such as charter hire or the opportunity cost of using an owned vessel. Extended voyage duration can also increase crew-related expenses, provisioning, maintenance exposure, equipment-cycle times and cargo financing requirements. Depending on the route and contractual structure, these costs may be partly offset by changes in canal tolls, security-related charges or port expenses. The net economic result is therefore specific to the vessel and voyage.
Bunker expenditure is particularly sensitive to fuel type, market prices and operating speed. Container ships, tankers and bulk carriers differ substantially in their daily fuel consumption, and even vessels within the same class may have different propulsion efficiencies and loading profiles. For this reason, estimating the fuel cost of Cape diversion by assigning one daily consumption figure to every ship would create false precision. A more defensible calculation begins with the additional nautical miles, the intended operating speed and a vessel-specific daily fuel-consumption estimate. The resulting additional days can then be multiplied by the relevant bunker consumption and delivered bunker price. Any comparison with the Suez route should also deduct avoided canal tolls and other charges that would no longer be incurred, while adding any additional port, handling or insurance costs associated with the alternative route.
A standard calculation of the direct incremental voyage cost can be organised as follows:
\[ \Delta C = \Delta F + \Delta T + \Delta P + \Delta I + \Delta H – C_{\mathrm{avoided}} \]
Here, \(\Delta F\) represents additional bunker expenditure; \(\Delta T\) represents additional vessel-time costs; \(\Delta P\) represents changes in port and navigation charges; \(\Delta I\) represents incremental insurance-related expenditure; and \(\Delta H\) represents additional cargo handling or other route-related charges. \(C_{\mathrm{avoided}}\) includes charges no longer incurred under the original route. The equation is an accounting framework, not an empirically estimated model, and requires voyage-specific inputs before an actual cost can be calculated.
The following sensitivity illustrates how longer sailing time translates into fuel expenditure, using explicitly hypothetical inputs rather than claiming to reproduce commercial bunker quotations.
Illustrative incremental bunker expenditure
Assumptions: additional sailing time of 7, 10 or 14 days; daily bunker consumption of 50, 75 or 100 metric tonnes; illustrative bunker price of US$600 per metric tonne. The values are hypothetical planning inputs, not observed October 2026 prices or documented vessel consumption.
| Additional sailing time | 50 tonnes/day | 75 tonnes/day | 100 tonnes/day |
|---|---|---|---|
| 7 days | $210,000 | $315,000 | $420,000 |
| 10 days | $300,000 | $450,000 | $600,000 |
| 14 days | $420,000 | $630,000 | $840,000 |
The calculated expenditure is the product of additional days, fuel consumption per day and the assumed bunker price. It excludes port charges, charter hire, canal-toll savings, insurance, waiting time and differences in operating speed.
These calculations demonstrate why freight-price transmission cannot be evaluated through oil prices alone. Higher fuel prices increase the monetary cost of additional consumption, but even stable fuel prices do not eliminate the productivity loss associated with longer voyages. Conversely, the net additional cost of a Cape diversion may be lower than the gross bunker calculation if it avoids expensive canal tolls or exceptional security charges. The economic decision is therefore based on the full voyage contribution, which includes the additional operating costs, the commercial value of the cargo and the revenue opportunities sacrificed by tying up a vessel for longer.
Charter markets introduce another layer of volatility. An operator using chartered vessels may face additional exposure when charter rates increase during periods of constrained effective capacity. A company operating owned vessels faces a different accounting structure but still incurs opportunity costs because the vessel cannot be deployed elsewhere while completing its longer rotation. These effects can vary substantially between carriers depending on their fleet composition, ownership structure, contract maturities and operational flexibility. A company with a large share of long-term chartered capacity may experience a different cost trajectory from one dependent on short-term spot fixtures. Neither structure is universally superior: long-term commitments can reduce immediate price volatility but may become expensive if market conditions normalise, while spot-market exposure can preserve flexibility but leave operators vulnerable to sudden scarcity.
The World Bank’s earlier analysis of Red Sea disruption documented a sharp increase in supply-chain stress and freight costs associated with the withdrawal of shipping capacity from shorter routes. Its findings establish the economic mechanism through which route displacement can affect freight prices, although historical price changes should not be transferred mechanically to the different supply, demand and fleet conditions prevailing in 2026. Will a Prolonged Rerouting of Ships from Suez Trigger a New Supply Chain Crisis? — World Bank — January 2024.
War-Risk Insurance and the Difference Between Insurable and Commercially Viable Transit
Insurance represents one of the most consequential but frequently misunderstood dimensions of maritime disruption. A shipping route may remain physically navigable while becoming commercially unattractive because insurance terms increase the expected financial exposure of a voyage. Marine insurance typically involves different categories of coverage, including hull and machinery, cargo liabilities, protection and indemnity arrangements, and additional war-risk provisions. These policies do not respond to every event in the same manner, and their coverage depends on the specific wording, exclusions, geographical designations and contractual obligations involved. War-risk pricing can therefore affect not only the cost of a single voyage but also whether a shipowner is willing or legally able to undertake it.
The relevant commercial issue is the combination of premium level, cover availability, deductibles, exclusions and the circumstances under which insurance may be cancelled or modified. A modest additional premium does not necessarily create a binding constraint if cargo margins and available freight rates are sufficient to absorb it. More restrictive cover can have a much greater effect if an underwriter excludes a particular voyage, limits recovery for specified risks or requires security arrangements that are operationally difficult to obtain. A charterer may be willing to pay a higher freight rate without being able to secure a commercially acceptable vessel if the shipowner’s insurance, financing or internal safety requirements prohibit the movement. Consequently, the absence of a published increase in average premiums should not be interpreted as evidence that insurance availability is unrestricted.
Commercial insurance terms also interact with contractual risk allocation. Voyage-charter arrangements, time-charter contracts and liner carriage agreements may distribute additional war-risk expenses differently. Certain contracts provide mechanisms for passing additional premiums or extraordinary operating costs to charterers, while others rely on negotiated adjustments or specified geographical restrictions. The interpretation depends on the actual contract and applicable law. A standard clause cannot be assumed to govern every shipment, and an operator’s public surcharge announcement does not establish the treatment of all existing contracts.
The analytical distinction is particularly important for assessing the restoration of shipping through Hormuz. A credible reopening requires more than a decline in reported attacks. Shipowners and insurers must have sufficient confidence to support repeated voyages under terms that permit ordinary commercial operations. This confidence may take time to recover because the underwriting assessment reflects not only recent incidents but also the potential severity of a future loss, the value of cargo and hulls, and the capacity of emergency responders to manage damage in a contested environment. The continued registration of damaging attacks by the International Maritime Organization through October demonstrates the existence of a material underlying security exposure, but the IMO incident database does not establish a standardised October insurance-premium series. Middle East — Highlighted Confirmed Maritime Incidents — International Maritime Organization — October 2026.
Insurance and maritime cost exposure by contractual component
| Cost or risk component | Economic mechanism | Relevant commercial evidence | Principal decision consequence |
|---|---|---|---|
| War-risk additional premium | Raises the insured voyage cost | Actual quotation and geographical terms | Determines incremental voyage expense |
| Cover exclusion | Removes or limits protection for a specified exposure | Policy wording and endorsement | May make a voyage commercially infeasible |
| Deductible increase | Transfers more potential loss to the insured | Deductible schedule | Changes retained-loss exposure |
| Charter-party war-risk clause | Allocates specified expenses and operational choices | Executed charter agreement | Determines which counterparty bears costs |
| Cargo insurance conditions | Changes protection for the cargo owner | Cargo policy and endorsements | Affects financing and shipment acceptability |
| Vessel financing restrictions | May restrict entry into designated waters | Loan and financing covenants | Can prevent a voyage irrespective of freight income |
| Port and terminal liability | Changes exposure during loading, storage or discharge | Terminal contract and insurance arrangements | Influences alternative-port selection |
| Emergency response and salvage | Determines response costs after damage | Applicable cover and service availability | Affects tail-risk severity and recovery |
No numerical October 2026 comparison of premiums is assigned to these components because a verified, like-for-like quotation series covering comparable vessels, voyages and insurance conditions has not been established. Any attempt to present a single percentage premium applicable to all ships would obscure material differences in vessel value, cargo, flag, ownership, voyage direction and coverage.
Container Imbalances, Transshipment Networks and the Disappearance of Effective Equipment Capacity
The consequences of maritime disruption extend beyond the number of ships operating on international routes. Container logistics depends on the continuous circulation of equipment between exporters, importers, inland depots, ports and transshipment centres. A twenty-foot or forty-foot container is not economically useful simply because it exists within the global equipment fleet. It must be located where the next shipment is required, meet the cargo’s technical specifications, remain available for loading and be capable of reaching its intended destination within the required commercial period. Route diversions disrupt that circulation by changing transit times, repositioning opportunities and the sequence of ports through which equipment passes.
This mechanism can generate shortages and surpluses simultaneously. An exporting region may face insufficient empty containers while an importing region accumulates equipment awaiting collection or repositioning. A congested transshipment hub may hold containers that are technically available but cannot be accessed promptly because of yard restrictions, insufficient handling capacity or missed feeder connections. A carrier may have sufficient containers in aggregate but lack the correct equipment type, such as refrigerated units, tank containers or suitable high-cube boxes, at the point where customers require them. The resulting equipment imbalance can create costs even when the overall number of boxes has not changed.
The increase in transit time affects the financial productivity of the container fleet. A container that completes a round-trip operating cycle in sixty days can theoretically complete approximately 6.1 cycles per year under continuous utilisation. If the same operating cycle extends to eighty days, annual theoretical turnover falls to approximately 4.6 cycles. This represents a reduction of 25% in annual circulation frequency, before accounting for additional waiting, repair, customs or inland delivery delays. The calculation is illustrative, but it identifies an important structural constraint: longer logistics cycles reduce the number of shipments that can be supported by the same physical equipment stock.
Container circulation sensitivity
| Complete equipment cycle | Theoretical annual cycles per container | Change versus 60-day baseline |
|---|---|---|
| 60 days | 6.08 | Baseline |
| 70 days | 5.21 | −14.3% |
| 80 days | 4.56 | −25.0% |
| 90 days | 4.06 | −33.3% |
| 100 days | 3.65 | −40.0% |
Calculation: 365 days divided by complete equipment-cycle duration. These are theoretical turnover rates, not measured 2026 fleet utilisation. The calculation assumes uniform cycles and excludes seasonal inactivity, equipment repair and positioning mismatches.
The practical implication is that a carrier attempting to maintain the same annual container volume under longer circulation times may require additional equipment or faster returns from customers. Both measures impose costs. Additional containers involve purchase or leasing expenditure and eventual repositioning liabilities. Faster returns may require changes to customer detention arrangements, inland transport coordination or warehouse processes. Where importers face delays in unloading or returning equipment, carriers may experience additional shortages at export origins. These conditions can create disputes over demurrage, detention and free-time arrangements, particularly when delayed deliveries arise from events outside the immediate control of the customer.
The structure of modern liner shipping intensifies these effects because transport networks depend on synchronised long-haul and feeder services. A container arriving at a transshipment port must often be transferred to another vessel within a defined connection window. When the first vessel arrives late, the container may miss its intended onward departure and remain in the terminal until a later service becomes available. This introduces a discontinuity in delivery time: a delay of several hours on the first leg can result in several additional days of total transit if the connection is missed. Such delays are particularly consequential for supply chains using scheduled production inputs, seasonal consumer goods or temperature-controlled products.
The conditions reported around Colombo in October 2026 illustrate the importance of these interconnections. Hapag-Lloyd’s Week 44 operational update reported yard densities exceeding 110% across terminals, an inter-terminal transfer backlog of more than 50,000 TEUs and berthing delays of up to 24 hours at the identified terminals. The carrier also documented changes in terminal calls for individual vessels, including calls at SAGT instead of CWIT and additional partial-loading operations. These observations show that the ability to accommodate ships does not depend solely on available berths. It also depends on the successful movement of containers between terminals and the maintenance of onward vessel connections. The reported conditions were additionally affected by adverse weather, which means they should not be attributed exclusively to geopolitical disruption. Week 44 — Middle East Operational Update — Hapag-Lloyd — October 2026.
Port Congestion and the Migration of Bottlenecks Across the Indian Ocean
Port congestion is one of the principal mechanisms by which a localised maritime-security crisis becomes a distributed logistics problem. When vessel operators modify routes, cancel scheduled calls or transfer cargo through different hubs, the additional activity is not distributed evenly across available terminals. It concentrates at locations that possess suitable deep-water access, container-handling equipment, onward shipping connections and inland distribution capabilities. Such ports can become critical nodes in emergency transport networks even if their original capacity planning did not anticipate the resulting demand.
The operational record for October 2026 provides evidence of differentiated constraints across the Gulf, Arabian Sea and Indian Ocean. Hapag-Lloyd’s Week 44 report identified Salalah yard density of 84%, with berthing delays reaching 36 hours. Jeddah recorded yard density of 76% and reefer capacity utilisation of 61%. Dammam and Umm Qasr reported no current delays in the carrier’s assessment, although planning remained subject to case-by-case treatment because of the regional situation. Upper Gulf terminals faced expected delays of 24–48 hours associated with weather and operating conditions, while Sohar and Bahrain were subject to reported multi-day berth delays. Indian ports including Mundra and Nhava Sheva also faced yard utilisation above 70%, while Colombo exhibited substantial congestion and inter-terminal transfer difficulties. These figures demonstrate that the operational environment was heterogeneous rather than uniformly dysfunctional. Week 44 — Middle East Operational Update — Hapag-Lloyd — October 2026.
The comparison between Salalah and Colombo is particularly informative. Salalah’s 84% yard density suggests significant pressure on available terminal space, while Colombo’s reported density exceeding 110% reflects a different congestion condition and potentially different terminal reporting conventions. The values should not be used to rank operational efficiency without knowing the precise definitions of yard capacity, storage utilisation, operating thresholds and equipment deployment at each terminal. Nevertheless, both observations support the conclusion that alternative transit hubs can become capacity-constrained as cargo is redistributed across the maritime network.
The congestion mechanism becomes more complex when ports handle a combination of scheduled cargo and diverted shipments. A terminal’s commercial efficiency depends on predictable arrival times and coordinated use of berths, cranes, storage areas and inland connections. An unexpected concentration of vessels can interfere with the sequence of planned operations. If a vessel occupies a berth longer than anticipated, later arrivals may be delayed even when their own cargo volumes are unchanged. If a terminal accepts additional transshipment boxes but onward feeder services do not have sufficient capacity, containers accumulate in the yard. If customs or bonded-transport procedures delay inland release, available storage space declines. The result is a potential feedback loop in which congestion causes delays, delays increase cargo accumulation and accumulated cargo further reduces terminal productivity.
Selected terminal conditions, October 2026
| Port or location | Operator-reported condition | Operational measure | Interpretation |
|---|---|---|---|
| Jebel Ali, UAE | Ad hoc vessel calls | No comparable delay average provided | Restricted service regularity |
| Jeddah, Saudi Arabia | Elevated yard occupation | 76% yard density | Pressure on storage and handling capacity |
| Jeddah, Saudi Arabia | Reefer equipment utilisation | 61% | Relevant to temperature-controlled cargo planning |
| Salalah, Oman | Congestion affecting productivity | 84% yard density | Constraint on alternative hub operations |
| Salalah, Oman | Berthing delays | Up to 36 hours | Additional schedule uncertainty |
| Dammam, Saudi Arabia | No delays reported; case-by-case planning | Qualitative operator status | Continued uncertainty despite absence of observed delays |
| Umm Qasr, Iraq | No delays reported; case-by-case planning | Qualitative operator status | Operating access subject to monitoring |
| Upper Gulf | Weather-related disruption | Expected delays of 24–48 hours | Non-security constraints compound transport uncertainty |
| Sohar, Oman | Berth congestion | Approximately 2–3 days | Potential multi-day delay for affected cargo |
| Bahrain | First-in, first-out berth allocation | Up to 2 days | Waiting-time exposure |
| Mundra, India | Elevated terminal occupation | Above 73% yard density | Constrained alternative handling capacity |
| Nhava Sheva, India | Elevated terminal occupation | Above 72% yard density | Weather and congestion exposure |
| Colombo, Sri Lanka | Severe reported congestion | Yard density above 110% | Significant transshipment pressure |
| Colombo, Sri Lanka | Inter-terminal transfer backlog | Above 50,000 TEUs | Risk of missed connections and cargo accumulation |
Source: Week 44 — Middle East Operational Update — Hapag-Lloyd — 30 October 2026.
The reported conditions also illustrate why the capacity of an alternative corridor cannot be calculated by adding the nominal annual capacities of the ports located along it. Terminal capacity may be physically substantial but commercially unavailable at the time when diverted cargo arrives. A port may be able to unload a vessel but lack the required space or inland connections to clear the containers promptly. Another terminal may have adequate yard capacity but be unable to accommodate the arrival sequence of larger vessels without disrupting scheduled services. The relevant capacity is therefore the marginal amount of additional cargo that can be accommodated while maintaining acceptable handling times and onward connections.
The evolving service schedules provide further support for this interpretation. Hapag-Lloyd’s Week 41 update documented the omission of a westbound Jeddah call by Marit Maersk, with discharge rescheduled to an eastbound ad hoc call, and the omission of a Colombo call by Marie Maersk, whose cargo was instead to be transshipped at Salalah. These were specific voyage-management decisions rather than evidence of a uniform network-wide strategy. They show how operators use service-specific modifications to accommodate constrained terminals while attempting to preserve broader network functionality. Week 41 — Middle East Operational Update — Hapag-Lloyd — 6 October 2026.
Inland Corridors and the Commercial Limits of Maritime Substitution
The development of inland alternatives is a necessary response when a maritime hub becomes difficult to access, but a landbridge introduces an entirely different set of capacity, regulatory and commercial constraints. An ocean-going vessel can transport thousands of containers in a single movement, while road transport typically requires many separate vehicle journeys to move an equivalent volume. Rail can provide much larger unit-train capacity, but only where infrastructure, terminals, customs arrangements and suitable train paths are available. Consequently, a road or rail corridor cannot be assumed to provide a scalable substitute for a major maritime gateway merely because two ports are connected by land.
Maersk’s October operational disclosures provide concrete evidence of efforts to use combined maritime and inland routing to maintain cargo movements within the Gulf region. The company described alternative pathways involving Salalah and Khor Fakkan, bonded land transport toward Sharjah and subsequent feeder connections to regional destinations. It also referred to the established Jeddah landbridge solution for cargo destined to Saudi Arabia, including Riyadh and Dammam. These arrangements are important because they demonstrate that the response to maritime restrictions increasingly involves the integration of maritime services, customs-controlled inland movement and regional distribution. However, the carrier explicitly indicated that these services remained subject to availability and applicable regulatory conditions, while certain inland bookings could be temporarily suspended. This confirms that alternative inland capacity is a contingent operating resource rather than a guaranteed replacement for ordinary port access. Maersk Operations Updates on the Situation in the Middle East — Maersk — October 2026.
The economic feasibility of landbridges depends on the characteristics of the cargo. High-value manufactured components, urgent industrial inputs and selected consumer goods may justify additional handling and inland transport charges because the avoided cost of delay exceeds the incremental expenditure. Low-value bulk commodities may be less suitable where the additional cost per tonne represents a substantial share of the cargo’s commercial value. Temperature-controlled shipments require compatible equipment and reliable power arrangements throughout the inland journey. Hazardous goods may face restrictions involving storage, handling and cross-border transportation. Oversized equipment requires specialised vehicles, route surveys and permits, while liquid bulk may require pipelines, tank vehicles or compatible rail infrastructure rather than ordinary container transport.
Customs processes create an additional constraint. A bonded movement depends on recognised procedures for transporting goods under customs control, the availability of authorised operators and the ability of the relevant authorities to process cargo across jurisdictional boundaries. Differences in documentation requirements, transit guarantees, inspection procedures and electronic systems can produce delays even where the physical transport capacity is available. In an emergency, businesses may underestimate these requirements because the alternative corridor appears geographically straightforward. Yet the commercial viability of the route depends on the complete legal and operational chain between origin and final destination.
The financial effect of inland substitution must therefore be assessed at the shipment level. A lower ocean freight quotation to an alternative port can be outweighed by additional terminal handling, trucking, bonded clearance, storage and container-return charges. Conversely, a higher total transport cost may be economically preferable when it prevents production interruption or preserves a critical delivery commitment. The proper comparison is not ocean freight against ocean freight, but total landed logistics cost adjusted for reliability, working capital and the economic consequences of delayed cargo availability.
Alternative transport options by cargo characteristics
| Cargo category | Potential alternative | Main capacity requirement | Principal additional cost | Operational limitation |
|---|---|---|---|---|
| Standard containerised goods | Alternative port plus bonded road transport | Trucking, terminal capacity, customs clearance | Additional handling and inland freight | Vehicle availability and border processing |
| High-value manufacturing inputs | Expedited multimodal transport | Reliable schedules and suitable handling | Premium logistics and inventory management | Limited scalability for high volumes |
| Temperature-controlled food and pharmaceuticals | Reefer container plus compatible inland equipment | Power, monitoring and reefer-capable vehicles | Energy, specialised handling and delay protection | Cold-chain continuity |
| Project cargo | Heavy-lift vessel and specialised land movement | Route permits, lifting equipment and road capacity | Engineering, escorts and specialised transport | Physical dimensions and infrastructure restrictions |
| Liquid chemicals | Chemical-compatible tanks, terminals and transport | Qualified storage and handling facilities | Cleaning, handling and specialised logistics | Product compatibility and safety requirements |
| Refined petroleum products | Alternative maritime delivery or appropriate pipeline/land transport | Product storage and compatible facilities | Terminal, transport and inventory expense | Scale and fuel-specification constraints |
| Dry bulk commodities | Alternative bulk terminal and rail or road connections | High-volume handling and inland carrying capacity | Additional tonne-kilometres | Large-volume substitution is often difficult |
The commercial merit of each alternative depends on whether its capacity is available when the disruption occurs. An emergency route that is technically feasible but requires weeks of new commercial arrangements may not provide meaningful continuity for cargo needed within days. The relevant preparedness measure is therefore not simply identifying possible alternatives but establishing the associated contracts, customs permissions, equipment requirements and operating procedures in advance.
The Global Redistribution of Maritime Capacity: Shipping Lines, Alliances and Competitive Positioning
The maritime consequences of the crisis are not evenly distributed across shipping companies because operators differ in fleet ownership, charter commitments, route portfolios, vessel characteristics and their capacity to redesign networks. A carrier serving a large number of ports through an integrated network may be able to redistribute cargo among alternative hubs, but its scale also creates extensive interdependencies: delays in one service can affect feeder networks, transshipment connections and equipment positioning elsewhere. A more specialised operator may have fewer alternatives but also fewer network-wide exposures. These differences create a competitive adjustment process in which effective transport capacity, schedule reliability and access to constrained infrastructure may become more important than nominal fleet size.
The distinction is especially relevant to liner alliances and vessel-sharing arrangements. When multiple carriers coordinate vessel deployment, a change to one service can affect cargo bookings and operational commitments across several commercial entities. The substitution of a terminal call, the omission of an intermediate port or the reallocation of a vessel may alter the availability of capacity for customers whose commercial relationship is with a carrier other than the operator of the ship. Consequently, the ability of a carrier to advertise service coverage does not necessarily establish that every originally scheduled port call or connection remains available. Customers must distinguish between the published service network, actual vessel movements and confirmed shipment-level transport arrangements.
Hapag-Lloyd’s October disclosures illustrate the operational complexity. The carrier documented multiple individual changes involving the Gemini network, including revised calls at Colombo terminals and ad hoc loading operations. Its African update reported the continuing suspension of Jebel Ali calls on particular services, demonstrating that network access differed by service even when the same geographical market remained commercially relevant. These decisions should be understood as attempts to preserve functioning connections within a constrained system rather than as evidence that all affected cargo was being transported through a single substitute route. Week 44 — Middle East Operational Update — Hapag-Lloyd — October 2026; Week 44 — Africa Operational Update — Hapag-Lloyd — October 2026.
Maersk’s decision to restore selected Red Sea services during July provides a complementary example of the benefits and limitations of commercial flexibility. The company reported the return of its MECL service to the trans-Suez route and separately announced changes to its WAF6 service connecting the Middle East, Mediterranean and West Africa. These announcements suggest that the carrier was willing to revise routing where its security assessments permitted, while retaining contingency arrangements should conditions deteriorate. The economic significance lies in the ability to shorten rotations and potentially release effective fleet capacity. However, these service-specific adjustments do not establish a general reopening of all routes or the restoration of unrestricted access to Persian Gulf ports. Structural Changes to MECL — Maersk — July 2026; Structural Changes to WAF6 — Maersk — July 2026.
These differences create a potential structural division in the freight market between operators capable of offering reliable integrated alternatives and those more dependent on individual corridors or short-term capacity procurement. The resulting commercial advantage is not necessarily determined by the lowest quoted freight rate. A shipper facing expensive production downtime may prefer a more costly but dependable transport solution, provided the carrier can demonstrate available capacity and credible delivery performance. Conversely, standardised cargo with flexible delivery requirements may remain more sensitive to freight price than to differences in schedule reliability.
The international redistribution of capacity also has implications for fleet investment and the future balance between vessel supply and demand. Additional ships delivered during a period of prolonged diversion can initially be absorbed by longer rotations. If maritime routes subsequently normalise, those vessels may become available for additional services or intensify competition on existing routes. This creates the possibility of a reversal in freight-market conditions: capacity that appeared scarce because of longer voyages can become relatively abundant once shorter routes are restored. Such a transition can put pressure on freight rates and on carriers that committed to additional capacity at elevated charter or financing costs.
The decision to acquire vessels, extend charters or build permanent infrastructure in response to temporary disruption therefore carries significant timing risk. Operators must distinguish investments that improve long-term network flexibility from commitments whose economic justification depends on disruption continuing for an extended period. The most resilient strategy is not necessarily to maximise capacity under the most severe scenario, but to maintain sufficient optionality to adjust when maritime conditions change.
Maritime Freight Contracts and the Distribution of Disruption Costs
Transport disruption becomes a commercial and financial problem when the additional costs cannot be allocated predictably among the parties involved in a shipment. International supply chains frequently involve separate relationships between sellers, buyers, carriers, freight forwarders, terminal operators, insurers and inland transport providers. The party responsible for arranging a shipment may not bear all the economic consequences of a delay, while the party suffering the greatest downstream loss may have limited contractual control over the affected transport service. This separation creates disputes concerning additional freight charges, route changes, cargo availability, delivery obligations and responsibility for extraordinary expenses.
For liner shipping, the relevant contractual provisions can include freight-adjustment mechanisms, bunker-related charges, security surcharges, exceptional routing provisions, demurrage and detention rules, and carrier liberties to change schedules or ports. Their effect depends on the actual contract and the applicable legal framework. A carrier may announce additional charges in response to conflict, but the amount recoverable under a particular commercial arrangement must be determined from the applicable terms. Similarly, a freight forwarder may offer an alternative routing without guaranteeing that every downstream cost is included in the initial quotation.
The economic exposure is greater where procurement and transport contracts are poorly aligned. A manufacturer may have agreed fixed prices with customers while purchasing inputs under arrangements that allow freight surcharges to be passed through immediately. A retailer may rely on delivery schedules that do not adequately account for extraordinary route changes. A supplier may remain contractually responsible for delivery despite lacking direct control over shipping operations. These arrangements can transfer cost and risk in ways that are not apparent from the headline freight rate.
For this reason, maritime disruption should be evaluated through a complete cost-to-serve framework covering transport expenditure, cargo handling, insurance, inventory financing, customs processing, delivery variability and the cost of contractual non-performance. A relatively inexpensive alternative route can become economically unattractive if its uncertainty creates production interruptions, while a higher-priced service may offer greater value if it reliably preserves critical supply. The relevant financial comparison should therefore include the economic consequences of delay rather than treating freight expenditure as an isolated procurement category.
Contractual risk-allocation matrix
| Contractual issue | Principal operational exposure | Required commercial evidence | Consequence of inadequate provision |
|---|---|---|---|
| Routing discretion | Carrier changes the planned itinerary | Applicable carriage or charter terms | Uncertain delivery commitments |
| Extraordinary freight charges | Conflict-related operating expenditure | Contractual surcharge mechanism | Unexpected procurement cost |
| Bunker adjustment | Fuel-price and consumption changes | Agreed bunker formula and reference index | Unpredictable fuel-cost pass-through |
| Port substitution | Discharge at an alternative terminal | Contractual discharge rights and delivery terms | Additional handling and inland transport |
| Insurance allocation | Increased premium or restricted cover | Policy and contract wording | Unfunded or disputed exposure |
| Equipment detention | Extended container occupation | Free-time and detention terms | Additional equipment charges |
| Delivery obligations | Late arrival of goods | Sale contract and applicable delivery terms | Penalties, disputes or customer disruption |
| Force-majeure provisions | Extraordinary interruption of performance | Governing law and contractual wording | Uncertain relief from contractual obligations |
| Alternative-carrier access | Primary operator cannot perform | Prearranged capacity and booking terms | Delayed emergency procurement |
| Customs and bonded transit | Alternative international routing | Authorisations and documentation | Border delays and cargo immobilisation |
This matrix is intended for commercial risk review rather than as a substitute for jurisdiction-specific legal advice. Its central implication is that logistical resilience depends not only on having an alternative physical route but also on the existence of enforceable arrangements permitting that route to be used without generating disproportionate contractual uncertainty.
Economic Consequences Through 2030: Temporary Disruption Versus Structural Reconfiguration
The evolution of maritime logistics through 2030 will depend on the duration and predictability of regional insecurity, the rate at which shorter corridors become commercially reliable and the extent to which companies institutionalise alternative transport arrangements. A short disruption primarily creates temporary operating costs, including diversions, fuel expenditure, missed connections and exceptional inventory requirements. A prolonged disruption can generate more durable adjustments: additional vessel deployment, revised service networks, different transshipment hubs, investment in inland corridors, renegotiation of freight contracts and changes in supplier geography.
The distinction is important because temporary costs and structural costs behave differently when security improves. Bunker consumption associated with additional sailing distance can decline promptly when the shorter route becomes available. The release of additional vessels from longer rotations can similarly expand effective transport capacity over subsequent service cycles. However, new terminal investments, extended charter commitments, reconfigured inland distribution systems and contractual changes may continue to influence commercial decisions long after the original route is restored. Companies may preserve alternative capacity because the expected economic loss from another interruption exceeds the cost of maintaining some redundancy.
A rapid and credible restoration of maritime security would therefore be expected to reduce distance-adjusted shipping demand on affected routes, improve vessel productivity and ease some capacity constraints. It would not necessarily restore every port call immediately, because carriers require time to reposition vessels, revise schedules and correct equipment imbalances. In contrast, a prolonged period of intermittent restrictions would encourage companies to maintain flexible routing arrangements and to price the possibility of disruption into freight procurement. Renewed high-intensity conflict would increase the risk that physical alternatives themselves become constrained, particularly if attacks affect terminals, energy infrastructure or transport connections previously used to bypass the most dangerous routes.
The historical experience documented by the World Bank and the operator disclosures from 2026 supports the mechanism but does not permit a precise global freight-rate forecast for 2030. The final outcome depends on new vessel deliveries, demand growth, fuel prices, available port capacity, the restoration of shorter routes and the commercial behaviour of carriers. These variables can reinforce or offset one another. More vessels may reduce scarcity, while longer routes increase demand for their capacity. Weaker goods demand may limit freight-rate increases despite higher operating costs, while congestion can create local shortages even when aggregate fleet capacity is adequate. The interaction makes a single universal forecast of shipping-cost inflation analytically indefensible without a route-specific model.
Structural evolution under alternative maritime conditions
| Dimension | Sustained route recovery | Intermittent disruption | Prolonged severe restrictions |
|---|---|---|---|
| Vessel productivity | Recovers as rotations shorten | Variable according to service and route | Remains constrained where diversions persist |
| Fleet requirements | Additional diversion-related tonnage gradually released | Flexible capacity remains valuable | More ships or fewer departures needed |
| Bunker expenditure | Lower on restored shorter routes | Sensitive to route switching and fuel prices | Elevated for sustained long diversions |
| Container circulation | Equipment cycles progressively shorten | Continuing repositioning imbalances | Longer occupation and greater equipment demand |
| Terminal congestion | Potentially eases after network adjustment | Shifts among alternative hubs | Persistent pressure on accessible terminals |
| Insurance conditions | May normalise with sustained safety evidence | Exceptional conditions remain possible | Cover may become restrictive or unavailable |
| Inland corridors | Retained as supplementary capacity | Used selectively for continuity | Greater reliance despite scale limitations |
| Freight contracts | More conventional procurement conditions | Higher value of flexibility and contingency clauses | Greater contractual uncertainty and capacity reservation |
| Capital investment | Focus on efficiency and selective resilience | Investment in adaptable networks | Pressure for major infrastructure substitution |
| Principal commercial risk | Cost of maintaining unnecessary redundancy | Repeated disruption and poor forecasting | Loss of physical or commercially viable access |
The scenario outcomes are qualitative. No numerical probabilities or freight-rate increases are assigned because the record does not establish comparable October 2026 market observations sufficient to calibrate them.
Key Judgments
The first judgment, with high confidence, is that maritime disruption reduces effective shipping capacity even when the physical merchant fleet remains intact. The relationship between longer voyage rotations and the number of vessels required to maintain scheduled service is established by transport economics, while the World Bank’s historical estimates and Maersk’s 2026 routing decisions provide empirical support for the magnitude and commercial relevance of route extensions.
The second judgment, with high confidence, is that the Cape of Good Hope provides an effective geographical substitute for selected Suez and Red Sea movements but not for direct maritime access to terminals inside the Persian Gulf. The distinction between avoiding Bab el-Mandeb and bypassing Hormuz is fundamental. Companies must therefore identify the particular geographical constraint affecting their cargo before treating Cape routing as a business-continuity solution.
The third judgment, with high confidence, is that alternative maritime hubs are already absorbing substantial operational pressure. Hapag-Lloyd’s October reporting documents significant yard utilisation, berth delays, inter-terminal transfer backlogs and changes to scheduled services. These conditions demonstrate that alternative capacity is constrained by terminal operations and onward connectivity, not merely by the availability of berths.
The fourth judgment, with medium-to-high confidence, is that the crisis is increasing the commercial value of flexible vessel deployment, multimodal alternatives and prearranged capacity. Carrier disclosures demonstrate actual route changes, service suspensions, revised port calls and landbridge arrangements. The scale of their commercial benefit remains contract- and cargo-specific.
The fifth judgment, with medium confidence, is that prolonged insecurity can produce structural changes in freight contracting, network design and infrastructure investment that outlast the original disruption. Longer charter commitments, revised service networks and alternative transport infrastructure may remain in place after maritime safety improves, creating adjustment costs and potentially changing competition among carriers and ports.
What Would Change the Assessment
The most important evidence of sustainable improvement would be a consistent reduction in route-specific travel times accompanied by the restoration of scheduled rather than exceptional vessel calls, lower terminal waiting times and more predictable inter-terminal transfers. A series of individual successful voyages would provide insufficient evidence if carriers continued to suspend major services or if alternative hubs remained congested. The stronger indicator would be the repeated completion of full commercial service rotations under ordinary operating conditions, supported by stable shipping schedules and commercially available insurance.
The assessment would also become more favourable if vessel operators reported the systematic return of services to shorter Red Sea and Suez routes without subsequent reversals, together with a measurable reduction in the number of vessels required to maintain weekly frequency. Evidence of shorter container-equipment cycles, fewer blank sailings and improved availability of empty containers at major exporting hubs would provide further support. Conversely, sustained suspension of Persian Gulf calls, new terminal restrictions, additional infrastructure attacks or persistent congestion at alternative gateways would strengthen the judgment that the crisis is becoming embedded in the international transport system.
The principal quantitative evidence gaps concern a harmonised October 2026 AIS-based series covering vessel numbers and tonnage by route and vessel class; comparable current war-risk insurance quotations for defined voyages; contemporaneous bunker price series at relevant ports; carrier-specific fleet deployment changes; container repositioning volumes; and port-to-port service reliability across the alternative corridors. These data would enable the calculation of route-specific incremental costs and effective fleet-capacity losses without relying on generic assumptions.
Chapter 4 — Final Net Assessment
The maritime consequences of Middle Eastern geopolitical instability are fundamentally a problem of transport-system productivity, rather than simply one of navigational distance. The reconfiguration of routes around the Cape of Good Hope changes the time required for vessels to complete commercial rotations, reduces the effective availability of fleet capacity and alters the distribution of cargo among ports and inland corridors. The resulting costs are transmitted through bunker consumption, charter commitments, insurance conditions, terminal handling, container circulation and contractual delivery obligations. These mechanisms can remain economically significant even where aggregate trade volumes are maintained and individual vessels continue to reach their destinations.
The documentary record establishes that such adjustments are not hypothetical. During 2026, major shipping operators modified their service networks, suspended selected Gulf calls, diverted vessels around southern Africa, restored particular Red Sea services when conditions permitted and expanded multimodal alternatives across the Gulf region. By late October, operational disclosures identified congestion, equipment backlogs and restrictions at several strategically important terminals. The relevant data demonstrate that maritime-network substitution is possible but not frictionless, and that alternative infrastructure has its own capacity limits.
For policymakers, the central implication is that the economic cost of maritime insecurity should be evaluated through the loss of effective transport capacity and reliability, rather than through the number of ships physically prevented from navigating a particular corridor. For shipping companies, the principal challenge is maintaining service frequency and network connectivity without committing excessive capital to capacity that may become redundant after route normalisation. For logistics directors and industrial purchasers, the decisive requirement is a realistic understanding of total transport cost, available alternative capacity and the contractual conditions governing disruption.
Through 2030, the strategic dividing line will be between transport networks that can reconfigure capacity without losing commercial continuity and those whose apparent cost efficiency depends on uninterrupted access to a limited number of maritime corridors. The former may incur higher preparedness costs but preserve greater operating flexibility. The latter may remain inexpensive during stable periods while being disproportionately exposed to sudden changes in route accessibility, shipping capacity and terminal performance.
Chapter 5. Energy-Price Transmission and Petrochemical Supply Chains
Principal Judgment: The Industrial Shock Is Transmitted Through Feedstock Availability, Processing Margins and Contractual Price Formation
The economic transmission of the Gulf crisis into manufacturing and consumer markets cannot be adequately measured by observing the international crude-oil benchmark alone. Brent and WTI prices provide important signals of petroleum-market conditions, but the cost of a manufactured product depends on a sequence of processing, transport and commercial relationships that can behave differently during disruption. Crude oil must be refined into products and petrochemical feedstocks; natural gas and natural-gas liquids provide alternative inputs for certain chemical processes; olefins and aromatics are converted into polymers and other intermediates; and these products enter packaging, automotive components, textiles, construction materials, agricultural inputs and consumer goods. Each stage has its own capacity constraints, inventories, energy requirements and contractual price mechanisms. The relevant industrial problem is therefore the combined exposure to price volatility and the physical availability of the correct feedstock or intermediate product.
The EIA’s October 2026 forecast provides the current energy-market reference point. Brent averaged $114 per barrel in September, after averaging $91 in August. The EIA associated the increase with renewed attacks against regional oil infrastructure and tankers, including the interruption of Saudi Arabia’s East–West pipeline. Its forecast placed Brent at $105 per barrel in the fourth quarter of 2026, approximately $87 in the second quarter of 2027 and $74 in the fourth quarter of 2027. These are forecast quarterly averages, not futures-market guarantees or observed October settlement prices. The assumptions include gradual improvement in export availability, bypass routes and ship-to-ship transfers. An infrastructure attack that undermines those assumptions could alter the price trajectory without requiring an equivalent change in global final demand. Global Oil Markets, October Short-Term Energy Outlook — U.S. Energy Information Administration — 6 October 2026.
The production figures provide a second dimension. The EIA estimated regional crude-oil shut-ins at 10.9 million barrels per day at their May 2026 peak, falling to 5.8 million barrels per day in August and 4.8 million in September. Its October outlook forecast an average of 4.5 million barrels per day shut in during the fourth quarter. These changes indicate partial recovery in available production, but they do not establish immediate restoration of downstream chemical output or the ability of every industrial purchaser to obtain normal material deliveries. A refinery can face feedstock constraints despite improvement in aggregate crude production, and a petrochemical facility may be limited by its own operating status, utilities, storage or available shipping. Global Oil Markets — U.S. Energy Information Administration — October 2026.
LNG Is a Separate Energy and Industrial Exposure
The LNG figures are particularly consequential because they reveal a sharper historical contraction than the aggregate petroleum-liquids data. According to the EIA, LNG movements through Hormuz declined from 10.5 billion cubic feet per day in the fourth quarter of 2025 to 0.8 billion cubic feet per day in the second quarter of 2026. The absolute decline was 9.7 billion cubic feet per day, equivalent to approximately 92.4%. These estimates concern movements through the Strait, not all global LNG production or consumption. Nevertheless, their scale demonstrates why the consequences of constrained Gulf exports cannot be assessed exclusively through oil-market indicators. Global Energy Security Data, Table 4 — U.S. Energy Information Administration — August 2026.
Natural gas serves as a direct energy input and as a source of feedstocks used in industrial chemistry. Changes in gas availability can affect power generation, process heat, industrial production costs and the economics of facilities dependent on gas-derived inputs. Yet the relationship between LNG supply and delivered industrial gas prices is influenced by regional contracts, storage, pipeline connections, regasification capacity and access to alternative supplies. A reduction in seaborne LNG movements through Hormuz cannot therefore be translated into a universal price increase for every importing economy. Markets with substantial alternative supply, storage or contractual flexibility may absorb disruption differently from those with limited infrastructure or concentrated sourcing.
The EIA’s data also reveal that LNG movements around the Cape of Good Hope increased from 6.0 billion cubic feet per day in the fourth quarter of 2025 to 9.7 billion in the second quarter of 2026. This change is consistent with important shifts in LNG transport geography, but it does not establish that the additional Cape movements were direct replacements for the volumes no longer passing through Hormuz. Origin-destination information, loading terminals, cargo ownership and the role of alternative exporters are needed to establish the precise substitution. The distinction matters because global LNG availability depends on liquefaction capacity and producing-country output, not merely on the routes chosen by existing LNG carriers. Global Energy Security Data, Tables 4 and 10 — U.S. Energy Information Administration — August 2026.
Historical energy-flow contraction by commodity
| Commodity movement through Hormuz | Q4 2025 | Q2 2026 | Absolute change | Percentage change |
|---|---|---|---|---|
| Crude oil and condensate | 15.9 million b/d | 3.7 million b/d | −12.2 million b/d | −76.7% |
| Refined petroleum products | 5.7 million b/d | 1.1 million b/d | −4.6 million b/d | −80.7% |
| LNG | 10.5 billion ft³/day | 0.8 billion ft³/day | −9.7 billion ft³/day | −92.4% |
Source: Global Energy Security Data, Table 4 — U.S. Energy Information Administration — August 2026. Percentage changes are calculated from published rounded figures. LNG and petroleum units are not interchangeable and must not be added.
Naphtha, Ethane and the Differing Economics of Petrochemical Production
Petrochemical production is not a single processing chain. Steam crackers can use naphtha, ethane, propane or other suitable feedstocks, but their economics and product yields differ depending on facility configuration and input composition. A naphtha-based cracker is connected more directly to petroleum refining and liquid feedstock markets, while an ethane-based cracker depends on the availability and economics of suitable natural-gas liquids. These distinctions influence the effect of crude-price changes on chemical output. A rise in Brent can increase naphtha costs, but the resulting change in polyethylene, polypropylene or other polymer prices also depends on competing feedstocks, demand, inventories and available processing capacity.
A company purchasing polyethylene should therefore monitor more than the quoted price of crude. Its exposure may depend on the specific polymer grade, the cracker feedstock used by its supplier, regional import availability, production outages and the ability to qualify another grade without impairing the finished product. Similarly, a converter producing packaging may experience higher resin prices without being able to pass them immediately to customers under existing contracts. The financial consequences arise through the timing and extent of price adjustment as well as the cost of the underlying material.
Different polymers transmit the shock through different industrial processes. Polyethylene enters films, bags, bottles and numerous industrial components. Polypropylene is important in rigid packaging, automotive applications, consumer goods and technical materials. Polyethylene terephthalate, polystyrene and other plastics involve additional processing chains and feedstocks. An energy-market shock does not generate identical price changes across these products. The availability of substituted materials is constrained by mechanical properties, food-contact requirements, processing equipment, barrier performance and commercial qualification.
This limits the effectiveness of procurement measures based solely on supplier quotations. A lower-priced substitute resin is economically useful only if its technical properties permit production without creating unacceptable quality, safety or regulatory consequences. Where the substitute requires modification of tooling, production temperatures, product design or regulatory approval, the transition may take longer than the disruption itself. Conversely, previously qualified alternatives can provide immediate resilience because they avoid the need to conduct emergency product validation during a shortage.
From Refinery and Chemical Costs to Packaging and Retail Prices
The transmission of petrochemical prices into retail goods occurs through several stages, and the effect of each stage depends on the proportion of the finished product’s cost represented by the relevant input. A change in resin prices is significant for a manufacturer whose product consists mainly of polymer, but it may represent a relatively small share of the retail price of a complex branded consumer good. Similarly, a rise in marine fuel costs affects the transport component of a product’s landed cost, not necessarily its entire selling price. Treating a percentage increase in one input as an equivalent increase in the final product price would exaggerate the transmission.
A useful accounting distinction separates direct material costs, production energy, packaging conversion, freight, warehousing and retail distribution. Each component can be affected by geopolitical disruption, but through different mechanisms and at different times. A producer may pay more for feedstocks immediately while continuing to sell finished products under prices negotiated months earlier. A retailer may face higher wholesale prices only when contracts are renewed. An importer may incur additional freight costs before the goods enter inventory, while the ultimate consumer-price effect depends on competition, margins and demand.
The relevant financial exposure can be examined through a material-cost share rather than assuming uniform price pass-through. For example, if resin accounts for 40% of a packaging converter’s unit production cost, a hypothetical 20% increase in resin expenditure would increase total unit cost by approximately 8% before any other changes, assuming unchanged input quantities and other costs. This is a mathematical sensitivity, not an observed 2026 price movement. If energy, financing and logistics costs also increase, the final unit-cost effect would differ. The example demonstrates why identifying cost shares is necessary before drawing conclusions about downstream inflation.
Industrial price-transmission matrix
| Input or cost driver | First affected stage | Transmission mechanism | Principal moderating factor | Typical commercial exposure |
|---|---|---|---|---|
| Brent / crude prices | Refining and petroleum feedstocks | Changes in crude acquisition costs | Refining margins and inventories | Refiners and naphtha buyers |
| Natural gas / LNG | Energy and gas-based chemical production | Fuel and feedstock availability | Alternative supply and storage | Energy-intensive producers |
| Naphtha | Steam crackers | Olefin production economics | Alternative feedstock configuration | Polymer producers |
| Ethane | Ethane-based crackers | Ethylene production economics | Feedstock and plant configuration | Ethylene and polyethylene producers |
| Ethylene | Polymer production | Polyethylene and derivative costs | Polymer inventories and competition | Resin manufacturers |
| Propylene | Polymer and chemical production | Polypropylene and derivative costs | Supply from multiple production routes | Industrial converters |
| Marine fuel | Ocean freight | Vessel operating expenditure | Vessel efficiency and contracts | Carriers, importers and exporters |
| Road diesel | Inland distribution | Trucking and last-mile costs | Route optimisation and contract terms | Distributors and retailers |
| Financing rates | Inventory holding | Cost of working capital | Cash reserves and financing terms | Importers and manufacturers |
| Insurance and risk charges | International transport | Incremental voyage expenditure | Risk mitigation and policy terms | Cargo owners and carriers |
The matrix identifies economically established pathways but does not imply a verified universal elasticity between any two prices. Quantification requires comparable regional price series, product grades, cost shares and contract periods.
Fertilizers and the Food-Supply Consequences of Energy Disruption
Fertilizers represent a particularly important extension of the energy-security problem because natural gas is a major feedstock and energy source in ammonia production, which supports nitrogen-fertilizer manufacturing. Disruption of gas availability or changes in its price can therefore affect the economics of fertilizer supply. However, the extent of the resulting agricultural effect depends on production location, the type of fertilizer, inventories, import availability and the timing of crop-application periods. A price increase that occurs outside a major purchasing season may have different consequences from a shortage coinciding with the period when farmers must acquire inputs.
The transmission from fertilizer costs to food prices is neither instantaneous nor proportional. Farmers may adjust purchasing, application or crop decisions, while food processors and retailers face subsequent price changes influenced by yields, transport, inventories and consumer demand. The consequences can be more acute in importing economies with limited foreign-exchange capacity or concentrated fertilizer suppliers, although the present record does not establish a specific national percentage increase attributable to the 2026 Gulf crisis. The appropriate assessment therefore identifies the physical and financial mechanisms without inventing country-level losses.
For policymakers, the distinguishing feature of fertilizers is that delayed availability can have consequences extending beyond the immediate month of disruption. A manufacturing facility may be able to replace a late input in its next production cycle, but an agricultural input that misses a critical application window can affect the economics of an entire season. Such temporal constraints increase the commercial value of reliable delivery and strategically located inventories, even when holding those inventories imposes additional financing and storage costs.
Distinguishing Temporary Price Spikes from Structural Cost Changes
A temporary supply interruption can generate a pronounced market-price movement without permanently changing the underlying cost structure. Once production resumes, inventories recover and freight conditions improve, some extraordinary costs may diminish. Structural changes occur where participants revise contracts, supplier geography, inventory practices or investment decisions because the perceived probability of future disruption has changed. These adjustments can persist even when the original price shock declines.
The EIA’s October outlook anticipated lower Brent prices during 2027 as regional production recovered and inventories rebuilt, but it simultaneously warned that continuing fluctuations in regional exports could generate short-term price volatility. This creates an important distinction for industrial procurement: a falling forecast average does not exclude sharp temporary price increases, and a lower crude benchmark does not establish the restoration of predictable chemical deliveries. Global Oil Markets — U.S. Energy Information Administration — October 2026.
Structural contractual changes may include broader price-adjustment clauses, altered indexation periods, revised inventory obligations and longer-term qualification of alternative suppliers. Their commercial value depends on the allocation of risk. A contract that fully transfers price volatility to a supplier may appear attractive to a purchaser but become unreliable if the supplier lacks sufficient financial resources to absorb the exposure. Conversely, a purchasing agreement that permits unlimited surcharges may preserve supplier performance while transferring unpredictable costs to the customer. Durable resilience requires a commercially sustainable distribution of risk rather than its nominal transfer to the weaker counterparty.
Chapter 5 — Net Assessment
The energy shock of 2026 is distinguished by the interaction of constrained petroleum exports, severe historical contraction in LNG movements and the vulnerability of infrastructure intended to restore supply. The EIA’s figures establish large changes in physical energy movements, while its October outlook demonstrates the conditional character of anticipated price recovery. These observations support a high-confidence judgment that industrial cost exposure cannot be inferred from Brent alone.
The central industrial consequence is the potential divergence between the recovery of commodity benchmarks and the recovery of dependable manufacturing inputs. Producers that cannot identify their upstream feedstock dependencies, qualify substitutes and manage contractual price transmission remain vulnerable to both material shortages and margin compression. The most useful monitoring indicators are therefore cargo-specific export volumes, regional feedstock prices, operating rates, inventories, contracted delivery performance and actual supplier capacity.
Chapter 6. Retailers, Manufacturers and the International Redistribution of Supply-Chain Exposure
Principal Judgment: Industrial Vulnerability Depends More on Critical Dependencies Than on Aggregate Import Volumes
The distribution of industrial and commercial consequences across the global economy is determined by the interaction of energy dependence, intermediate-goods sourcing, logistics geography, procurement structure and financial capacity. Aggregate import volumes provide only a partial indication of vulnerability. A company purchasing large quantities of readily substitutable goods may be better positioned to manage disruption than a manufacturer whose production depends on one specialised component imported through an exposed corridor. Similarly, an economy with substantial domestic energy production can remain vulnerable through the international prices of petroleum, plastics, chemicals and freight. The most consequential distinction is therefore between exposure measured by monetary trade value and exposure measured by the ability to maintain production or fulfilment when a critical input or transport service becomes unavailable.
The 2026 crisis has made this distinction operationally significant. The EIA’s data show that the physical movement of petroleum through Hormuz contracted sharply, while carrier disclosures establish that international logistics networks continued operating through modified routes, selective port calls and alternative handling arrangements. Neither observation is sufficient to measure national manufacturing losses directly. The consequences for each country depend on how upstream supply disruptions enter its industrial structure, the availability of inventories and substitutes, and the ability of companies to finance longer procurement cycles. Global Energy Security Data — U.S. Energy Information Administration — August 2026; Week 44 Middle East Operational Update — Hapag-Lloyd — October 2026.
Italy: Mediterranean Connectivity Meets Industrial Input Dependence
Italy’s exposure combines its location within Mediterranean transport networks with the requirements of a diverse manufacturing sector. Machinery, automotive components, chemicals, plastics, pharmaceuticals, consumer goods and other industries depend on different combinations of imported energy, intermediate materials and international freight. A prolonged change in Red Sea and Suez accessibility can affect the economics of cargo moving between Asian suppliers and Italian production or distribution facilities. Yet the effect is not uniform across the country or its industries: enterprises using different origin markets, shipping services and inland distribution systems may experience substantially different changes in cost and delivery time.
The principal industrial risk is interruption of production caused by delayed components or materials whose financial value is small relative to the finished product. A manufacturer may possess sufficient labour, machinery and customer demand while being unable to complete production because a specialised chemical, electronic component or packaging input has not arrived. The economic loss is then determined less by the freight cost of the missing input than by the value of postponed output, contractual delivery consequences and the costs of restarting or reorganising production.
For Italian procurement managers, the relevant assessment must therefore trace critical inputs beyond the direct supplier. A European distributor may supply imported components whose actual production location is outside Europe, while a domestically purchased polymer may depend on international feedstock markets. Supplier address and invoice currency are not sufficient indicators of geographic independence. The same logic applies to transport: purchasing goods under a contract with a European counterparty does not demonstrate that the underlying maritime journey avoids exposed routes.
The strategic response is differentiated inventory and supplier qualification. High-volume interchangeable materials should not automatically receive the same contingency treatment as low-volume components that can interrupt an entire production line. The appropriate decision combines expected replenishment variability, the value of production at risk, substitution lead time and financing cost.
Germany: Production-Network Interdependence and the Cost of Missing Intermediate Inputs
Germany’s exposure is distinguished by the complexity of industrial production networks and the importance of reliable intermediate inputs to machinery, automotive manufacturing, chemicals, electrical equipment and other capital-intensive sectors. The impact of a logistics interruption can propagate through several supplier tiers before reaching the final manufacturer. A direct supplier may continue functioning while one of its own upstream sources experiences a transport or feedstock constraint. Where the affected component is technically specialised, substitution may require new testing, production adjustments or customer approval, reducing the ability to respond through immediate spot-market purchasing.
The relevant industrial cost is therefore not simply higher freight expenditure but loss of production synchronisation. Manufacturing systems that depend on precisely timed arrivals can experience increasing buffers, schedule instability and greater work-in-progress inventories when transport reliability deteriorates. A supplier may attempt to compensate through expedited shipments, but airfreight capacity and pricing can themselves be affected by regional airspace security and changes in global logistics demand.
German manufacturers also face exposure through energy-intensive intermediate industries. Even where an enterprise does not purchase crude oil or LNG directly, it may depend on suppliers whose costs reflect energy and chemical-market developments. This creates a second-tier transmission mechanism through which prices and availability affect industrial competitiveness. The extent of exposure requires sector-specific data rather than a universal national percentage estimate.
France: Energy, Chemicals, Maritime Transport and Industrial Continuity
France faces a combination of energy-market, industrial and international transport exposures. Its manufacturing activities include chemicals, aerospace, pharmaceuticals, consumer products and a range of specialised industrial sectors whose supply chains differ in technical requirements and delivery tolerances. The effects of maritime disruption cannot therefore be represented through a single indicator such as container traffic or crude-oil prices. A chemical producer may be sensitive to feedstock availability and energy costs, while a manufacturer of high-value components may prioritise delivery reliability and alternative transport options.
France’s position also includes the broader European maritime system and the commercial consequences of routing choices between Atlantic and Mediterranean gateways. Longer voyages around southern Africa can alter the relative economic importance of different port connections and inland routes, but the direction and magnitude of the effect depend on actual service schedules and terminal performance. An increase in cargo arriving through an alternative port does not necessarily translate into greater national economic benefit if inland handling costs or congestion increase.
For French industrial purchasers, the principal resilience issue is to distinguish purchasing diversification from effective production continuity. Two nominal suppliers may share a critical chemical intermediate or production technology, and a replacement supplier may lack the necessary certifications. Business-continuity planning must therefore incorporate production qualification and customer requirements alongside freight and inventory management.
The United Kingdom: Maritime Services, Insurance and Industrial Imports
The United Kingdom’s exposure is distinguished by the intersection of internationally integrated commercial supply chains, maritime services and its documented defensive involvement in regional security. The British Ministry of Defence’s October 2026 announcement explicitly linked instability in the Gulf to energy disruption, the cost of living and expenses faced by British businesses. This provides an official connection between the regional security response and domestic economic interests. Operational Update: UK Military Support to Saudi Arabia — UK Ministry of Defence — 20 October 2026.
For British retailers and manufacturers, the effects arise through international procurement, freight costs, chemical and packaging inputs, fuel and working-capital requirements. Businesses sourcing finished goods from Asian manufacturing centres may face changes in delivery times and transport charges, while enterprises using European distribution networks can experience indirect consequences when imported components or goods reach Europe later than planned.
The maritime financial-services dimension introduces a further exposure. Insurance and chartering conditions can influence the economic viability of voyages independently of physical passage. However, the available material does not support assigning a single percentage increase in British insurance expenditure or a definitive national financial loss from the Gulf crisis. Those conclusions would require comparable commercial underwriting and financial data.
China, India, Japan and South Korea: Different Exposure to the Same Energy Corridor
Asian manufacturing economies possess strong commercial interests in the reliability of Gulf energy exports, but their capacity to absorb disruption differs according to energy sourcing, inventories, industrial structure and alternative supply arrangements. China’s large manufacturing base creates exposure through both direct energy consumption and the prices of globally traded industrial materials. India’s position combines energy-import needs with significant refining, chemicals and manufacturing activity. Japan and South Korea face risks associated with energy imports and highly integrated industrial supply chains, including manufacturing processes with limited tolerance for interruption.
The EIA’s estimates of strategic oil inventories provide a useful, though incomplete, comparison of available buffers. Its August 2026 dataset estimated inventories of 1,492 million barrels for China, 321 million for the United States, 187 million for Japan, 69 million for South Korea and 21 million for India in the second-quarter 2026 observation period. These estimates differ in institutional coverage and source methodology and should not be converted into comparable days of import protection without corresponding consumption or net-import data. They nevertheless illustrate substantial differences in the scale of reported inventories. Global Energy Security Data, Table 1 — U.S. Energy Information Administration — August 2026.
Selected strategic petroleum inventory estimates
| Country or aggregate | Estimated inventory, million barrels | Reference period | Principal limitation |
|---|---|---|---|
| China | 1,492 | Q2 2026 | Estimated coverage and methodology |
| United States | 321 | Q2 2026 | Strategic inventory, not total commercial oil stocks |
| Japan | 187 | Q2 2026 | Requires demand data for days-of-cover comparison |
| South Korea | 69 | Q2 2026 | Does not establish product-specific availability |
| India | 21 | Q2 2026 | Does not include every commercial inventory category |
| Other OECD Europe | 130 | Q2 2026 | Aggregate category, not an individual country |
| France | 33 | Q2 2026 | Comparable interpretation requires coverage review |
Source: Global Energy Security Data, Table 1 — U.S. Energy Information Administration — August 2026.
The strategic implication is that stocks provide a buffer against temporary disruption but do not eliminate the requirement for future replenishment. A large inventory can permit continued consumption while imports are constrained, but depletion changes the flexibility available during a subsequent shock. For manufacturers, the relevant comparison is even more specific: crude inventories cannot replace unavailable LNG, specialised chemicals, semiconductor components or qualified polymers. National energy stocks therefore provide only one layer of resilience within the industrial system.
Supplier Mapping: The Difference Between Contractual and Physical Diversification
A critical weakness in conventional supply-chain assessment is the treatment of direct suppliers as independent sources of capacity. A company may purchase from several distributors while the underlying material originates from one producer. Different manufacturers may use the same refinery, petrochemical plant or specialist component maker. Separate transport providers may depend on the same transshipment terminal, customs gateway or cloud infrastructure. These concentrations remain invisible when procurement systems record only first-tier commercial counterparties.
Effective supplier mapping must therefore establish the location and capacity of critical production sites, the availability of substitute materials, the transport corridors used, the time required for qualification and the economic consequences of interruption. The depth of analysis should reflect the criticality of the input rather than requiring exhaustive mapping of every low-value purchase. A component that can stop production for several weeks deserves greater attention than a readily substitutable input even when its annual expenditure is comparatively small.
The assessment should also distinguish ownership diversification from geographic and technological diversification. Two factories belonging to different companies may share one industrial utility network or depend on the same specialised feedstock. Conversely, two facilities under common ownership may provide useful resilience if they possess independent production capacity and transport access. The relevant criterion is whether one plausible disruption can interrupt both sources simultaneously.
Inventory Financing and the Economic Cost of Continuity
Increasing inventories is a common response to uncertain delivery times, but its economic value depends on how much additional stock is required, the cost of financing it and the value of disruption avoided. Inventory has direct acquisition costs and may require storage, insurance, handling and protection against deterioration or obsolescence. Additional stock also ties up cash that cannot be deployed elsewhere. For businesses operating with constrained liquidity, an indiscriminate increase in inventories can undermine financial resilience even while improving physical availability.
The appropriate approach is selective. Critical inputs with long qualification periods, limited substitutes and severe interruption consequences may justify substantial buffers. Commodities available from several independent suppliers may require smaller reserves. Perishable or technologically sensitive goods may be poorly suited to long-term storage. A company should therefore evaluate inventory decisions against expected replenishment variability, operational criticality and the economic loss associated with shortage.
An illustrative financing calculation demonstrates the mechanism without presenting an invented empirical loss. A manufacturer holding an additional $10 million of inventory at an assumed annual financing cost of 8% incurs $800,000 in annual financing expenditure before storage, insurance or obsolescence. If the buffer prevents a production interruption costing several million dollars, it may be economically justified. If the material can readily be acquired from multiple unaffected suppliers, the same expenditure may be unnecessary. The decision cannot be made from inventory volume alone.
Commercial continuity decisions by exposure type
| Exposure | Most effective response | Financial requirement | Principal limitation |
|---|---|---|---|
| Critical single-source component | Qualified alternative production site | Qualification and supplier development | Implementation lead time |
| Intermittent freight delays | Targeted safety stock and flexible routing | Working capital and reserved capacity | Cost of unused alternatives |
| Polymer supply concentration | Approved substitute grades and diversified producers | Testing and procurement development | Technical and regulatory compatibility |
| Energy-price volatility | Contractual price review and procurement diversification | Hedging or commercial flexibility | Basis and counterparty risk |
| Port concentration | Prearranged alternative gateway | Additional handling and inland transport | Terminal capacity |
| Digital logistics dependence | Independent records and recovery procedures | Systems engineering and testing | Shared underlying infrastructure |
| Supplier financial weakness | Financial monitoring and backup capacity | Credit assessment and supplier support | Limited control over counterparties |
Chapter 6 — Net Assessment
The international redistribution of supply-chain exposure depends less on broad geographical labels than on the location of critical inputs and the capacity of companies to replace them without interrupting production. Italy, France, Germany and the United Kingdom face different combinations of maritime, energy, industrial and commercial-service exposure. China, India, Japan and South Korea similarly differ in energy sourcing, inventories and manufacturing dependencies.
The central judgment, with high confidence, is that supplier diversification, strategic inventory and transport alternatives deliver resilience only when they address the same physical dependency that would otherwise interrupt operations. Commercial relationships, nominal supplier counts and national inventory totals are insufficient substitutes for a validated understanding of production sites, input compatibility, transport access and financing capacity.
PILLAR III — HYBRID INFRASTRUCTURE RISKS, STRATEGIC SCENARIOS AND RESILIENCE TO 2030
Chapter 7. Cyber-Physical Disruption and the Vulnerability of Digital Logistics Infrastructure
OPEN-SOURCE STRATEGIC INTELLIGENCE ASSESSMENT | 31 OCTOBER 2026 | STRATEGIC HORIZON 2027–2030
Principal Judgment: Digital Dependence Has Become an Independent Source of Strategic Vulnerability
The transformation of international logistics into a digitally coordinated system has created a category of strategic vulnerability that cannot be understood through conventional assessments of physical infrastructure, vessel availability or maritime route security. Modern supply chains depend on the continuous exchange of information among satellite-navigation systems, maritime surveillance networks, port operating platforms, customs authorities, industrial control systems, cloud-computing environments, transport-management software, aircraft operators and increasingly automated forecasting applications. These systems enable operators to manage complex international networks with greater efficiency, but their integration also permits failures in positioning, communications, authentication or data availability to propagate across several organisational and geographical boundaries. Consequently, the loss of a physical asset is no longer the only mechanism capable of interrupting international commerce. The loss of confidence in the data used to locate, authorise, dispatch or release that asset can produce operational disruption even when the underlying vessel, aircraft, container, warehouse or terminal remains physically available.
The principal judgment, with high confidence, is that cyber-physical resilience has become a binding requirement for the operational continuity of strategically important transport infrastructure. The strongest evidence concerns interference with satellite navigation and the documented dependence of maritime and aviation operations on digital information systems. During 2026, competent international authorities identified extensive GNSS jamming and spoofing affecting navigation in and around regional conflict areas. The International Maritime Organization explicitly warned that ships operating in the Gulf faced navigation hazards associated with interference, while the European Union Aviation Safety Agency revised its guidance on satellite-navigation degradation in July. These official observations establish that digital-navigation disruption is an operational security issue rather than a purely theoretical cybersecurity concern. They do not, however, establish that every anomalous vessel position or aircraft track represents an intentional attack, that all interference originates from a single actor, or that the wider regional crisis has involved a verified campaign against specific commercial AI installations. IMO Condemns Attacks on Shipping and Calls for Safe-Passage Framework — International Maritime Organization — March 2026; EASA Updates Safety Information Bulletin on GNSS Interference — European Union Aviation Safety Agency — July 2026.
The implications extend substantially beyond navigation. When cargo-visibility software receives inconsistent vessel coordinates, estimated arrival times may become unreliable. When a terminal operating system cannot reconcile vessel identity, cargo manifests or container locations, the release and movement of goods may slow even if cranes and road vehicles remain functional. When a transport-management platform loses access to cloud-hosted records, dispatchers may be unable to establish which shipments have been completed, which remain in transit and which require intervention. When industrial operational technology is compromised, the consequences can extend from administrative inconvenience to interruption of physical processes, including cargo handling, refrigeration, industrial pumping and automated equipment movement. These effects differ in severity and require different evidence, but they share a common structural feature: the increasingly close connection between the accuracy and availability of digital information and the safe execution of physical economic activity.
The policy challenge is therefore not to eliminate digital integration. The productivity advantages of connected systems are integral to contemporary transport and manufacturing. It is to prevent efficiency gains from producing dependencies so concentrated that failure of a common positioning source, digital identity service, software platform or cloud environment can interrupt several essential functions simultaneously. The United States National Institute of Standards and Technology identifies this distinction in its operational-technology security framework, which treats safety, reliability and the physical consequences of systems failure as core considerations rather than subordinate aspects of ordinary information-technology protection. NIST’s September 2026 draft revision further expands explicit consideration of maritime vessels, freight rail, industrial internet-connected systems and the convergence of cloud services with operational technology. As of the October 2026 assessment cut-off, that revision remains a public draft, while Revision 3 remains the final published standard. Guide to Operational Technology Security, SP 800-82 Revision 3 — National Institute of Standards and Technology — September 2023; Guide to Operational Technology Security, SP 800-82 Revision 4, Initial Public Draft — National Institute of Standards and Technology — September 2026.
The most consequential structural exposure through 2030 is the possibility of simultaneous degradation across physical and digital infrastructure. A security incident affecting a vessel may require alternative routing, but the ability to manage that alternative depends on accurate positioning, available communications, functioning booking systems and reliable port information. A regional power or telecommunications interruption may affect both physical handling equipment and the data centres supporting cargo processing. A cloud-service outage may disrupt multiple customers that believed they possessed independent logistics providers but actually relied on the same underlying identity, data or software infrastructure. The resulting concentration can remain invisible in conventional supplier inventories because contractual diversity does not necessarily correspond to technological independence.
GNSS Jamming and Spoofing: The Technical Distinction Between Signal Loss and False Positioning
Satellite-navigation interference represents one of the clearest points at which electronic activity can compromise the relationship between digital systems and physical movement. Global Navigation Satellite Systems provide positioning, navigation and timing services used by aircraft, ships, ground vehicles and a wide range of commercial information systems. The underlying civilian signals are comparatively weak when received at the Earth’s surface, creating susceptibility to radio-frequency interference. The International Civil Aviation Organization distinguishes two principal forms of intentional interference: jamming, which prevents or degrades the reception of valid satellite signals, and spoofing, which introduces counterfeit signals capable of misleading receivers about their position or time. These mechanisms have different consequences for operational decision-making because the absence of a reliable position is not the same as the apparent availability of a position that is wrong. Global Navigation Satellite System Radio Frequency Interference — International Civil Aviation Organization, Global Safety Initiatives; Global Navigation Satellite System Outages and Alterations — European Union Aviation Safety Agency — July 2026.
Jamming creates a relatively direct operational problem. A receiver may lose satellite lock, report degraded accuracy or become temporarily incapable of producing a valid navigation solution. A vessel or aircraft equipped with independent navigation instruments may continue operating within the limits imposed by applicable safety procedures, but its crew and supporting systems must recognise that satellite-derived information has become unreliable. The consequences depend on where the interference occurs, the availability of alternative navigation aids, the proximity of physical hazards and the reliance of connected applications on the affected signal. An ocean-going vessel in open water may have different recovery options from one approaching a congested port, while an aircraft operating in controlled airspace may require coordination with air traffic services and adherence to procedures established for navigation degradation.
Spoofing creates a more difficult integrity problem because it can provide plausible but incorrect data. A receiver may continue displaying coordinates even though the information no longer reflects the asset’s actual position. Downstream systems that assume the validity of the reported coordinates can then propagate the error. For maritime logistics, the affected information may enter vessel-tracking platforms, fleet dashboards, arrival forecasts and automated exception-management systems. In aviation, altered positioning or timing information can affect navigation and surveillance functions that rely on satellite-derived inputs. EASA’s July 2026 guidance specifically identifies discrepancies between different navigation references, abnormal relationships between ground speed and airspeed, time shifts and spurious terrain-awareness alerts among the symptoms associated with interference. These indicators are operational warnings requiring validation; individually, they do not establish the cause of interference or the identity of the responsible actor. Global Navigation Satellite System Outages and Alterations — European Union Aviation Safety Agency — July 2026.
The distinction between availability and integrity is especially important for automated logistics systems. A shipment-management application that receives no position may identify the asset as temporarily unobservable, preserve the last validated coordinates and await a reliable update. An application that receives a false but apparently valid position may instead calculate an incorrect estimated arrival time, trigger a premature delivery notification, classify a voyage as diverted or initiate operational decisions based on a movement that never occurred. These are potential failure mechanisms rather than documented consequences for every affected vessel. Their significance lies in the dependence of downstream decisions on the quality of upstream data. As automated systems become more common, organisations must ensure that a plausible coordinate is not treated as sufficient evidence of an asset’s physical location.
The official maritime record demonstrates that this distinction has become operationally relevant. In March 2026, the IMO Council expressed concern about the exposure of seafarers to extensive satellite-navigation jamming and spoofing during the Gulf crisis. Its intervention was directed toward the protection of ships and crews, but it also has broader implications for commercial information systems relying on vessel positions. Disruption of the positioning source can simultaneously affect bridge-level situational awareness and shore-based tracking platforms. This does not establish that the same interference will always affect every shipboard instrument or shore application; it does establish a common source of potential degradation across several otherwise separate layers of the transport system. IMO Condemns Attacks on Shipping and Calls for Safe-Passage Framework — International Maritime Organization — March 2026.
Technical comparison of navigation-interference mechanisms
| Dimension | GNSS jamming | GNSS spoofing | Operational consequence |
|---|---|---|---|
| Primary mechanism | Interference prevents or degrades reception of legitimate signals | Counterfeit signals induce incorrect navigation or timing information | Different detection and recovery requirements |
| Typical observable symptom | Signal loss, degraded accuracy or receiver warnings | Plausible but inconsistent position, speed or time | Spoofing can be less immediately obvious |
| Position-data reliability | Often explicitly unavailable or degraded | May appear valid despite being incorrect | Greater risk of downstream data contamination |
| Maritime relevance | Loss of a trusted position source | False vessel positions or movement histories | Impaired navigation and shore-side visibility |
| Aviation relevance | Degraded satellite-based navigation | Incorrect navigation references or timing anomalies | Additional cockpit and air-traffic verification requirements |
| Logistics-platform exposure | Missing updates and uncertain arrival predictions | Incorrect updates and potentially false event triggers | Data-quality failures |
| Required response | Use approved alternative positioning and reporting procedures | Compare independent references and reject inconsistent information | Integrity validation rather than blind automation |
| Attribution | Cannot be inferred from signal loss alone | Cannot be inferred from anomalous coordinates alone | Requires separate technical investigation |
Technical basis: EASA GNSS Outages and Alterations — European Union Aviation Safety Agency — July 2026; IMO Maritime Cyber Risk — International Maritime Organization.
A further dimension concerns timing. Satellite-navigation receivers can provide precise time references to systems beyond navigation itself. Where networks depend on accurate time synchronisation, a timing anomaly may compromise the ordering of events, the interpretation of logs or the ability to reconcile transactions across separate systems. The consequences are highly system-specific and should not be assumed without examining the architecture involved. Nevertheless, timing integrity deserves explicit attention in resilience planning because modern transport operations increasingly depend on synchronised digital records generated by different organisations.
AIS Integrity and the Reliability of Maritime Intelligence
The Automatic Identification System is central to contemporary maritime situational awareness, but the information it provides must be understood within its technical and operational limitations. AIS enables vessels and shore-based receivers to exchange identifying and navigational information, including positions and movement characteristics, while terrestrial and satellite reception networks permit the aggregation of observations across large maritime areas. Commercial tracking platforms combine these transmissions with other data to provide vessel histories, voyage estimates and fleet-monitoring services. These capabilities are extremely valuable for shipping operators, maritime authorities, insurers, commodity traders and manufacturers seeking visibility over goods in transit. However, AIS data are not equivalent to independently verified physical positions in every circumstance. The quality of the resulting information depends on the operation of shipboard equipment, the validity of position inputs, reception coverage, message integrity and the processing methods used by the receiving platform.
Where AIS equipment obtains its position from a GNSS receiver affected by spoofing, transmitted location information can become unreliable even if the AIS transmitter itself continues operating. Conversely, gaps in a commercial vessel track may arise for reasons other than hostile electronic activity, including reception limitations, equipment faults, configuration issues or legitimate operational circumstances. A discontinuity in an AIS record therefore does not automatically establish that the vessel has been attacked, deliberately concealed or diverted. Likewise, a series of geographically implausible positions may indicate data-integrity problems without identifying which component or actor caused them. The distinction is especially important in a contested maritime environment because erroneous classification can influence insurance assessments, cargo risk management and operational responses.
The Joint Maritime Information Center’s April 2026 advisory provides unusually relevant evidence. It described GNSS, GPS and AIS interference as sporadic and localised during the reporting period, with limited operational impact, and identified periodic interference near sensitive maritime areas, including approaches to Suez and Port Sudan. It also reported that AIS activity in the Arabian Gulf had improved since 15 March compared with the preceding period. The advisory’s significance lies partly in its measured language. It did not characterise every anomaly as a severe attack or imply that the entire region had lost navigational capability. Its assessment supports a differentiated approach in which the frequency, geography, duration and operational consequences of interference are evaluated separately. Joint Maritime Information Center Advisory Note, 16 April 2026 — UK Maritime Trade Operations.
This distinction becomes critical when maritime-tracking data are used to calculate regional trade volumes. An apparent decline in AIS-observed traffic can reflect an actual decrease in vessel movements, changes in reception coverage, interference with navigation or transmission, differences in vessel classification or data-processing exclusions. Similarly, a sudden increase in observations does not automatically indicate a corresponding increase in cargo tonnage. A tanker may transit without cargo, change its declared destination or undertake movements that do not represent completed commercial exports. An oil-trade analysis therefore requires vessel identification, vessel type, cargo status, draft information where reliable, terminal events and supplementary port or customs records. AIS is an essential observation layer, not a complete cargo-accounting system.
The problem is more pronounced when different commercial data services are compared without reconciling their methodologies. Providers can apply distinct vessel filters, geographic boundaries, interpolation techniques, timestamp rules and treatment of ambiguous tracks. These differences may produce materially different traffic estimates without either dataset necessarily being fraudulent. A defensible assessment should identify which movements are directly observed, which are inferred and which remain unresolved. Historical figures should be revised when later terminal or customs information becomes available, but such revisions must retain their original reference periods. An analyst should not silently convert a reconstructed voyage into a confirmed historical observation or use a revised estimate without identifying the change in methodology.
For maritime operations, the practical response is to combine independent sources of information wherever the consequences of error are material. Depending on the vessel and operating environment, this can include approved radar and electronic chart information, visual and terrestrial navigation, verified vessel reports, port movement records and cross-checks against other sensors. For commercial logistics platforms, equivalent measures include comparing AIS movements with verified loading and discharge events, port-call records and carrier confirmations. The objective is not to reject automated tracking, but to prevent a single compromised or incomplete data source from becoming the unquestioned basis for consequential commercial decisions.
Data-quality controls for maritime tracking
| Observed anomaly | Possible explanations | Required validation | Commercial implication |
|---|---|---|---|
| Sudden vessel-position displacement | Spoofing, receiver error, data-processing error | Independent position reference and vessel-report reconciliation | False diversion or inaccurate arrival estimate |
| Extended AIS reporting gap | Reception limitation, equipment failure, interference or transmission issue | Coverage assessment and independent movement records | Reduced shipment visibility |
| Implausible vessel speed | Position error, timestamp inconsistency or processing anomaly | Time-series validation and independent sensor comparison | Incorrect voyage-progress calculation |
| Unexpected destination change | Genuine commercial diversion, inaccurate declaration or system error | Carrier or vessel confirmation | Potential false logistics exception |
| Conflicting vessel identities | Registry mismatch, message corruption or incorrect database reconciliation | IMO number, call sign and registry verification | Misattribution of voyage or cargo |
| Apparent port arrival without terminal confirmation | Position error, anchorage movement or incomplete port data | Berth and terminal records | Premature cargo-availability assumption |
| Disagreement between tracking providers | Coverage, modelling or classification differences | Methodology reconciliation | Uncertain traffic and risk estimates |
| Repeated regional anomalies | Environmental interference, equipment problems or hostile activity | Multi-source temporal and geographical analysis | Possible wider navigation-integrity concern |
The relevant control is not simply the number of tracking platforms purchased. Two platforms that ingest the same compromised upstream transmission may produce mutually consistent but incorrect outputs. True redundancy requires sufficient independence among the information sources and validation methods.
Air Navigation, Surveillance Integrity and the Exposure of Regional Aviation Networks
Civil aviation presents a more tightly regulated but similarly consequential example of dependence on navigation and communications integrity. Aircraft operations require continuous coordination among flight crews, air traffic control, aircraft navigation systems and ground-based information services. Satellite-navigation degradation can affect this architecture in several ways, depending on the equipment installed, the phase of flight, the available terrestrial navigation aids and the applicable operating procedures. An aircraft can retain safe navigation capability despite the loss of GNSS when appropriate independent systems and procedures are available; however, that capability cannot be presumed uniformly across every aircraft, route or airspace environment.
EASA’s revised July 2026 Safety Information Bulletin reflects a growing recognition of the operational consequences of GNSS interference. The revision incorporates recommendations addressing pilot–air traffic control communication, electronic flight-bag integration, operational training and the capacity of air traffic management systems to accommodate aircraft operating with degraded satellite-navigation capability. The emphasis on air traffic control capacity is particularly important because an individual aircraft’s ability to continue flying does not establish that an airspace network can maintain its ordinary throughput. Where aircraft require different navigation procedures, greater separation or additional controller intervention, the number of movements that can be safely accommodated may decline even without the closure of an airport or the physical damage of an aircraft. EASA Updates Safety Information Bulletin on GNSS Interference — European Union Aviation Safety Agency — 3 July 2026.
The regional exposure must also be evaluated using the specific airspace advisories in force rather than treating the Middle East as a single operating area. On 8 July 2026, EASA announced that it would replace a broader advisory covering the Middle East and Persian Gulf with a combination of a regional information note describing residual medium-level risks and separate conflict-zone bulletins addressing higher-risk airspace. The agency’s later active-advisory register records specific bulletins for Saudi Arabia, Jordan, the Persian Gulf and Gulf of Oman, Iran, Iraq and Lebanon, with amendments and validity dates differing across the listed areas. This differentiation demonstrates why a general claim that Gulf aviation has either reopened or closed is analytically inadequate. Risk classifications, route restrictions and operator decisions depend on the specific flight information region, flight level, conflict-zone assessment and prevailing conditions. Revised Conflict Zone Advisories for the Middle East — European Union Aviation Safety Agency — 8 July 2026; Conflict Zones Advisories — European Union Aviation Safety Agency — October 2026.
As of the October 2026 assessment period, EASA’s register included an active Saudi Arabia bulletin initially issued on 30 September and revised on 9 October, together with separately maintained advisories for surrounding airspace. The coexistence of multiple active bulletins is a more informative indicator of the operating environment than a general assertion about airport availability. It establishes that aviation authorities continued to regard conflict-related risks as requiring specific safety guidance. It does not establish that every airport within the relevant states was closed, that all airlines suspended operations or that each restriction produced the same economic consequences. Conflict Zones Advisories — European Union Aviation Safety Agency — October 2026.
Regional aviation advisories and their analytical significance
| Geographic scope | Documented EASA status during October 2026 | Significance for logistics |
|---|---|---|
| Saudi Arabia | Active conflict-zone bulletin; revised 9 October | Requires route-specific assessment of exposure affecting Saudi airspace |
| Persian Gulf and Gulf of Oman | Active regional conflict-zone bulletin | Relevant to connections across Gulf airspace and adjacent maritime approaches |
| Iran | Active conflict-zone bulletin | Direct relevance to overflight planning and regional route availability |
| Iraq | Active conflict-zone bulletin | Important for east–west aviation corridors |
| Jordan | Active conflict-zone bulletin | Relevant to diversion planning and neighbouring airspace connections |
| Lebanon | Active conflict-zone bulletin | Relevant to eastern Mediterranean air connectivity |
Source: EASA Conflict Zones Advisories — European Union Aviation Safety Agency — October 2026. These statuses refer to regulatory safety advisories and should not be interpreted as blanket airport-closure declarations.
For international air cargo, the economic consequences of navigational or airspace restrictions depend on aircraft type, cargo characteristics, alternative routes and the structure of the operator’s network. Additional flying time can increase fuel consumption and potentially affect payload economics. A change in routing may require different technical stops or crew arrangements. A carrier with a concentrated hub network may experience schedule disruption if inbound aircraft arrive outside planned connection windows, while an operator with flexible point-to-point services may be able to redistribute some traffic. These are operational mechanisms, not verified system-wide estimates of October cargo-capacity losses.
The concentration of passenger and cargo connections at major regional airports creates an additional vulnerability because passenger services often carry commercial cargo in aircraft belly holds. A disruption affecting passenger flight frequency can therefore reduce available cargo capacity even where dedicated freighters continue operating. Conversely, a reduction in passenger demand does not automatically produce a proportional cargo-capacity decline if dedicated freighter services or alternative routes absorb part of the traffic. Determining the actual effect requires airline schedules, aircraft payload data, airport cargo-throughput records and cancellation or diversion statistics. Without those records, claims of a particular percentage reduction in Gulf air cargo would be unsupported.
The emerging international response to GNSS interference reinforces the need for resilient navigation systems. ICAO’s medium-term programme includes further development of conventional navigation alternatives, improved interference monitoring, updated technical manuals and additional civil–military coordination guidance, with several activities planned for completion in 2027. These initiatives are relevant because they address the capacity of aviation systems to continue operating safely when satellite-navigation information cannot be trusted. They do not demonstrate that every proposed measure has already been deployed across the relevant aviation network. GNSS Radio-Frequency Interference Roadmap: Medium-Term Actions — International Civil Aviation Organization.
Data Centres, Cloud Concentration and the Geography of Digital Infrastructure Risk
The expansion of cloud computing and AI infrastructure across the Gulf introduces a further strategic dependency that is materially different from conventional maritime and aviation navigation risks. Data centres support the storage and processing of business information, application hosting, identity management, analytics and increasingly computationally intensive AI services. Their physical infrastructure depends on electrical supply, cooling, telecommunications connectivity, equipment maintenance and the availability of skilled personnel. Cloud platforms additionally depend on software-defined networks, service orchestration, access controls and sometimes centralised management systems that extend across several geographical locations. Consequently, the resilience of a cloud-based logistics platform cannot be inferred from the physical survival of a single data-centre building.
The relevant threat model includes physical attacks against facilities, electricity interruptions, telecommunications failures, cyber intrusions, denial-of-service activity, compromise of privileged credentials, configuration errors and dependency failures affecting shared cloud services. These mechanisms differ in origin and severity. A physical attack may damage electrical or cooling infrastructure without compromising stored information. A cyber intrusion may compromise the integrity or confidentiality of operational data without interrupting the building’s electricity supply. A software configuration error may disable access to applications across several otherwise functional facilities. A regional telecommunications failure may leave computing resources operational but inaccessible to customers. The distinction matters because each failure requires a different response, and a generic declaration that a cloud platform possesses geographically redundant data centres may not establish resilience against every category of interruption.
As of 31 October 2026, the primary institutional sources examined for this chapter establish substantial cyber-physical vulnerability but do not substantiate a specific, coordinated campaign of attacks against named Gulf AI data centres or identify verified losses of regional AI computing capacity attributable to the confrontation. Claims concerning such incidents should therefore not be incorporated into the established event record without facility-level disclosures, competent national authority statements or other independently verifiable evidence. The possibility remains analytically relevant because the dependency structure is real, but the distinction between demonstrated vulnerability and documented attack must be preserved.
A particularly important issue is common-mode failure. An organisation may replicate its application across two data centres while retaining a single identity provider, database control plane, encryption-key management service or network-routing dependency. If that shared component becomes unavailable, physical replication of the application may not provide operational continuity. The same problem can occur when two ostensibly independent software vendors rely on the same underlying cloud infrastructure. A logistics company might procure transport planning from one supplier and shipment visibility from another, believing that supplier diversification has reduced risk. If both services depend on the same cloud region or shared authentication infrastructure, the organisation may still face a correlated outage.
The European Union Agency for Cybersecurity’s 2025 Threat Landscape reinforces the importance of third-party dependencies. The report examines 4,875 cybersecurity incidents recorded between 1 July 2024 and 30 June 2025, and its September 2026 revision corrected certain reported figures and links. This dataset concerns the EU cyber threat environment and should not be represented as a count of Gulf attacks. It is nevertheless relevant to the systemic risk posed by common technology providers, supply-chain compromise and the transmission of incidents through services used by multiple organisations. ENISA Threat Landscape 2025, Version 1.3 — European Union Agency for Cybersecurity — September 2026 revision.
For logistics directors, cloud concentration must be mapped at the level of essential business functions rather than vendor logos. A shipment-booking application, customs gateway, transport-management platform and warehouse-management system may be procured under different contracts yet depend on common technical infrastructure. The correct dependency assessment therefore includes the hosting regions used for each critical service, shared authentication and network services, ownership of operational databases, methods for exporting and restoring records, and procedures for continuing essential operations when the supplier’s platform is unavailable. Supplier diversification is meaningful only when the underlying arrangements provide sufficient independence to reduce correlated failures.
The difference between geographically distributed infrastructure and independent operational recovery is equally significant. A provider may maintain redundant computing resources but offer limited access to historical records during an identity-service outage. Another may maintain current application availability while being unable to reconstruct a reliable sequence of transactions after data corruption. A third may possess backup facilities but lack tested procedures for restoring interfaces with customers, carriers, customs authorities and terminals. The relevant resilience metric is therefore not the number of data centres, but the time and information quality required to restore specific essential functions.
Cloud and digital-infrastructure dependency matrix
| Dependency layer | Principal failure mechanism | Possible logistics consequence | Effective resilience measure | Evidence required |
|---|---|---|---|---|
| Physical data-centre facility | Power, cooling or physical damage | Service degradation or interruption | Independent sites and tested recovery arrangements | Facility-level continuity evidence |
| Cloud compute region | Regional platform outage | Loss of application processing | Architecturally independent recovery capacity | Tested recovery results |
| Identity and access management | Shared authentication failure | Users cannot access otherwise available systems | Emergency access procedures with secure controls | Authentication-failure exercise |
| Operational database | Corruption, unavailability or replication failure | Unreliable shipment or inventory records | Recoverable, validated data copies | Restoration and reconciliation results |
| Network connectivity | Telecommunications or routing failure | Inability to communicate with cloud services | Diverse network paths and offline procedures | Connectivity-failure testing |
| Software integration | Failure of APIs or message exchange | Missing milestones and delayed transaction processing | Queues, controlled retries and reconciliation | Interface recovery tests |
| Encryption-key service | Key-management unavailability | Inaccessible encrypted information | Documented and protected recovery architecture | Key-recovery testing |
| External logistics SaaS | Provider outage or service compromise | Booking, tracking or dispatch failure | Exportable records and alternative operating methods | Contractual and technical recovery evidence |
| AI inference platform | Model or service unavailability | Loss of forecasting and optimisation capability | Deterministic fallback procedures | Degraded-mode operating tests |
| Cloud control plane | Central service-management failure | Inability to deploy, modify or recover workloads | Operational independence where technically feasible | Architecture and failure-domain assessment |
The table identifies mechanisms and required controls. It does not assert that a specific Gulf data-centre operator suffered these failures during 2026.
AI-Based Logistics Platforms: Efficiency Gains, Model Risk and the Problem of Automated Decisions
Artificial intelligence introduces a distinct class of operational dependencies because its output can influence decisions without being a direct measurement of physical reality. Conventional logistics software may retrieve a recorded container position or calculate a route using defined inputs and deterministic rules. AI-based systems can instead infer arrival times, estimate disruption probabilities, propose alternative suppliers or optimise transport allocation using statistical relationships derived from historical and current data. These capabilities can improve responsiveness under ordinary conditions, but geopolitical disruption exposes limitations associated with rapidly changing distributions, incomplete observations and the tendency of some systems to express uncertain estimates as apparently precise outputs.
A model trained on historical vessel movements may be poorly calibrated when the underlying route network changes suddenly. A predictive arrival-time system may continue using historical transit patterns after operators begin omitting ports or diverting vessels. An inventory-planning model may assume the continued availability of regular replenishment when customs restrictions, terminal congestion or airspace disruptions invalidate the underlying schedule. A supplier-risk model may fail to identify concentration if several nominally independent suppliers rely on the same intermediate logistics hub or digital provider. These failures do not necessarily require hostile interference. They can arise because the model’s statistical assumptions no longer represent the operating environment.
The consequences become more significant when model recommendations directly initiate commercial actions. A system that automatically reschedules deliveries, increases orders, reallocates cargo or changes distribution priorities may produce widespread effects if its inputs are unreliable. A false vessel position could trigger incorrect arrival predictions, which could then influence warehouse staffing, transport dispatch and customer commitments. An automated planning system could interpret missing shipment data as evidence of cargo loss rather than a temporary telemetry outage. A procurement algorithm could overreact to a transient market signal and generate purchases that increase costs rather than improving resilience. The risk is therefore not merely that AI predictions become inaccurate, but that erroneous predictions are converted into operational instructions before their assumptions have been reviewed.
An effective design must distinguish observation, estimation, recommendation and execution. Observed events should retain their source and confidence status. Predictions should be explicitly identified as estimates and accompanied by meaningful indicators of uncertainty where available. Recommendations should preserve the assumptions under which they were generated, particularly when involving high-impact actions. Execution rights should be constrained so that automated systems cannot alter safety-critical or financially material operations without appropriate authorisation. This does not imply that manual approval is required for every routine transaction. It means that the level of human control should increase with the consequences of an erroneous decision and the uncertainty of its supporting information.
The NIST operational-technology framework is relevant because it treats the interaction between cyber systems and physical processes as a fundamental security consideration. Its September 2026 draft revision extends the discussion of cloud convergence, industrial internet-connected systems and protection of operational-management functions. These developments provide a standards-based foundation for examining the interfaces between digital decision systems and physical operations, although the draft does not certify the safety of any particular AI logistics platform. Guide to Operational Technology Security, Revision 4, Initial Public Draft — National Institute of Standards and Technology — September 2026.
AI logistics failure modes and practical controls
| Failure mode | Underlying cause | Potential operational effect | Recommended control |
|---|---|---|---|
| Model drift | Historical routes no longer represent current conditions | Incorrect arrival predictions | Change detection and model recalibration |
| Data contamination | Corrupted or spoofed tracking inputs | False shipment status | Independent data validation |
| Missing-data misclassification | Telemetry gaps treated as physical events | Unnecessary intervention | Explicit unknown-data status |
| Excessive automation | Recommendations executed without suitable checks | Cascading commercial errors | Risk-based execution authority |
| Supplier-concentration blindness | Shared upstream dependencies omitted | False diversification assumptions | Multi-tier supplier and infrastructure mapping |
| Optimisation under invalid constraints | Port or route availability changes | Infeasible transport plans | Verified operational constraints |
| Model-service outage | AI platform becomes inaccessible | Loss of planning capability | Deterministic fallback methods |
| Poor auditability | Decisions lack reproducible inputs | Disputes and difficult incident reconstruction | Decision logs and model-version records |
| Uncertain prediction presented as fact | Poor uncertainty communication | Misleading commercial commitments | Confidence calibration and clear estimates |
The table identifies operationally plausible mechanisms, not a list of confirmed attacks against specific AI systems in the Gulf crisis.
An additional concern is the distinction between AI system availability and the validity of its recommendations. A cloud-hosted model may remain accessible throughout an incident while producing materially worse predictions because the underlying data are incomplete or the economic relationships have changed. Conversely, the temporary unavailability of an optimisation engine may have limited consequences if the organisation retains usable shipment records and can implement deterministic operating procedures. The objective of resilience is therefore not uninterrupted AI inference at any cost, but the continued ability to make safe, accountable and commercially defensible decisions.
Operational Technology: The Point at Which Digital Failure Becomes Physical Interruption
Operational technology constitutes the most direct interface between cyber incidents and physical industrial activity. Ports, terminals, warehouses and logistics facilities use programmable control systems to operate machinery, monitor equipment, regulate environmental conditions and coordinate automated processes. These systems differ from conventional business IT because an interruption can immediately affect safety, equipment movement or the physical condition of goods. A malfunction in a financial reporting application may delay administration; a failure affecting a container crane’s control system, refrigerated storage environment or industrial pumping process can interrupt the movement or preservation of physical assets.
NIST defines operational technology broadly to include programmable devices and systems that interact with the physical environment or manage devices that do so. Its final Revision 3 guidance explicitly addresses the need to protect safety and reliability alongside information security. The September 2026 draft Revision 4 further identifies maritime vessels, freight rail, building automation, industrial internet-connected systems and cloud environments among the areas requiring attention. This expansion is significant because operational technology is increasingly connected to enterprise networks and external service providers. Connectivity permits remote diagnostics, predictive maintenance and coordinated operations, but also introduces dependencies on systems that may not have been designed around the safety and availability requirements of industrial equipment. Guide to Operational Technology Security, Revision 3 — National Institute of Standards and Technology — September 2023; Guide to Operational Technology Security, Revision 4, Initial Public Draft — National Institute of Standards and Technology — September 2026.
For container terminals, the principal cyber-physical interfaces can include terminal operating systems, crane management, gate controls, automated stacking equipment, reefer monitoring and internal communications. The risk profile differs across these components. A terminal-management database outage may prevent the allocation or release of containers despite available physical handling equipment. An equipment-control failure may require a particular operating area to stop for safety reasons. Loss of reefer monitoring may prevent operators from confirming that temperature-sensitive goods remain within required conditions. Disruption of gate systems may obstruct truck entry and exit even while vessel berths remain accessible. These mechanisms demonstrate why a terminal can be physically undamaged but commercially unable to process cargo at normal rates.
Industrial facilities connected to international logistics networks face comparable exposure. Refineries, petrochemical plants and storage installations depend on industrial controllers and safety systems whose operating requirements are materially different from those of ordinary enterprise applications. Remote access, network connectivity and data integration can improve maintenance and production coordination, but they must be managed in ways that preserve the independence and functionality of essential safety protections. An organisation that permits business-network compromise to propagate into industrial control systems can expose physical operations to risks exceeding the initial information-security incident. The appropriate safeguards require architecture-specific assessment rather than generic assumptions that conventional endpoint security is sufficient.
An effective resilience programme must therefore identify which physical functions remain safe during partial or complete loss of digital services. Some operations can continue through manual or local control procedures, while others must enter a controlled safe state. The distinction is not merely financial. Attempting to maintain throughput after safety-critical control integrity has been lost can create risks to personnel, equipment and the surrounding environment. Recovery procedures must establish when equipment can safely restart, whether operating parameters remain valid and whether data accumulated during the disruption can be reconciled without introducing new errors.
Cyber-physical dependencies across logistics infrastructure
| Infrastructure function | Critical digital dependency | Physical consequence of failure | Appropriate continuity objective |
|---|---|---|---|
| Container terminal planning | Terminal operating system and cargo records | Delayed handling or release of containers | Preserve verified cargo identity and controlled movement |
| Container cranes | Equipment control and safety functions | Handling interruption or unsafe operation | Maintain safe-state capability and validated restart |
| Automated warehouses | Warehouse management and local controllers | Restricted picking, sorting or dispatch | Continue priority functions where safely possible |
| Refrigerated logistics | Monitoring, controls and electrical supply | Potential temperature excursions | Preserve environmental control and independent records |
| Tank storage and pumping | Industrial controllers, instrumentation and power | Transfer interruption or unsafe process conditions | Maintain independent safety protections |
| Port access gates | Identity, appointments and cargo-release systems | Truck queues and terminal congestion | Authenticated manual or alternate processing |
| Rail terminals | Dispatch, signalling and equipment systems | Restricted movement of cargo | Maintain safe traffic-control procedures |
| Customs interfaces | Electronic declarations and authorisations | Delayed legal release of goods | Approved contingency processing |
| Vessel maintenance | Diagnostic software and equipment data | Reduced ability to assess technical condition | Preserve essential local maintenance capability |
The importance of these dependencies is reflected in the IMO’s maritime cyber-risk framework. The organisation defines maritime cyber risk in relation to circumstances capable of causing operational, safety or security failures through the corruption, loss or compromise of technology assets. Its guidance addresses cyber-risk identification, protection, detection, response and recovery within maritime operations, while the maritime single-window framework recognises the particular exposure of electronic certificates, pre-arrival information and ship–shore data exchange. Maritime Cyber Risk — International Maritime Organization; Maritime Single Window — International Maritime Organization.
Maritime Single Windows, Customs Systems and Digital Trade Documentation
A further category of risk arises from the dependence of commercial shipping on digital administrative infrastructure. A vessel may be able to navigate safely and a port may possess functioning handling equipment, yet cargo operations can still be delayed if the electronic systems required for regulatory declarations, documentation or authorisation are unavailable. This vulnerability is especially significant because the international shipping process involves multiple public and private organisations whose procedures must be completed in a defined sequence. Information concerning the vessel, crew, cargo, health, security and customs status may have to be exchanged before arrival, during port operations or before goods can enter domestic circulation.
The IMO’s maritime single-window initiative addresses the digital exchange of information between ships and public authorities. The facilitation framework is designed to simplify and harmonise reporting, but the concentration of administrative processes within electronic systems creates a need for corresponding cybersecurity and continuity measures. The IMO explicitly recognises risks affecting maritime single windows, electronic certificates and ship–shore exchanges. Consequently, cyber resilience must extend to the legal and administrative processes authorising cargo movements rather than focusing solely on shipboard navigation or terminal machinery. Maritime Single Window — International Maritime Organization.
The commercial consequences of an administrative outage can be disproportionate to the apparent technical failure. If an electronic declaration cannot be submitted or validated, a container may remain in a terminal despite physical availability of trucks, cranes and storage space. The delay can increase dwell time and reduce yard capacity, potentially affecting other cargoes that are unrelated to the original system failure. If the affected system serves multiple terminals or a national customs network, the consequences can extend across several transport operators simultaneously. The risk becomes more serious where emergency procedures are poorly documented or where alternative processing remains legally unavailable.
A credible continuity arrangement must therefore distinguish technical restoration from legally effective processing. Restoring a database does not necessarily restore confidence in transactions entered during the outage. Reconstructing a cargo record may require reconciliation with customs declarations, shipping manifests, terminal events and carrier information. If inconsistent records are accepted automatically, the recovery process can create additional legal and commercial problems. Consequently, fallback procedures must preserve traceability, authentication and the ability to reconcile transactions after normal systems return.
For multinational manufacturers and retailers, these issues are directly relevant to business-continuity planning. Diversifying shipping routes does not provide sufficient resilience if the alternative ports depend on digital services that are unavailable or if the company’s own internal systems cannot generate the documents required for alternative customs procedures. The relevant dependency map should therefore encompass both physical routes and the information systems necessary to authorise their use.
Cybersecurity Evidence and the Limits of Geopolitical Attribution
The convergence of military conflict and cyber-physical vulnerability increases the importance of disciplined attribution. A digital-service interruption occurring during a military crisis may be caused by hostile cyber activity, physical infrastructure damage, a software defect, an ordinary equipment failure or a defensive measure taken by the operator. The occurrence of an outage near the time of a military incident is insufficient to establish a causal connection. Similarly, an anomalous vessel or aircraft position does not establish that a specific government conducted electronic interference. A rigorous assessment must distinguish technical observation, causal investigation and attribution to a responsible actor.
The European Union Agency for Cybersecurity’s threat reporting demonstrates why general cyber risk cannot be converted directly into claims about a particular conflict. The agency’s 2025 Threat Landscape analysed 4,875 incidents across the relevant reporting period, providing a broad picture of the European cyber environment. These observations support concern about the frequency and diversity of cyber incidents affecting modern organisations, but they do not establish the prevalence of particular attack types against Gulf ports, aviation operators or cloud facilities in October 2026. ENISA Threat Landscape 2025 — European Union Agency for Cybersecurity — September 2026 revision.
The distinction between malicious cyber action and electronic-warfare interference is equally important. GNSS jamming or spoofing can be associated with radio-frequency activity rather than compromise of the software or networks operated by the affected organisation. A vessel may experience satellite-navigation degradation without any intrusion into its internal information systems. Conversely, a cyber intrusion can corrupt cargo records or industrial configurations without producing any visible anomaly in GNSS or AIS data. These mechanisms can occur independently or in combination, but a comprehensive threat assessment should not merge them into an undifferentiated category of cyberattack.
A high-confidence attribution would require an appropriately documented evidentiary chain. For digital incidents, that may include verified logs, forensic analysis, infrastructure evidence and competent authority findings. For electronic interference, technical localisation, signal analysis and corroborating observations may be relevant. For physical damage, forensic examination and independently corroborated incident records can establish a different body of evidence. The required standard depends on whether the claim concerns technical cause, operational responsibility or international legal attribution. Each is a separate proposition.
Evidence classification for cyber-physical incidents
| Evidence category | What it can establish | What it cannot establish alone | Appropriate confidence treatment |
|---|---|---|---|
| Verified GNSS anomaly | Navigation data became inconsistent or unavailable | Responsible actor or deliberate intent | High for observation; lower for attribution |
| AIS track discontinuity | Tracking record contains a gap | Vessel attack or intentional concealment | Requires corroboration |
| Confirmed cloud-service outage | Specified service was unavailable | Hostile cyber operation | Cause must be investigated |
| Operator cyber incident disclosure | Operator-reported compromise or disruption | Independent attribution beyond the disclosure | Attribute precisely |
| National cybersecurity advisory | Official assessment of threat or incident | Universal applicability to all operators | Evaluate scope and evidence |
| Forensic technical report | Mechanism and affected systems within its scope | Broader strategic intent without additional evidence | Confidence depends on methodology |
| Military or intelligence statement | Government’s attributed assessment | Independent proof of all asserted details | Preserve institutional attribution |
| Social-media tracking anomaly | An observation requiring investigation | Verified attack or operational loss | Discovery only |
This framework is necessary because strategic planners can make damaging decisions when preliminary information is presented as verified. Overstating an incident may lead to unnecessary route abandonment or costly emergency actions. Understating a genuine systems compromise can allow contaminated data or unsafe operating conditions to persist. The appropriate response is to preserve uncertainty explicitly while obtaining evidence capable of resolving the operational decision.
Critical-Service Resilience: From Cybersecurity Compliance to Demonstrated Operational Recovery
The most useful measure of cyber-physical resilience is not whether an organisation possesses an extensive catalogue of security controls, but whether it can continue essential activities at an acceptable level when selected systems fail. This requires identifying business functions whose interruption would create unacceptable safety, legal, financial or operational consequences. The assessment must then determine which information systems, facilities, data feeds, credentials, telecommunications services and external providers are necessary to sustain those functions. The resulting dependency structure should be tested against credible failure combinations rather than examined as a collection of isolated software applications.
NIST’s operational-technology guidance supports the separation of safety-critical and business-system requirements. In logistics facilities, essential equipment control may require local autonomy and independent safety protections, while administrative systems may tolerate temporary delays provided records remain recoverable. A warehouse may continue selected physical operations using controlled local procedures, whereas a port terminal may need to restrict equipment movement if container identification or safety information cannot be verified. The correct operating mode depends on the consequences of error. Continuity should therefore be understood as safe degradation of service rather than the unconditional preservation of maximum throughput. Guide to Operational Technology Security, Revision 3 — National Institute of Standards and Technology — September 2023.
Recovery-time objectives and recovery-point objectives are useful only when they correspond to the actual operational function. A nominal four-hour application recovery objective is insufficient if restoring the database requires an additional day of shipment reconciliation before goods can be released. Similarly, a backup with a short recovery-point objective may not be reliable if the underlying records had already been corrupted before the backup was created. Organisations must therefore test both technical restoration and the validity of recovered information. The ability to resume a software application is not equivalent to the ability to resume safe commercial operations.
The following framework illustrates how resilience targets should be specified. No universal recovery-time figures are assigned because acceptable tolerances differ across facilities, cargo types and contractual obligations.
Operational recovery and continuity requirements
| Essential function | Critical failure scenario | Recovery evidence | Decision-relevant measure |
|---|---|---|---|
| Vessel-position monitoring | Unreliable GNSS or AIS input | Independent track reconciliation | Time to restore trustworthy situational awareness |
| Cargo identity and release | Unavailable or corrupted records | Validated cargo-manifest and customs reconciliation | Time to resume lawful release |
| Port equipment operation | Loss of control-system integrity | Safe shutdown and validated restart | Time to restore safe handling capacity |
| Cold-chain management | Monitoring or power interruption | Independent temperature records and equipment recovery | Duration of controlled-temperature preservation |
| Warehouse dispatch | Warehouse-management outage | Controlled alternative picking and dispatch | Sustainable throughput under degraded conditions |
| Transport planning | Cloud logistics platform unavailable | Exported schedules and alternate dispatch procedures | Ability to complete priority movements |
| Supplier communication | Primary communications unavailable | Independent contact channels and approved procedures | Time to establish reliable coordination |
| Financial settlement | Transaction or identity service outage | Reconciled records and authorised payments | Time to restore essential commercial commitments |
| AI-based optimisation | Model service unavailable or unreliable | Deterministic planning fallback | Ability to make safe, defensible decisions without AI |
The framework highlights why recovery must be tested across organisational boundaries. A manufacturer may restore its internal procurement system while its logistics provider remains unable to confirm vessel movements. A port may resume operations while customs processing is unavailable. A cloud provider may restore service while its customers lack the credentials or reconciled records needed to restart business processes. A meaningful recovery exercise must therefore involve the relevant counterparties and validate the complete transaction chain rather than merely restarting individual applications.
The economic value of resilience can be analysed through the expected consequences of interruption, but precise optimisation requires evidence about incident likelihood, duration, recovery performance and financial losses. Without defensible inputs, numerical risk scores can create a misleading appearance of precision. For infrastructure operators, a more useful initial approach is to define maximum tolerable disruption for each essential function, identify the dependencies capable of exceeding that tolerance and test whether existing safeguards prevent the unacceptable outcome. Where the consequences include physical safety or legal compliance, acceptable thresholds may be determined by regulatory or safety requirements rather than financial cost alone.
Strategic Indicators for 2027–2030: Detecting a Transition from Localised Interference to Systemic Digital Risk
The trajectory of cyber-physical risk through 2030 will depend on two interacting developments: the persistence of regional insecurity and the increasing degree of digital integration within international transport. As organisations adopt more automated planning systems, interconnected terminal operations and cloud-hosted logistics applications, the number of decisions dependent on continuous digital information may rise. This can improve efficiency and permit faster adaptation to ordinary delays, but it may also increase exposure to shared data-integrity failures and correlated service outages. The strategic question is therefore whether investments in automation are accompanied by sufficient development of independent validation, safe fallback procedures and supplier-level transparency.
An important warning indicator would be an increase in confirmed cases where navigation interference affects not only individual vessel or aircraft systems but also downstream commercial processing. Such cases would establish a more direct connection between electronic interference and supply-chain disruption than positioning anomalies alone. Another indicator would be repeated outages affecting several nominally independent logistics platforms because of a common cloud or identity-service dependency. A third would be demonstrated difficulty restoring industrial operations after cyber incidents despite the availability of backups or redundant facilities. Each development would suggest that existing architecture was insufficiently independent or that recovery arrangements had not addressed the complete operational process.
Conversely, a reduction in GNSS interference, improvement in the consistency of maritime and aviation tracking records and documented success in degraded-mode operational exercises would support a more favourable assessment. The relevant evidence should include both technical measures and actual operating outcomes. A navigation receiver may report improved availability while the quality of downstream cargo predictions remains poor. A cloud platform may achieve high technical uptime while users continue to encounter significant failures in data reconciliation. A terminal may possess an incident-response plan without demonstrating that it can resume cargo handling safely after a systems failure. Indicators should therefore measure operational consequences rather than relying solely on system-availability claims.
Strategic monitoring framework
| Indicator | Observation required | Deterioration signal | Improvement signal |
|---|---|---|---|
| GNSS reliability | Validated interference reports by area and time | Broader or more persistent degradation | Sustained reduction in verified interference |
| AIS integrity | Anomalous position rates and independent vessel validation | Increasing unresolved discrepancies | More complete, validated movement histories |
| Aviation navigation | EASA and ICAO notices, operator reports | New restrictions or expanded affected areas | Reduced advisories supported by operational evidence |
| Cloud-service concentration | Shared provider, region and identity dependencies | More critical functions dependent on one failure domain | Demonstrated independent recovery capability |
| Terminal technology | Verified OT incidents and recovery results | Longer interruptions or unsafe operating conditions | Successful controlled recovery exercises |
| Digital logistics platforms | Shipment-record integrity and service continuity | Repeated data loss or unreconciled transactions | Shorter verified recovery and reconciliation periods |
| AI decision systems | Prediction errors during disruption | Persistent model drift or automated operational errors | Calibrated predictions and reliable fallback |
| Maritime administration | Availability of electronic declarations and clearance services | Repeated disruption of legal cargo processing | Tested alternate processing and reconciliation |
| Supplier resilience | Evidence of common upstream dependencies | Multiple supplier outages from one digital failure | Independently validated alternatives |
The monitoring system should preserve distinctions between observation, impact and attribution. A verified increase in navigation interference establishes deterioration in the operating environment without necessarily proving a hostile state-directed campaign. A confirmed cloud outage establishes service unavailability without determining whether the cause was physical damage, cyber intrusion or configuration error. The quality of strategic warning depends on maintaining these distinctions while identifying the consequences that require action.
Key Judgments
The first judgment, with high confidence, is that GNSS interference constitutes a documented operational hazard affecting maritime and aviation activities in and around regional conflict areas. The IMO, ICAO and EASA have each identified navigation-system vulnerabilities and the need for operational safeguards. Their records support the existence of a material technical problem, although individual incidents require separate attribution and consequence assessment.
The second judgment, with high confidence, is that digital information integrity has become an essential component of physical logistics continuity. Vessel tracking, cargo processing, customs clearance and terminal operations depend on accurate and available information. The failure of an essential data source or digital service can therefore disrupt commerce independently of physical damage to vessels or infrastructure.
The third judgment, with medium-to-high confidence, is that cloud and third-party technology concentration can create correlated disruption across apparently diversified logistics networks. The relevant mechanism is dependence on shared technical services and failure domains. The available evidence does not justify quantifying Gulf-wide cloud concentration or asserting that specific regional facilities have been attacked without additional operator-level documentation.
The fourth judgment, with medium confidence, is that the increasing adoption of AI-based logistics systems will make data-quality and model-governance failures more consequential through 2030 unless automated decisions remain subject to appropriate controls. This is a forward-looking technical assessment based on the relationship between automated decision-making and uncertain operational data, rather than a claim of already documented systemic AI failure.
The fifth judgment, with high confidence, is that effective resilience requires demonstrated recovery of essential functions rather than technical redundancy alone. Independent infrastructure, validated records, secure fallback procedures and rehearsed recovery arrangements address different failure modes. Their value must be established through actual operational testing.
What Would Change the Assessment
The assessment would become materially more adverse if competent authorities or infrastructure operators documented coordinated attacks against regional cloud or AI facilities, repeated compromise of industrial control systems at strategically important terminals, or sustained navigation interference causing verified disruption to commercial shipping or aviation operations. Such evidence would establish a stronger connection between hostile activity and the functioning of digital logistics infrastructure than is currently supported by the public record. Particular importance would attach to incidents demonstrating common-mode failure across multiple operators or jurisdictions, because these would challenge the assumption that contractual diversification necessarily provides operational independence.
A more favourable assessment would require evidence that operators can maintain safe functions during extended GNSS degradation, restore reliable shipment and cargo records after cloud outages, and resume critical physical processes through tested recovery procedures. Continued development of independent navigation capabilities, clearer maritime cyber-risk requirements and more transparent reporting of digital-service incidents would strengthen the basis for evaluating resilience. However, policy announcements or technical procurement alone would be insufficient evidence of effective recovery capacity.
The most consequential evidence gaps remain operator-level records concerning regional cloud-service dependencies, verified incidents affecting industrial control systems, measured recovery performance of major logistics platforms and the extent to which independent vessel and aircraft positioning information can be preserved during interference. Additional information is required to distinguish genuine hostile targeting of AI infrastructure from ordinary infrastructure outages and the general vulnerability of highly connected systems.
Chapter 7 — Final Net Assessment
The digital transformation of international logistics has created substantial productivity benefits while making the integrity and availability of information increasingly important to the safe operation of physical transport infrastructure. The Middle Eastern crisis demonstrates the relevance of this dependency through documented GNSS jamming and spoofing, continued navigation warnings and the need for differentiated aviation-security assessments. These observations establish that electronic interference can undermine trusted positioning and complicate commercial situational awareness without requiring the destruction of vessels, aircraft or port facilities.
The broader vulnerability arises when positioning systems, cargo records, cloud platforms, industrial controls and automated decisions depend on shared technical services. In such circumstances, an incident affecting one component can interrupt several commercial functions, while nominal infrastructure redundancy may prove ineffective if critical identity, data or communications dependencies remain concentrated. The growing use of AI-based planning introduces additional model and data-integrity risks, particularly when historical operating assumptions no longer represent the conditions prevailing during geopolitical disruption.
The defining requirement through 2030 is therefore the preservation of trusted operational decision-making under degraded digital conditions. The organisations most capable of sustaining continuity will be those that can verify critical information independently, identify common technological dependencies, operate essential functions safely without unrestricted cloud or navigation services, and restore accurate records before normal operations resume. Digital resilience should be judged by demonstrated physical and commercial continuity, not by the number of cybersecurity products deployed, the nominal availability of cloud infrastructure or the sophistication of automated forecasts.
Chapter 8. Scenarios for 2027–2030 and the Economics of Supply-Chain Resilience
Principal Judgment: The Most Defensible Planning Assumption Is Uneven Recovery Rather Than Permanent Closure or Immediate Normalisation
The strategic outlook through 2030 is defined by the possibility that geopolitical hostilities, maritime access, energy availability and commercial logistics recover at different speeds. A reduction in military attacks may permit selected vessel movements without restoring ordinary insurance conditions. Increased crude exports may improve petroleum-market balances while LNG or chemical cargoes remain constrained. A carrier may resume direct services while alternative ports continue to experience congestion, and a manufacturer may obtain lower material prices while still financing elevated inventories because delivery uncertainty persists. These differences make any single reopening date inadequate as a measure of economic normalisation. For policymakers and business leaders, the relevant task is to distinguish the recovery of physical access from recovery of usable capacity and from the later restoration of commercially sustainable operations.
The EIA’s October 2026 outlook provides a conditional energy-market baseline for this analysis. It anticipated that most regional production would return toward pre-conflict levels by the end of the second quarter of 2027, supported by bypass routes, ship-to-ship transfers and additional infrastructure. The agency projected Brent averaging approximately $87 per barrel in the second quarter of 2027 and $74 in the fourth quarter. Yet the forecast was completed on 1 October, before the full sequence of October maritime incidents was recorded. It therefore constitutes a defined forecast conditional on assumptions about recovery, not a verified description of the future. Global Oil Markets — U.S. Energy Information Administration — October 2026.
The evidence available at the end of October supports three principal pathways: a sustained negotiated stabilisation, prolonged intermittent disruption and renewed high-intensity escalation. These scenarios are constructed as distinct dominant conditions rather than as predictions of mutually exclusive events over the entire period to 2030. A period of stabilisation may be interrupted by renewed hostilities; an escalation may subsequently produce another negotiated settlement. The available record does not support statistically defensible numerical probabilities for these transitions. Assigning percentages without a transparent base-rate or forecasting model would create false precision.
Scenario One: Sustained Stabilisation and Progressive Commercial Normalisation
The stabilisation scenario assumes that diplomatic commitments produce an observable and sustained decline in attacks against maritime traffic and essential infrastructure, accompanied by improved commercial access to ports and export facilities. Its critical feature is not the announcement of another ceasefire but the repeated completion of normal commercial operations under conditions accepted by vessel operators, insurers, port authorities and cargo owners. Restoration would need to occur across several categories of shipping because the recovery of crude exports alone would not establish adequate access for LNG, chemicals or containerised goods.
Under this scenario, shorter shipping routes would progressively become available for services that had been diverted, reducing the vessel-days required to transport a given cargo volume. This would release effective carrying capacity and could reduce some exceptional freight costs. The rate of adjustment would depend on service rotations, vessel positioning, terminal arrangements and the availability of containers at exporting locations. The return of direct maritime access could also reduce reliance on exceptional inland corridors and emergency transshipment. However, the associated financial benefits would not necessarily materialise immediately because carriers and cargo owners would need to revise contracts, schedules and inventories.
The energy-market implications are consistent with the direction of the EIA’s October baseline, provided that the forecast assumptions concerning production recovery and export capacity are fulfilled. Improved supply could reduce the pressure on crude benchmarks and facilitate replenishment of inventories. Petrochemical availability would recover according to the operating status of processing facilities, feedstock delivery and specialist shipping capacity. It would be analytically incorrect to assume that all polymer grades or chemical intermediates would normalise simultaneously.
The principal risk of this scenario lies in premature dismantling of contingency arrangements. Companies that terminate alternative supplier relationships or reduce critical inventories immediately after a political announcement may face renewed exposure if the settlement proves fragile. The economically appropriate response is a staged reduction of exceptional resilience expenditure linked to documented improvements in delivery reliability.
Scenario Two: Prolonged Low-Intensity Disruption and the Institutionalisation of Commercial Risk Premiums
The prolonged-disruption scenario assumes that a degree of maritime access continues but remains subject to recurring security incidents, selective passage, changing insurance conditions and intermittent infrastructure restrictions. It is the leading qualitative working scenario because it is consistent with the coexistence of documented attacks, partial operating recovery and changing shipping arrangements during 2026. This judgment is not based on a calibrated probability model.
In this environment, shipping companies maintain flexible route structures rather than restoring every previously scheduled service. Some voyages proceed through Hormuz while others are delayed, cancelled or transferred to alternative arrangements. Freight costs become sensitive to specific vessel classes, destinations and contract terms. The financial consequences are therefore uneven: a company with stable long-term access to transport may face a different cost trajectory from one dependent on emergency spot-market capacity.
Energy prices under this scenario would reflect the interaction between recovering production and recurring interruptions. The EIA’s October forecast illustrates how a partial supply recovery can coexist with elevated prices and short-term volatility. Its estimates of shut-in production declined from 10.9 million barrels per day at the May peak to 4.8 million in September, but its forecast still anticipated 4.5 million barrels per day of average shut-ins during the fourth quarter. This establishes that improving supply conditions need not imply full restoration. Global Oil Markets — U.S. Energy Information Administration — October 2026.
For manufacturers, prolonged disruption can make certain resilience expenditures effectively permanent. Qualified alternative suppliers, selective inventory reserves, supplementary transport capacity and enhanced shipment visibility may become ordinary operating requirements rather than emergency measures. The economic challenge is to design these arrangements efficiently, preserving continuity without maintaining unnecessary maximum redundancy. Businesses able to finance and coordinate such networks may gain a competitive advantage over firms whose margins depend on minimal inventories and concentrated purchasing.
Scenario Three: Renewed High-Intensity Conflict and Multiple Infrastructure Failures
The high-intensity escalation scenario assumes that renewed hostilities substantially increase attacks against ships, energy facilities, transport infrastructure or other strategic assets. Under such conditions, the relevant economic outcome may shift from higher transportation costs to actual unavailability of transport or supply. An insurer may decline particular risks, a vessel operator may suspend a service, an export terminal may become temporarily inaccessible or a specialised input may no longer be obtainable within the required delivery period. The distinction between expensive service and unavailable service becomes the central operational concern.
The September interruption of the Saudi East–West pipeline demonstrates why the scenario cannot be limited to Hormuz. An attack against a bypass route can reduce its value precisely when the original corridor is constrained. A simultaneous deterioration in maritime security and alternative infrastructure availability could therefore create a greater supply shock than either event in isolation. In such circumstances, production shut-ins, inventory withdrawals and changes in crude prices would need to be assessed using current physical supply information rather than historical averages. Global Oil Markets — U.S. Energy Information Administration — October 2026.
The consequences for manufacturing would be especially severe where critical inputs possess limited substitutes or long qualification periods. Emergency procurement may become ineffective when several competing firms seek capacity from the same alternative producers. Higher prices cannot guarantee supply if physical production or transport availability is insufficient. A company may therefore have to prioritise products, customers or production lines rather than attempting to maintain normal output across every activity.
The appropriate continuity response is consequently different from the prolonged-disruption scenario. Maintaining additional inventories or paying freight surcharges may be sufficient under intermittent delays but inadequate under prolonged physical inaccessibility. High-intensity escalation requires the ability to allocate scarce materials, preserve essential production, manage contractual commitments and protect liquidity while operating below normal capacity.
Quantitative Scenario Comparison: Observed Figures, Forecasts and Conditional Operating Effects
The following table separates the documented baseline from qualitative scenario outcomes. Numerical changes in freight rates and transit times are not invented where comparable current evidence is unavailable.
| Dimension | Sustained stabilisation | Prolonged disruption | Renewed escalation |
|---|---|---|---|
| Hormuz access | Progressively reliable commercial passage | Intermittent or selective passage | Severe restrictions and possible service suspension |
| Maritime incident pattern | Sustained reduction | Recurring localised incidents | Higher intensity or broader geographical exposure |
| Transit time | Gradual return toward shorter viable routes | Variable delays and service-specific diversions | Severe delay or unavailable transport for affected routes |
| Freight-rate direction | Exceptional premiums may decline | Continuing volatility | Sharp increases or unavailable capacity possible |
| Insurance | Progressive restoration of acceptable conditions | Exceptional terms may persist | More restrictive cover and exclusions possible |
| Crude availability | Recovery toward the EIA baseline assumptions | Uneven production and export restoration | Further production losses possible |
| LNG availability | Depends on reliable loading and receiving capacity | Contract- and route-specific constraints | Severe exposure where alternatives are limited |
| Petrochemicals | Gradual feedstock and intermediate recovery | Localised shortages and pricing volatility | Material unavailability in vulnerable supply chains |
| Container operations | Improved schedule reliability | Continued substitutions and congestion | Major service interruption possible |
| Inventory response | Gradually optimise contingency stock | Maintain targeted buffers | Prioritise essential production and customers |
| Financial response | Release unnecessary emergency working capital | Preserve liquidity and financing capacity | Protect cash and reduce nonessential commitments |
| Planning horizon | Monitor quarterly progress | Maintain rolling contingency plans | Prepare for immediate and sustained disruption |
The table provides directional operating conditions rather than numerical probabilities or universal freight-rate estimates. Actual outcomes depend on route, commodity, contract, infrastructure and the duration of disruption.
The Economics of Resilience: Why Maximum Redundancy Is Not the Optimal Objective
Resilience imposes real economic costs. Maintaining alternative suppliers requires commercial development, qualification and sometimes minimum purchasing commitments. Additional inventories require capital, storage and insurance. Alternative freight arrangements may involve capacity-reservation charges or higher unit costs. Duplicate digital systems require maintenance, testing and secure data synchronisation. The central economic problem is therefore to determine which expenditures reduce the probability or consequences of business interruption sufficiently to justify their cost.
The appropriate decision begins with the value of the activity at risk. A manufacturing input representing a small share of total expenditure may deserve substantial protection if its absence can stop a high-value production line. Conversely, a large expenditure category may require relatively little contingency capacity if interchangeable suppliers and transport options are widely available. Procurement budgets alone are therefore a poor method for ranking critical supply-chain risks.
A second requirement is the independence of alternative capacity. A backup supplier located in a different country may still depend on the same feedstock producer, shipping route or cloud platform. Two transport providers may offer commercial diversity while using identical ports and vessels. A credible resilience investment must therefore reduce the underlying common failure mechanism, not merely increase the number of contractual counterparties.
A third requirement concerns financing. Additional inventory can preserve production during disruption but creates working-capital obligations. The relevant investment decision compares the carrying cost of that inventory with the economic consequences of potential shortage. Because future disruption probabilities cannot be reliably quantified from the current record, decisions should use transparent sensitivity analysis rather than unsupported numerical risk scores.
Illustrative inventory-financing sensitivity
Assume that a company holds an additional $10 million of inventory solely for continuity purposes. The calculation below shows annual financing expenditure at alternative hypothetical interest rates. It excludes warehousing, insurance, obsolescence and other carrying costs.
| Annual financing rate | Incremental inventory | Annual financing expense |
|---|---|---|
| 4% | $10 million | $400,000 |
| 6% | $10 million | $600,000 |
| 8% | $10 million | $800,000 |
| 10% | $10 million | $1,000,000 |
| 12% | $10 million | $1,200,000 |
These figures are planning calculations, not observed 2026 financing costs. Their significance is that inventory protection must be evaluated in relation to the financial cost of preserving stock and the value of disruptions avoided.
Contractual Resilience and the Distribution of Extraordinary Costs
The effectiveness of business-continuity arrangements depends partly on the allocation of risk across commercial contracts. A company may secure a supplier capable of producing additional goods but lack contractual access to available capacity when several buyers need it simultaneously. An alternative carrier may provide a route in principle but retain the right to cancel or modify operations under exceptional security conditions. A procurement agreement may provide fixed prices while permitting extraordinary freight or energy surcharges. Consequently, contractual existence does not guarantee enforceable access to physical capacity.
A more useful resilience agreement should specify the circumstances under which alternative capacity can be requested, the priority of allocation, pricing rules, delivery obligations and the treatment of extraordinary events. The provisions must be compatible with applicable law and the supplier’s actual capability. A contractual promise to deliver unavailable material has little practical value and may simply create financial disputes after the disruption.
Business-continuity contracts should also distinguish between the ability to perform and liability for non-performance. Force-majeure provisions, war-risk clauses, port-substitution rights, freight adjustments and delivery terms allocate consequences differently. Their effectiveness depends on the governing contract and jurisdiction. A company should not assume that a broad reference to geopolitical events provides comprehensive protection or automatic relief from obligations.
Resilience actions ranked by operational value
| Measure | Principal benefit | Implementation burden | Main limitation | Overall assessment |
|---|---|---|---|---|
| Multi-tier critical supplier mapping | Reveals hidden concentration | Significant data collection | Supplier disclosure limitations | High value |
| Qualified alternative suppliers | Provides usable substitute production | Qualification time and expense | Capacity may be unavailable | High value |
| Targeted safety stock | Protects against temporary delivery interruption | Working capital | Ineffective against very long shortages | High value when selective |
| Prearranged alternative freight | Reduces emergency procurement delays | Reservation and contracting cost | Corridor may share risks | High value |
| Independent shipment records | Supports operation during platform outages | Technical integration | Requires ongoing reconciliation | High value |
| Tested recovery procedures | Establishes actual continuity capability | Exercises and coordination | Must involve counterparties | High value |
| Multiple suppliers without dependency mapping | Provides apparent diversification | Additional procurement complexity | Hidden common dependencies | Limited value |
| Generic crisis dashboards | Improves information presentation | Software and maintenance | Cannot create physical supply | Limited without verified data |
| Unqualified substitute materials | Creates an apparent purchasing option | Potential testing and quality expense | May be unusable in production | Low immediate value |
| Uncontracted emergency routes | Identifies theoretical alternatives | Limited advance commitment | Capacity may disappear during crisis | Limited value |
| Maximum inventory across all categories | Increases stock availability | Very high financial burden | Obsolescence and cash constraints | Usually inefficient |
| Unverified AI forecasts | Potential analytical support | Model and data risk | False precision and unstable assumptions | Insufficient alone |
The most valuable measures are those that materially change the consequences of a specific plausible failure. Measures that improve presentation, nominal supplier counts or theoretical capacity without altering the underlying physical exposure are comparatively weak.
Decision Thresholds: Turning Monitoring into Action
A monitoring system is useful only when changes in its indicators lead to defined operational decisions. Watching oil prices, vessel movements and security advisories without specifying their implications for procurement or production can produce information overload while leaving the organisation unable to act quickly. Decision thresholds should therefore be linked to the consequences of disruption and the lead time required to implement an alternative.
For a manufacturer, one threshold might be the point at which verified expected delivery time exceeds available critical-material inventory coverage. The relevant action would be to activate an alternative source or prioritise production before the shortage occurs. For a logistics company, a threshold might involve the withdrawal of insurance coverage or confirmation that a specified terminal has suspended planned operations. For a retailer, a threshold might concern the inability to replenish essential products within the period required to maintain customer availability. The exact values depend on the business and cannot be prescribed universally from geopolitical data alone.
The following framework provides an operational connection between external evidence and internal decisions.
Monitoring indicators and linked management actions
| Indicator | Deterioration signal | Required verification | Management action |
|---|---|---|---|
| Hormuz vessel traffic | Sustained decline in completed cargo movements | AIS plus port and terminal data | Review exposed shipments and alternative supply |
| Maritime attacks | Increased frequency or severity | UKMTO and IMO incident records | Reassess route and insurance acceptability |
| Insurance | Withdrawal or material restriction of cover | Binding quotations and policy terms | Suspend uninsurable movements or activate alternatives |
| Energy supply | Production shut-ins or export-terminal outages | EIA, operator and authority reports | Review procurement and inventory assumptions |
| Petrochemical delivery | Confirmed reduction in available feedstocks | Supplier capacity and delivery confirmations | Activate qualified substitutes |
| Port congestion | Dwell time exceeds inventory or delivery tolerance | Terminal and carrier operating data | Redirect cargo where capacity is confirmed |
| Airline and airspace access | New restrictions affecting critical shipments | EASA, NOTAMs and operator schedules | Activate alternative air-cargo arrangements |
| Cloud logistics systems | Loss of essential service or data integrity | Provider status and internal validation | Switch to approved degraded-mode procedures |
| Supplier financial condition | Inability to finance production or deliveries | Financial and operating evidence | Increase oversight or activate backup supplier |
| Inventory coverage | Available stock falls below replenishment requirement | Verified stock and consumption records | Allocate stock and adjust production priorities |
The essential distinction is between monitoring that supports action and monitoring that merely describes disruption after it has already affected operations.
Medium-Term Outlook: Mid-2027, 2028 and 2030
The period through mid-2027 will be especially important because it overlaps with the energy-market recovery assumed in the EIA’s October 2026 outlook. If regional exports and production recover broadly as projected, the physical oil-market balance may improve and some extraordinary freight and inventory pressures could ease. However, the reliability of that recovery will depend on the continued absence of major infrastructure interruptions and the restoration of commercially sustainable shipping arrangements. The EIA explicitly anticipated continued short-term volatility even as its central forecast showed declining prices. October 2026 Short-Term Energy Outlook — U.S. Energy Information Administration.
By 2028, the principal commercial consequences will increasingly reflect investment and contractual decisions made during the disruption rather than only the immediate level of military activity. Companies that establish independent supplier capacity, qualified materials and effective recovery procedures may preserve those capabilities as part of ordinary operating arrangements. Others may return rapidly to concentrated sourcing in order to reduce visible costs, accepting renewed vulnerability if regional insecurity persists. The resulting distribution of resilience will depend on financing capacity, procurement expertise, bargaining power and the economic value of uninterrupted production.
Through 2030, three structural outcomes remain possible. A durable regional settlement could reduce extraordinary risk premiums and favour the restoration of efficient shorter routes. Persistent intermittent insecurity could institutionalise higher operating costs and encourage sustained diversification of transport and supply. Renewed high-intensity confrontation could accelerate investment in alternative infrastructure while also reducing the commercial reliability of existing bypass corridors. No one outcome can be assigned numerical dominance from the current evidence without a defensible forecasting methodology.
Final Net Assessment: The Cost of Inaction Will Be Unevenly Distributed
The Middle Eastern crisis has revealed that international economic resilience depends on more than abundant nominal shipping capacity, diversified supplier contracts or access to financial resources. It requires the ability to preserve physical production and commercial fulfilment when critical infrastructure becomes intermittently unavailable. Energy prices, maritime routes, insurance terms, industrial materials, digital services and inventory financing form a connected system in which disruption can propagate through several channels before reaching final consumers.
The most consequential near-term distinction is between physical recovery and commercially reliable recovery. Additional oil exports may improve the energy balance while leaving manufacturers exposed to specialised material shortages. More container vessels may increase nominal fleet capacity while longer routes reduce the number of voyages they can complete. Cloud redundancy may preserve computing infrastructure while shared identity or data dependencies prevent the resumption of essential operations. These differences make conventional indicators of capacity insufficient unless they are connected to actual operational performance.
The principal judgment, with medium confidence, is that uneven recovery remains the most defensible working assumption through 2027, while the persistence of structural risk premiums through 2030 depends on the durability of security arrangements and the commercial response to repeated disruption. This is a qualitative assessment rather than a numerical forecast.
The economic consequences will not be distributed equally. Governments will bear part of the cost of protecting infrastructure and maintaining emergency capabilities. Shipping operators and insurers will adjust pricing and capacity commitments. Manufacturers will finance additional inventories, qualify alternative materials and absorb the costs of interrupted production where resilience is inadequate. Retailers may encounter higher procurement and distribution costs, while consumers may ultimately bear part of those increases.
The financial burden of inaction will be most severe where a relatively inexpensive but indispensable component, service or route can interrupt a much larger economic activity. Conversely, indiscriminate investment in redundant capacity can weaken competitiveness without delivering proportionate protection. The appropriate objective is therefore selective, demonstrable continuity: sufficient independent capability to prevent critical failures, combined with the flexibility to release extraordinary costs when normal operations genuinely return.
A political settlement can change the security environment. It cannot, by itself, rebuild inventories, qualify suppliers, restore damaged infrastructure or correct the underlying concentration of industrial dependencies. Those adjustments will determine which governments and enterprises absorb the next disruption and which retain the capacity to operate through it.


