
















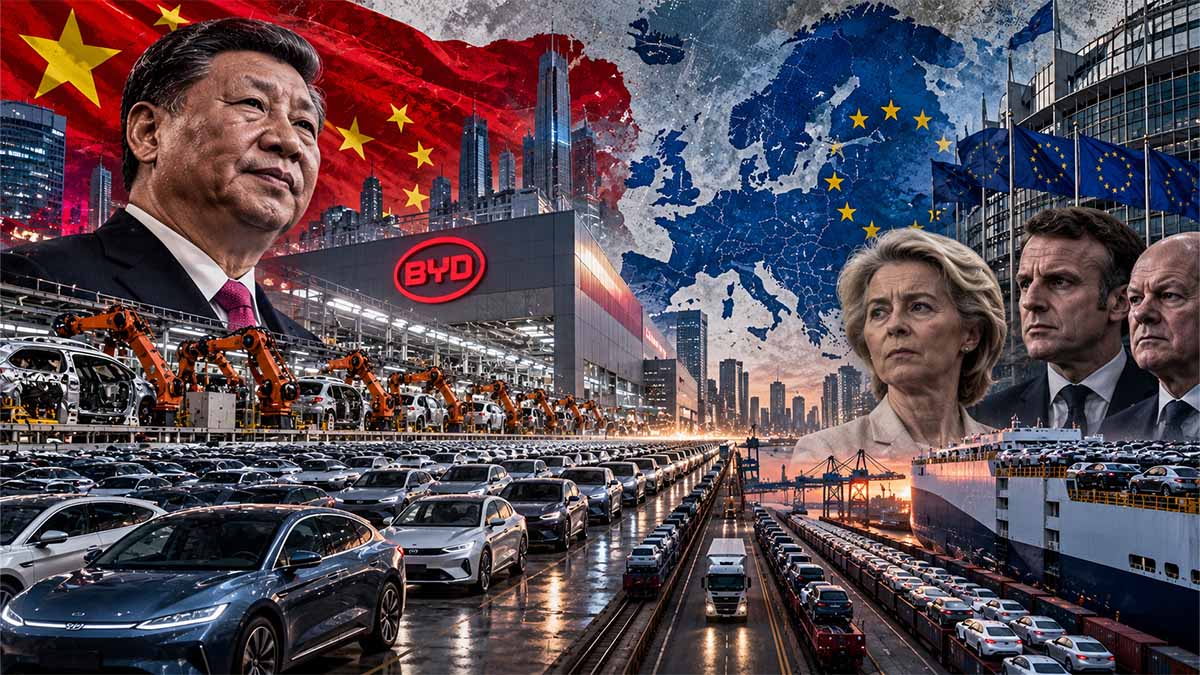
Industrial concentration, vertical integration, manufacturing economics and the strategic viability of Europe’s automotive production system.
Executive Summary — Bottom Line Up Front
European automotive manufacturers can remain viable against BYD’s Zhengzhou industrial ecosystem, but not by relying on established manufacturing structures, brand premiums or trade protection alone. Their strongest response is to combine simplified vehicle architectures, competitive battery sourcing, advanced automation, shorter development cycles and coordinated industrial investment. Europe does not need to replicate a 130 km² manufacturing district; it must reproduce the economic advantages that such a district can deliver when fully utilised.
The investigation establishes six central findings.
1. The physical scale is substantial, but frequently misrepresented. The reported 130 km² describes an expansive industrial-development concept rather than a verified completed factory. The approximately 22.5 km² satellite-derived footprint and 10.67 km² industrial-area figure refer to different reported boundaries. Neither is independently verified here as a current cadastral measurement.
2. The operational evidence is already material. Zhengzhou municipal reporting identifies approximately 600,000 BYD vehicles produced in 2025, following 545,000 in 2024. The complex is therefore an established high-volume manufacturing operation, not merely a speculative megaproject. 郑州市人民政府+1
3. Vertical integration is the more consequential competitive variable. BYD combines vehicle assembly with battery production, propulsion systems, electronic controls and a broad component ecosystem. The competitive advantage arises from coordinated engineering, procurement, manufacturing and logistics, rather than land area alone.
4. The measurable battery-cost disadvantage is significant. The International Energy Agency reports that average battery-pack prices in China were approximately 35% below European levels in 2025. European and American battery production costs could be as much as 50% higher than Chinese costs before public support, depending on production conditions. These are market-wide comparisons, not measured Zhengzhou-versus-Europe factory costs. IEA
5. Europe’s exposure is systemic. Chinese manufacturers supplied nearly 75% of global electric-car production in 2025, while China accounted for more than 80% of global battery manufacturing capacity. Europe’s challenge therefore extends beyond finished vehicles to cells, active materials, manufacturing equipment and component supply chains. IEA+1
6. The response must be industrial, not exclusively commercial. European manufacturers need investment discipline, higher plant utilisation, integrated software and electronics, competitive battery chemistry, and common supplier platforms. Authorities must strengthen upstream capacity, infrastructure, skills and fair competition while avoiding permanent subsidies for structurally uncompetitive factories.
Principal judgment: Zhengzhou provides credible evidence of an advanced industrial-organisation model, but the available record does not establish that its planned territorial scale generates proportionate cost advantages. The decisive test is whether integrated production consistently improves unit economics, capital productivity, quality and development speed at commercially sustainable utilisation rates.
BYD’s Zhengzhou Industrial Machine: Why Europe’s Automotive Future Will Be Decided Beyond the Assembly Line
Europe’s automotive industry is confronting a competitive threat that cannot be resolved by tariffs, subsidies or the preservation of existing factories. BYD’s expanding manufacturing complex at Zhengzhou, in China’s Henan province, illustrates a fundamental shift in industrial organisation: the integration of batteries, electronic components, electric propulsion and vehicle production within a coordinated manufacturing ecosystem. The reported development ambition of 130 square kilometres has attracted attention, but the decisive question is not the size of the industrial estate. It is whether Europe can compete with the cost structures, production flexibility and engineering coordination that such integration makes possible. With approximately 13 million European jobs directly or indirectly connected to the automotive sector, the consequences extend from corporate profitability to public finances, technological sovereignty and the future distribution of manufacturing power.
The 130-square-kilometre factory is not the real measure of Chinese industrial power
The territorial claims surrounding BYD’s Zhengzhou complex require a distinction that much of the public debate has overlooked. The frequently cited 130 km² represents a reported maximum development concept, not a verified operational factory. Satellite-based assessments have suggested approximately 22.5 km² of developed land, while another estimate identifies 10.67 km² of industrial facilities. These figures have not been independently reconciled against official cadastral boundaries or construction records. They cannot legitimately be treated as interchangeable measurements of productive capacity. Even the comparison with Paris, whose administrative territory covers approximately 105.4 km², describes geographical ambition rather than industrial efficiency.
The operating figures are considerably more revealing. According to the Henan provincial authorities, Zhengzhou manufactured 545,000 BYD new-energy vehicles in 2024 and employed approximately 60,000 people in early 2025. The Zhengzhou municipal government subsequently reported production of approximately 600,000 vehicles in 2025, representing indicative annual growth of 10.1%. BYD-associated gross industrial output reached RMB 95 billion that year. These figures establish the existence of a substantial operating manufacturing system, although they disclose neither its fully allocated unit cost nor its return on invested capital.
The physical comparison becomes still less persuasive when measured against established manufacturers. Hyundai’s Ulsan complex occupies approximately 5 km² and has nominal annual capacity of 1.41 million vehicles. Volkswagen’s Wolfsburg plant demonstrates another model of concentrated industrial production. The relevant distinction is between annual output, installed capacity and the activities included within each factory boundary. Zhengzhou’s industrial significance rests on the production functions coordinated within its wider ecosystem, not on an assumption that more industrial land necessarily produces more competitive vehicles.
China’s battery advantage changes the economics of the entire vehicle
The decisive industrial imbalance lies upstream of final assembly. According to the International Energy Agency’s Global EV Outlook 2026, China controlled more than 80% of worldwide battery manufacturing capacity at the end of 2025, compared with approximately 6–7% for the European Union. China also represented approximately 85% of cathode active-material production and more than 90% of anode active-material production. These concentrations give Chinese manufacturers access to an industrial ecosystem whose competitive advantages extend from materials processing to the manufacture of complete battery systems.
The price differential is substantial. The IEA reported that average battery-pack prices in China were approximately 35% below European levels in 2025, while battery manufacturing costs in Europe and the United States could be as much as 50% higher under the assessed conditions before public support. These are regional comparisons, not verified cost figures for Zhengzhou. Nevertheless, their commercial implications are direct. Applying a 35% differential to an illustrative European battery-pack price of €100 per kilowatt-hour produces a Chinese equivalent of €65. For a 60 kWh vehicle battery, the resulting difference is €2,100. Across 300,000 vehicles, the hypothetical annual expenditure difference reaches €630 million, before adjustments for chemistry, performance, contracts and logistics.
BYD’s organisational advantage is its ability to coordinate some of these cost decisions across the vehicle itself. Battery chemistry influences packaging, weight, thermal management, structural design and manufacturing complexity. Electric propulsion and power electronics similarly affect component architecture and production requirements. The company’s Blade Battery and cell-to-body technologies illustrate the importance it assigns to this integration. The benefits are conditional rather than automatic: internal production requires substantial capital, and superior suppliers may sometimes offer better economics. Yet Europe’s more fragmented industrial structure can impose additional engineering interfaces and purchasing dependencies precisely where Chinese competitors are seeking to reduce them.
Automation is valuable only when it reduces the cost of saleable output
China’s manufacturing advantage is increasingly reinforced by industrial automation. The International Federation of Robotics reported approximately 354,000 industrial robots installed in China during 2025, representing 59% of worldwide annual installations. Robot-density figures for 2024 placed China at 567 industrial robots per 10,000 manufacturing employees, compared with 449 in Germany and 231 across the European Union. Germany’s established automation capabilities demonstrate that Europe does not lack the necessary technology. The challenge is deploying it quickly and coherently enough to improve manufacturing economics.
A robot-intensive factory is not necessarily a productive factory. Welding, painting, battery assembly and quality inspection have different automation requirements, while faster equipment provides limited benefit if another production stage remains constrained. Artificial intelligence can improve defect detection, predictive maintenance and production scheduling, but its contribution depends on reliable industrial data and measurable reductions in waste, downtime or engineering delays. Claims of exceptionally high automation at Zhengzhou therefore require precise definitions before they can be used to establish superiority over European plants.
The financial effect of production efficiency can be decisive. In a hypothetical factory with 300,000 vehicles of sustainable annual capacity, €900 million in annual fixed manufacturing costs and €18,000 in variable costs per vehicle, total manufacturing cost would be €21,000 at full utilisation but €24,000 at 50% utilisation. The difference arises without any deterioration in the production technology. This is why the competitive objective must be quality-adjusted output at acceptable capital returns, not the maximum number of robots or the largest nominal factory capacity.
The same principle applies to vehicle development. Common architectures, integrated engineering and reusable components can reduce tooling expenditure and accelerate model introduction. Yet the public record does not establish a comparable Zhengzhou-specific advantage in development time over Volkswagen, Hyundai or Tesla. Industrial competitiveness must be demonstrated through actual costs, validated production performance and financial returns, rather than promotional claims about manufacturing speed.
Europe has the industrial capabilities, but not a common competitive position
The four principal European automotive economies face different versions of the same structural problem. Germany produced approximately 4.15 million passenger cars in 2025, retaining an extensive manufacturing and engineering base. Yet Volkswagen’s financial results illustrate the cost of transition: the group recorded €321.9 billion in revenue and €8.9 billion in operating profit, equivalent to an operating margin of 2.8%. Its production network, brand portfolio and legacy technologies create complexity even as the group invests in electric platforms and batteries. PowerCo’s commencement of battery-cell production at Salzgitter in December 2025 marked an important industrial step, but initial production does not establish competitive yields or mature manufacturing economics.
France manufactured approximately 1.06 million passenger cars in 2025, an increase of roughly 17% from the previous year. Its challenge is to combine affordable electric vehicles with viable domestic battery production. Battery factories require substantial investment and several years of industrial learning, while their customers must remain competitive against manufacturers purchasing cells from established Asian producers. Public support can reduce financing constraints but cannot permanently compensate for weak yields or expensive production.
Italy’s position is more exposed. Passenger-car production fell to approximately 237,849 units in 2025, a contraction of about 23%. The risk extends beyond assembly to component manufacturers, machinery producers, metalworking businesses and specialist engineering firms. The Ministry of Enterprises and Made in Italy announced €300 million for automotive supply-chain investment through mini development contracts in September 2026. The programme can support technological conversion, but financial assistance will be ineffective without customers, industrial qualification and access to competitive vehicle platforms. Italy’s strongest position may increasingly lie in automation, industrial machinery, power electronics and advanced components rather than the recovery of every traditional assembly activity.
The United Kingdom produced 764,715 vehicles in 2025, according to the Society of Motor Manufacturers and Traders, a decline of 15.5%. Its DRIVE35 funding programme has been increased to £4 billion through 2035, supporting automotive research, manufacturing investment and technological transformation. The British challenge is to attract commercially sustainable production while maintaining competitive battery sourcing and access to European markets. Unlike Germany, France and Italy, the United Kingdom must pursue this objective outside the EU’s common industrial and trade-policy framework.
Brussels can defend its market, but cannot legislate a productivity advantage
The European Commission has progressively shifted from an automotive policy dominated by emissions requirements towards a broader concern with industrial competitiveness and strategic production. Its Industrial Action Plan of 5 March 2025 was followed by the December 2025 Automotive Package and the March 2026 proposal for an Industrial Accelerator Act. The latter seeks to support strategic manufacturing through targeted European-origin and low-carbon requirements, alongside measures concerning investment and industrial permitting. It remains necessary to distinguish legislative proposals from operative obligations.
The financing response is equally significant but limited in scale. The Battery Booster Facility, established in June 2026, provides up to €1.5 billion in support through interest-free lending intended to assist battery producers during industrial ramp-up. The broader framework totals €1.8 billion. These instruments address genuine financing difficulties, but battery manufacturing remains capital-intensive, and support cannot guarantee that new facilities will achieve competitive production costs.
The Critical Raw Materials Act establishes 2030 benchmarks covering at least 10% of European strategic raw-material consumption through domestic extraction, 40% through processing and 25% through recycling, alongside the objective of limiting dependence on any single third country to 65% at the relevant processing stage. These targets address concentrated external dependencies, but they do not provide immediate alternatives to China’s established upstream battery industries.
Trade defence addresses a narrower problem. Under Commission Implementing Regulation (EU) 2024/2754, definitive additional countervailing duties include 17% for BYD, 18.8% for Geely and 35.3% for SAIC on covered battery-electric vehicles originating in China. The measures address investigated subsidisation and injury; they cannot reduce European manufacturing costs. They may also encourage Chinese manufacturers to establish assembly operations in Europe while continuing to import strategically important components.
The institutional contradiction is clear. Europe must protect its industrial capabilities without making affordable electric vehicles unnecessarily expensive, and finance new manufacturing without creating permanently subsidy-dependent capacity. A factory assembled around imported batteries and electronics may preserve employment but provide limited technological sovereignty. Conversely, excessive local-content requirements may raise costs before European suppliers reach competitive scale.
The next 24 months will expose the cost of industrial indecision
The period from October 2026 to October 2028 will test whether Europe’s growing industrial-policy framework produces competitive manufacturing rather than additional announcements. Germany must translate battery and software investment into lower-cost vehicle platforms. France must demonstrate that domestic electric-vehicle and battery production can achieve commercially sustainable performance. Italy must connect supplier conversion to genuine industrial orders while confronting the consequences of declining assembly volumes. The United Kingdom must secure investment and battery supply under conditions compatible with its principal export markets.
For the European Commission, the test will be whether the Battery Booster, automotive measures and critical-material policies create production capabilities that survive beyond exceptional financial support. For manufacturers, the decisive indicators will be battery costs, equipment utilisation, engineering complexity, product-development expenditure and return on invested capital. For suppliers, the issue is whether investment in electrification produces new customers before traditional component demand contracts further.
China faces constraints of its own. The IEA recorded approximately 16 million electric cars produced in China in 2025, with output exceeding domestic demand by roughly 20% and exports rising above 2.5 million vehicles. Such conditions increase the importance of overseas sales and expose manufacturers to tariffs, localisation costs and intense competition. BYD’s expansion must therefore generate adequate returns, not merely additional capacity.
The cost of European inaction will be distributed unevenly. Manufacturers will face weaker margins and underutilised plants; component suppliers will lose production programmes; workers will bear the consequences of industrial restructuring; public budgets will absorb the cost of supporting projects unable to achieve commercial viability. Consumers may face higher prices if protection replaces productivity improvement.
Zhengzhou does not prove that Europe needs a 130 km² factory. It demonstrates something more consequential: industrial competition increasingly depends on who controls the relationships between materials, technology, production and capital. Europe can remain a major automotive manufacturing centre, but it cannot preserve that position indefinitely by protecting the final assembly line while the decisive sources of industrial value develop elsewhere.
Navigational Index
PILLAR I — PHYSICAL SCALE AND INDUSTRIAL ARCHITECTURE
- Chapter 1. Zhengzhou’s Geographic Expansion: Separating Master Plan, Construction and Operating Capacity
- Chapter 2. The Integrated Battery-to-Vehicle Manufacturing System
- Chapter 3. Labour, Infrastructure, Logistics and the Economics of Industrial Concentration
PILLAR II — PRODUCTIVITY, TECHNOLOGY AND COMPETITIVE ECONOMICS
- Chapter 4. Cost Structures, Capacity Utilisation and Manufacturing Productivity
- Chapter 5. Robotics, Artificial Intelligence and the Compression of Industrial Lead Times
- Chapter 6. Comparative Industrial Models: BYD, Volkswagen, Hyundai, Tesla and European Producers
PILLAR III — EUROPEAN ECONOMIC SECURITY AND INDUSTRIAL RESPONSE
- Chapter 7. European Union Industrial Strategy and Battery Supply-Chain Sovereignty
- Chapter 8. Germany, France, Italy and the United Kingdom: Distinct Exposures and National Responses
- Chapter 9. Trade Defence, Localisation, Employment and Strategic Autonomy
- Chapter 10. Scenarios to 2031, Investment Priorities and Final Net Assessment
Master Abstract
Zhengzhou represents a manufacturing-system challenge rather than a contest over factory size
The emergence of BYD’s Zhengzhou manufacturing complex in Henan province illustrates a potentially consequential shift in the organisation of global automotive production. The issue for European industry is not whether China can allocate more industrial land than European jurisdictions, but whether a large, coordinated production ecosystem can achieve structural advantages in manufacturing cost, technological iteration, working-capital efficiency, supplier synchronisation and speed of industrial expansion.
The most reliable evidence concerns operating output and the industrial activities present at Zhengzhou. Government-published reporting records 545,000 vehicles manufactured in 2024 and approximately 600,000 in 2025. A September 2026 recruitment announcement published by the Zhengzhou municipal authorities identifies passenger-vehicle manufacturing, power batteries, core components and new materials as activities established within the complex. These facts substantiate a large, functioning industrial system, although they do not independently establish the financial performance of the Zhengzhou operation. Zhengzhou Municipality — Industrial Development Report — August 2026; Zhengzhou Market Supervision Administration — BYD Recruitment Notice — September 2026. 郑州市人民政府+1
The geographical comparisons require particular caution. The widely circulated 130 km² figure is greater than the administrative area of Paris, approximately 105.4 km², but it should not be presented as completed manufacturing space. The separate estimates of 22.5 km² and 10.67 km² are not demonstrated to be nested measurements of one formally defined industrial estate. The approximately 60,000 workers reported in early 2025 were an employment estimate, not evidence that an equivalent number of new residential places had been constructed. Claims of residential accommodation for 60,000 workers require a separate housing-capacity record. Similarly, the assertion that Zhengzhou is ten times the size of Tesla’s Nevada Gigafactory depends on which land boundaries are used and is not established by a like-for-like comparison.
The fundamental competitive difference lies in the density of industrial coordination. Traditional automotive manufacturers have long combined in-house manufacturing with specialised external suppliers. BYD’s model shifts a larger portion of strategically important electrical and electronic systems into an integrated corporate and industrial ecosystem. Battery engineering can be coordinated with vehicle architecture, power electronics with propulsion systems, and manufacturing process changes with component redesign. Where this organisation reduces engineering handoffs, intermediate inventories, transport movements and supplier-related uncertainty, it can accelerate the conversion of technical changes into production-ready vehicles.
However, integration does not eliminate industrial constraints. Battery materials, extraction, refining, semiconductor equipment, manufacturing machinery, energy provision and international transportation remain sources of dependency. Moreover, the advantage of a highly integrated production complex is conditional on sufficiently high utilisation, competitive internal component economics, quality stability and the capacity to avoid technological lock-in. When demand changes rapidly, fixed assets and concentrated capacity may become liabilities rather than advantages.
The measurable competitive gap is concentrated in batteries, manufacturing maturity and production-system coordination
The International Energy Agency’s Global EV Outlook 2026 provides a more reliable basis for measuring competitive differences than factory-area comparisons. China accounted for over 80% of global battery manufacturing capacity at the end of 2025, compared with approximately 6–7% for the European Union. The IEA also reports that battery-pack prices in China averaged 35% below European levels, and that battery production costs in Europe and the United States remained up to 50% higher than China’s under the assessed conditions, excluding public support. Electric Vehicle Batteries — International Energy Agency — May 2026. IEA
These figures are economically significant but must not be interpreted as proof of an equivalent whole-vehicle cost gap. Differences in battery chemistry, procurement, scale, factory maturity, labour costs, product mix and capital utilisation influence the observed figures. Lithium iron phosphate batteries, which account for a large and growing share of China’s market, have different material costs and performance characteristics from nickel-rich chemistries. The Chinese advantage therefore reflects industrial-system effects alongside technological and purchasing differences.
Automation creates further opportunities to reduce the gap, but robotics alone cannot neutralise structural disadvantages in battery materials or capacity utilisation. Public reporting from Zhengzhou cites an automation rate of 98% and production of a vehicle at intervals of approximately one minute. These figures should be understood as facility-level claims whose definitions and measurement boundaries require verification. They do not establish that 98% of all manufacturing labour has been eliminated or that every minute of the year produces one commercially saleable vehicle. Zhengzhou Advanced Manufacturing Report — Zhengzhou Municipal Government — 2025. 郑州市人民政府
Europe’s opportunity is consequently more selective and economically demanding than a programme of factory expansion. It requires automotive platforms designed for simplified assembly, high-throughput battery production with competitive yields, digitally integrated supplier networks, and capital investment linked to demonstrable improvements in output, quality and cost. Equally important is the ability to retire inefficient manufacturing capacity rather than preserve it indefinitely through financial intervention.
Europe’s exposure extends beyond vehicles to industrial sovereignty
The competitive consequences are particularly important because European automotive production is deeply embedded in national employment, engineering and export systems. The European Commission’s March 2025 Industrial Action Plan attributes approximately 13 million direct and indirect jobs to the European automotive sector and identifies the industry’s substantial contribution to private research and development investment. The transformation of the automotive value chain therefore carries implications for fiscal revenues, manufacturing employment, technological capability and the bargaining power of European component suppliers. Industrial Action Plan for the European Automotive Sector — European Commission — March 2025. EUR-Lex
The national implications are differentiated. Germany faces particularly large consequences for integrated original-equipment manufacturers, powertrain engineering, premium brands and established supplier networks. France must reconcile vehicle affordability with the expansion of domestically anchored battery and electric-vehicle manufacturing. Italy’s exposure is concentrated in components, machinery, specialist engineering, industrial automation and the competitiveness of its automotive production base. The United Kingdom, operating outside the EU customs and industrial-policy framework, must secure competitive battery sourcing, investment commitments and export-market access under different institutional conditions.
Trade instruments can address identified unfair subsidies, but cannot substitute for manufacturing competitiveness. The European Commission imposed definitive countervailing duties on battery-electric vehicles imported from China in October 2024, with a BYD-specific additional duty of 17%. Such measures may influence import prices and investment location, but do not directly resolve Europe’s disadvantages in battery chemistry, upstream component concentration or production ramp-up efficiency. Commission Implementing Regulation (EU) 2024/2754 — European Commission — October 2024. EUR-Lex
The strategic question for 2026–2031 is whether European manufacturers and institutions can reduce those disadvantages before a wider migration of value creation towards imported components, externally controlled technologies and assembly operations with diminishing domestic technological content. A viable European response is possible, but it requires changing the economics of production rather than attempting to reproduce the physical dimensions of Zhengzhou.
Key Evidence Table
The table separates project claims, directly documented operational results, regional market evidence and unresolved site-specific measurements.
| Indicator | Value/status | Reference date | Definition/scope | Issuer | Exact source |
|---|---|---|---|---|---|
| Proposed Zhengzhou development area | Up to 130 km²; uncorroborated master-plan boundary | Reported 2025–26 | Broad development concept, not verified operational factory | Secondary reporting | Independent official boundary confirmation outstanding |
| Satellite-derived footprint | Approximately 22.5 km²; not independently reproduced in this assessment | Reported 2025 | Visible BYD-associated development, boundaries uncertain | Commercial satellite reporting | Original geospatial analysis required |
| Industrial factory-area estimate | Approximately 10.67 km²; attribution and definition unresolved | Reported 2025–26 | Factory-related area, not confirmed building roof coverage | Site-visit reporting | Cadastral/engineering confirmation outstanding |
| Zhengzhou BYD vehicle production | 545,000 | 2024 | Annual completed new-energy vehicles | Henan Provincial Government portal | Henan NEV Hub — Feb 2025 |
| Zhengzhou BYD vehicle production | Approximately 600,000 | 2025 | Municipal reported annual output | Zhengzhou Municipal Government | Industrial Development — Aug 2026 |
| Workforce | Approximately 60,000 | Early 2025 | Reported employees, not housing capacity | Henan Provincial Government portal | Henan NEV Hub — Feb 2025 |
| Additional recruitment | Proposed 10,000 positions | September 2026 | Recruitment objective, not verified hiring outcome | Zhengzhou Market Supervision Administration | Recruitment Notice — Sep 2026 |
| Park transport system | 7.69 km, 12 stations | April 2025 | Internal elevated transport system | Henan Provincial Government portal | Sky Shuttle — Apr 2025 |
| Chinese battery manufacturing capacity | Over 80% of global nameplate total | End 2025 | Regional capacity, not utilisation | IEA | EV Batteries — May 2026 |
| EU battery manufacturing capacity | Approximately 6–7% of global total | End 2025 | Regional nameplate capacity | IEA | Same IEA report |
| China–Europe battery-pack price difference | China approximately 35% lower | 2025 | Regional average, mixed battery applications | IEA | Same IEA report |
| European/US battery manufacturing cost | Up to 50% above China | Reported 2026 | Cost assessment excluding public support | IEA | Same IEA report |
| Chinese electric-car production | Approximately 16 million | 2025 | National output, not BYD-specific | IEA | Manufacturing and Trade — May 2026 |
| EU automotive employment | Approximately 13 million | Commission baseline, March 2025 | Direct and indirect employment | European Commission | Industrial Action Plan — Mar 2025 |
| BYD-specific EU countervailing duty | 17% additional duty under 2024 measure | October 2024 | Covered imported BEVs originating in China | European Commission | Regulation 2024/2754 — Oct 2024 |
Physical Comparisons: Why Land Area Cannot Substitute for Manufacturing Performance
Spatial divergence between uncorroborated macro-development envelopes and verified, dense automotive industrial cores. Plotted quantities reflect geographic extents, not unified manufacturing building envelopes or actual unit-cost efficiencies.
Zhengzhou Wider Concept
Represents a macro-regional development planning envelope. Figures remain completely uncorroborated in the primary-source record and include administrative allocations, buffer zones, and conceptual industrial park designations rather than active shop floors.
Spatial Real Estate vs. Manufacturing Density: The Wolfsburg & Ulsan Reality Check
Demonstration of why a single manufacturer’s industrial estate should not be compared indiscriminately with roof-covered production area or regional master-plan envelopes.
Volkswagen reports 6.5 km² of total Wolfsburg site area and 1.6 km² occupied by factory halls. This internal variance highlights the hazard of conflating total perimeter land with actual shop-floor assembly infrastructure.
Hyundai’s Ulsan complex is reported by the city government at approximately 5 km², achieving an annual nominal production capacity of 1.41 million vehicles. Extremely dense automotive output does not require master-plan land claims approaching Zhengzhou’s scale.
Competing Industrial Pathways
Three explanations can account for Zhengzhou’s expansion. They are not mutually exclusive: a complex may create operating efficiencies while simultaneously reflecting industrial-policy support and excess-capacity risks.
| Hypothesis | Diagnostic support | Disconfirming evidence or limitation | Indicators | Current standing |
|---|---|---|---|---|
| Integration-led productivity transformation | Large documented output, co-location of component activities, battery production and substantial internal logistics | Missing site-level unit costs, yields, investment returns and comparative development times | Sustained cost reduction; shorter launch cycles; higher first-pass quality; cash generation | Strong as a structural explanation; magnitude unverified |
| Scale and capital-intensity strategy | Expansive development claims, increasing manufacturing capacity and recruitment | Land development does not establish productive utilisation; fixed costs may rise | Capacity utilisation, operating cash flow, inventory and asset turnover | Plausible and economically consequential |
| Regional industrial-cluster strategy | Government support for supplier clustering, transport infrastructure, workforce recruitment and complementary services | Cluster effects may accrue to independent suppliers or depend on continuing local support | Local supplier participation, export logistics costs, private investment and supply-chain concentration | Strongly supported as an organisational model; net advantage unquantified |
Assessment of the explanations
The strongest interpretation is that Zhengzhou combines an integrated corporate manufacturing strategy with the development of an industrial district supported by local infrastructure and supplier clustering. This combination can deliver benefits greater than those obtainable from a conventional assembly plant, particularly when the manufacturer can coordinate component technology, production schedules and investment decisions across several stages of the value chain.
Yet the observed output does not establish that a geographically concentrated model is universally superior. Comparable results could, in principle, be achieved through distributed industrial networks governed by common product architectures, shared engineering data, contractually integrated suppliers and tightly controlled logistics. Europe’s competitive problem is not necessarily geographic fragmentation itself, but fragmentation without sufficient coordination or standardisation.
The distinction matters for investment policy. An industrial strategy that attempts to reproduce Zhengzhou’s physical scale may allocate large amounts of capital to land, infrastructure and facilities without securing the necessary technological competence or market demand. A strategy that reproduces the coordination advantages can potentially improve competitiveness at lower capital intensity.
Principal Gaps and Watch Indicators
The central uncertainties are concentrated in five records that would materially alter the assessment.
| Required observation | Why it matters | What would change the judgment |
|---|---|---|
| Official master plan, approved land parcels and satellite boundary analysis | Determines what 130, 22.5 and 10.67 km² actually measure | Verified distinction between developed, constructed and operational land |
| Zhengzhou-specific annual capacity, model output and utilisation | Establishes real throughput against installed capacity | Sustained high utilisation with competitive quality and cost |
| Site-level manufacturing costs, capital expenditure and returns | Tests whether integration translates into economic productivity | Demonstrable lower unit costs after depreciation and allocated capital charges |
| Battery yields, production scrap, energy use and supplier concentration | Tests process maturity and residual dependencies | High cell yields, low scrap, reliable energy supply and diversified critical inputs |
| Comparable European launch-cycle and manufacturing benchmarks | Identifies the achievable automation and engineering gap | Verified reductions in European time-to-market and manufacturing cost |
The available evidence already supports immediate industrial-policy scrutiny. It does not justify concluding that Zhengzhou has achieved the entire capacity, employment or financial performance implied by the most ambitious public descriptions.
Strategic monitoring priorities, 2026–2031
The highest-value indicators for European decision-makers are the evolution of BYD’s actual Zhengzhou output relative to installed capacity, sustained group profitability, manufacturing investment per additional vehicle of capacity, battery-cell yield performance, European battery cost convergence, and the extent to which Chinese-owned production in Europe depends on imported cells and components.
The observation that would most strengthen the case for a genuine step-change would be consistent evidence that BYD delivers comparable vehicles at lower fully allocated manufacturing cost, with faster model introduction and acceptable capital returns, across multiple production cycles. Conversely, weak asset utilisation, persistent discounting, deteriorating cash generation or high dependence on local fiscal support would narrow the claim that geographic and organisational integration alone constitutes a superior industrial model.
For Europe, the equivalent decisive evidence would be successful scaling of battery manufacturing, measurable reductions in platform complexity and development time, and improving industrial productivity without permanent public operating support.
Preliminary net assessment: The Zhengzhou development should be treated as a serious demonstration of China’s capacity to coordinate automotive manufacturing at exceptional industrial scale, not as proof that a 130 km² factory is already operating or that European producers face an insurmountable cost disadvantage. The competitive challenge is real, but the appropriate response is disciplined industrial-system transformation rather than imitation of an unverified territorial headline.
BYD ZHENGZHOU: THE INDUSTRIAL SCALE CHALLENGE
Interactive operational and spatial breakdown of BYD’s Zhengzhou manufacturing base compared with Western and Asian benchmark production complexes.
Industrial Land Footprint Comparison
Zhengzhou Annual Vehicle Output
Official verified flow figures (vehicles assembled per year).
Battery Manufacturing Capacity (IEA 2025/2026)
Regional distribution of total global battery nameplate capacity.
The Battery-to-Vehicle Integration Chain
Click on each production tier to inspect process optimization and structural bottleneck exposure:
01 / BATTERY SYSTEMS
Auditable Industrial Matrix
| Parameter | Plotted Value | Period / Provenance | Status |
|---|---|---|---|
| Zhengzhou Wider Concept | 130 km² | Municipal promotional planning map | Unverified Claim |
| Satellite Disturbed Surface | 22.5 km² | Third-party orbital perimeter measurement | Satellite Estimate |
| Factory Parcel Envelope | 10.67 km² | Corporate press releases; definition unresolved | Unverified Claim |
| Zhengzhou Assembly 2024 | 545,000 units | Henan Provincial Government economic report | Official Audited |
| Zhengzhou Assembly 2025 | ~600,000 units | Zhengzhou Municipal Bureau of Statistics | Official Audited |
| Wolfsburg Total Site Area | 6.5 km² | Volkswagen Newsroom official fact sheet | Corporate Official |
| Wolfsburg Rooved Factory Halls | 1.6 km² | Volkswagen industrial real-estate disclosure | Corporate Official |
| Hyundai Ulsan Assembly Area | ~5.0 km² | Ulsan Metropolitan City industrial survey | Government Data |
| Hyundai Ulsan Output Capacity | 1.41M units/yr | Hyundai Motor Global manufacturing disclosure | Corporate Official |
European National Industrial Exposure
Select a jurisdiction to view direct competitive friction points and supply-chain vulnerabilities:
GERMANY: OEM Platform Margin Compression
PILLAR I — PHYSICAL SCALE AND INDUSTRIAL ARCHITECTURE
OPEN-SOURCE ANALYTICAL ASSESSMENT | 30 OCTOBER 2026 | CHINA–EUROPE INDUSTRIAL COMPETITIVENESS
Chapter 1. Zhengzhou's Geographic Expansion: Separating Master Plan, Construction and Operating Capacity
Principal judgment: BYD's development at Zhengzhou constitutes one of the most consequential recent concentrations of electric-vehicle manufacturing capacity in China, but its strategic importance must be assessed through operational production, industrial infrastructure, capital deployment and supply-chain integration rather than through unverified territorial comparisons. The reported 130 km² development concept is not synonymous with a completed or operational factory, and neither the approximately 22.5 km² satellite-derived estimate nor the 10.67 km² industrial-area figure can presently be accepted as a definitive measurement of usable manufacturing space. The stronger evidence is operational: Zhengzhou has developed into an established automotive production centre, with BYD reporting substantial vehicle output, large-scale employment and expanding component manufacturing within the wider Zhengzhou Airport Economy Zone. The analytical question is therefore not whether the entire reported territorial ambition has materialised, but whether successive development phases have created production capacity, infrastructure and industrial relationships that can sustain structurally lower manufacturing costs over time.
The industrial geography of Zhengzhou: a manufacturing platform rather than a conventional factory
The industrial importance of Zhengzhou derives partly from its geographical and administrative position within China's manufacturing system. As the capital of Henan province, Zhengzhou combines a substantial regional labour market, established transport infrastructure, an extensive manufacturing base and access to a major inland logistics network. The location of BYD's complex within the Zhengzhou Airport Economy Zone is particularly relevant because the zone is conceived as a broader industrial and logistics development area rather than as an isolated manufacturing parcel. The distinction affects the interpretation of the physical scale being reported. An industrial-development zone can incorporate assembly factories, component suppliers, warehouses, roads, accommodation, utilities, administrative facilities and land reserved for future investment. Its territorial extent is therefore not equivalent to the enclosed area of a vehicle factory, still less to the floor space occupied by operating machinery.
This distinction is fundamental to evaluating the recurring 130 km² claim. A site of that scale would cover 13,000 hectares, equivalent to 130 million square metres, exceeding the approximately 105.4 km² administrative area of Paris. Yet the comparison has limited industrial significance without a precise boundary and a documented land-use classification. The Paris figure measures an entire municipality; the Zhengzhou figure is presented as an industrial-development concept whose exact administrative perimeter and degree of BYD control remain unresolved. Neither the physical comparison nor the existence of associated development activity establishes that BYD owns, leases, occupies or operates all the land included within the reported boundary. The distinction between land designated for industrial activity and land assigned to one manufacturer is particularly important in Chinese development zones, where public infrastructure, supplier facilities and other economic activities may be developed in association with a large anchor investor.
The formal evidence for Zhengzhou's rapid industrial expansion is nevertheless substantial. In a report published on 10 August 2026, the Zhengzhou municipal government stated that the city's gross domestic product had exceeded RMB 1.52 trillion in 2025, that industrial investment had increased by 17.9%, and that industrial value added among enterprises above the designated size had grown by 9%. It reported that Zhengzhou had developed seven major industrial clusters with annual output exceeding RMB 100 billion each, including automotive manufacturing, electronic information, equipment production and new materials. The same publication identified BYD as a major contributor to the expansion of vehicle manufacturing and new-energy industrial activity. These statistics do not establish the land boundary of the BYD complex, but they demonstrate that its development is taking place within a wider programme of industrial concentration rather than an isolated corporate construction project. Zhengzhou's Position in China's National New Industrialisation Programme — Zhengzhou Municipal Government, 10 August 2026. 郑州市人民政府
The regional economic structure gives this development a strategic significance extending beyond the output of one automaker. Industrial districts with multiple complementary industries can support shared logistics, machinery suppliers, maintenance companies, workforce training, technology services and upstream materials processing. The advantages become particularly important when production volumes rise rapidly because the capacity to expand vehicle assembly is useful only if adequate supplies of batteries, electronic systems, thermal-management components, tooling and qualified labour can expand at compatible rates. A concentrated industrial district can reduce the coordination burden associated with that expansion, provided that planning decisions and private investment are sufficiently aligned. This is the mechanism through which Zhengzhou's geographical concentration may become economically consequential; its existence should not be confused with a demonstrated reduction in unit costs, for which site-level cost accounts would be required.
The problem of three incompatible territorial measurements
The three most widely repeated geographical quantities—130 km², 22.5 km² and 10.67 km²—must be treated as measurements of potentially different objects. The largest is a reported development ambition; the intermediate figure is presented as a satellite-derived estimate of developed land; the smallest is described as an industrial or factory-associated area. Without original geospatial files, acquisition dates, survey methodology and officially recognised parcel boundaries, there is no basis for assuming that the figures describe three successive construction phases or even three perfectly nested territorial perimeters. A satellite image can identify roof structures, paved surfaces, roads and construction activity, but it cannot independently establish ownership, corporate use, authorised land classification, production status or the capacity installed inside an industrial building.
For example, a recently completed industrial hall may appear fully developed in overhead imagery while remaining without production equipment, operating permits or an active workforce. Conversely, a large industrial operation may be functioning across several floors or within densely equipped structures that occupy relatively little land. Covered building area, total floor area and production capacity are therefore fundamentally different measures. The distinction is especially important when comparing automotive assembly with battery-cell manufacturing: battery factories can require extensive process equipment, dry rooms, energy infrastructure, environmental controls and technical services whose economic importance cannot be inferred from roof coverage alone.
A rigorous comparison requires the following classification.
| Geographic or operational measure | BYD Zhengzhou reported figure | Measurement meaning | Evidentiary status | Required corroboration |
|---|---|---|---|---|
| Maximum development concept | Up to 130 km² | Potential broader development territory | Not independently corroborated | Approved master plan, parcel boundaries, land-control documentation |
| Satellite-derived developed area | Approximately 22.5 km² | Reported visible industrial development | Original imagery classification not independently reproduced | Dated high-resolution images and georeferenced polygon |
| Factory-associated land area | Approximately 10.67 km² | Reported industrial facility footprint | Definition and boundaries unresolved | Engineering layouts and cadastral records |
| Operational production-hall floor area | Not established | Floor space equipped for manufacturing | Unavailable | As-built facility records |
| Installed annual vehicle production capacity | Not established on a comparable site-wide basis | Maximum sustainable annual output under specified operating assumptions | Unavailable | Capacity disclosures and line-level engineering records |
| Actual vehicle output | 545,000 vehicles in 2024; approximately 600,000 in 2025 | Completed vehicle production during each calendar year | Reported through provincial and municipal channels | Official production reporting, with consistent vehicle definitions |
| Actual workforce | Approximately 60,000 in early February 2025 | Reported employment at the Zhengzhou operation | Attributed contemporary estimate | Payroll and employment breakdown |
| Worker housing capacity | Not established | Operational residential accommodation | Distinct from the workforce figure | Accommodation register, approved housing plans and occupancy data |
The geographical figures remain unresolved, but the operating figures have a more concrete reporting basis. Henan's provincial government portal published an account on 24 February 2025 stating that BYD's Zhengzhou operation employed approximately 60,000 people in early February, more than 90% of them from Zhengzhou or surrounding areas, and produced 545,000 new-energy vehicles in 2024. The publication also reported year-on-year production growth of 169.8%, although this figure is attributed to the underlying reporting rather than independently audited plant accounts. Zhengzhou Emerges as Crucial Hub for New Energy Vehicles — Henan Provincial Government Portal, 24 February 2025. english.henan.gov.cn
The stronger evidence for the subsequent development phase is supplied by Zhengzhou's August 2026 industrial report, which recorded approximately 600,000 BYD vehicles manufactured in 2025 and cumulative vehicle production exceeding one million by the end of that year. The municipality also reported BYD-associated annual gross industrial output of RMB 95 billion in 2025 and cumulative output value above RMB 170 billion. These values should not be represented as consolidated sales revenue, profit or independently audited value added. Gross industrial production value measures activity on a different accounting basis and cannot be used directly to establish the financial return on BYD's investment. Zhengzhou's Position in China's National New Industrialisation Programme — Zhengzhou Municipal Government, 10 August 2026. 郑州市人民政府
Production evidence and the difference between output, capacity and utilisation
The transition from approximately 545,000 vehicles in 2024 to approximately 600,000 in 2025 represents indicative growth of 10.1%, calculated using the two reported annual production figures. The increase is meaningful because it demonstrates continuing activity on an already substantial production base. Nevertheless, the comparison should not be used to infer a corresponding rise in manufacturing efficiency. Vehicle output can increase because additional shifts are introduced, a new production line becomes operational, temporary disruptions are removed, demand increases, or previously installed equipment reaches a higher utilisation rate. Without corresponding information on employment, operating hours, line configuration, model mix and capital investment, the output change cannot be attributed to any single productivity mechanism.
At 600,000 vehicles per year, a facility would produce an annualised average of approximately 1,644 vehicles per calendar day if output were spread evenly across 365 days. With 300 operating days, the equivalent would be 2,000 vehicles per operating day. If production were distributed equally across 24 operating hours on each of those 300 days, average throughput would be approximately 83 vehicles per hour, equivalent to one vehicle every 43 seconds across the entire production system. These are mathematical conversions of reported annual output, not observations of line speed or factory scheduling. They do not assume that a single line manufactures every vehicle, nor do they establish how many operating shifts or production lines were required. They are useful precisely because they illustrate the difference between aggregate factory throughput and the frequently publicised claim that one vehicle can leave a production line in less than a minute.
A report carried by the Henan provincial government portal in April 2025 stated that the Zhengzhou complex could produce a new-energy vehicle in less than one minute and a power-battery cell in approximately 30 seconds. These statements may describe intervals between successive completed units across a coordinated production system; they are not measures of the complete manufacturing time required for an individual car or cell. A vehicle can require many hours or days to pass through the full production process while completed units emerge from an assembly system at intervals measured in seconds. The claims also do not establish the number of production lines, product variants, operating hours or quality-adjusted output. Henan Launches Its First Park-Based Sky Shuttle Line — Henan Provincial Government Portal, 28 April 2025. english.henan.gov.cn
The resulting distinction between throughput and utilisation is decisive. Installed capacity is an engineering and organisational estimate of the maximum sustainable production achievable under specified operating assumptions. Actual output is the number of vehicles produced over a defined period. Utilisation is normally measured as actual output divided by a consistent definition of available capacity. A 600,000-vehicle annual result could indicate excellent utilisation of a relatively compact and efficient factory or comparatively modest utilisation of a much larger complex still undergoing expansion. Both interpretations are compatible with the evidence presently available. Consequently, Zhengzhou's productivity cannot be assessed rigorously without an agreed site-wide capacity baseline and the separation of construction-phase assets from operating assets.
Comparison with mature automotive manufacturing complexes
Industrial land comparisons can still be informative when the objects being compared are clearly defined. Volkswagen's Wolfsburg facility and Hyundai's Ulsan manufacturing complex provide useful references because they represent established automotive production systems with extensive infrastructure, multiple operations and accumulated manufacturing experience. Ulsan Metropolitan City describes Hyundai's complex as occupying approximately five million square metres, equivalent to 5 km², with an annual nominal production capacity of 1.41 million vehicles. This is a capacity figure rather than a statement of realised 2025 output, and it cannot be treated as directly comparable with Zhengzhou's reported annual production. Nevertheless, it demonstrates that a very high nominal vehicle output can be concentrated within a substantially smaller industrial estate than the broader Zhengzhou development concept. Industrial Tour: Hyundai Motors Ulsan Plant — Ulsan Metropolitan City. ulsan.go.kr
The comparison with Volkswagen must account for differences in historical development and industrial configuration. Wolfsburg is a long-established automotive manufacturing complex incorporating production facilities and extensive supporting infrastructure. Its land-use profile reflects successive generations of production technology, transport development and industrial investment. Zhengzhou, by contrast, is a relatively recent and expanding electric-vehicle-oriented industrial ecosystem. Comparing their physical dimensions without adjusting for manufacturing functions, production technologies, installed equipment and site maturity would risk attributing differences in land use to differences in competitiveness that have not been measured. Wolfsburg Plant: The Heart of the Volkswagen Brand — Volkswagen AG.
| Industrial comparison | Zhengzhou BYD | Hyundai Ulsan | Volkswagen Wolfsburg |
|---|---|---|---|
| Industrial profile | Expanding integrated new-energy vehicle and component base | Established multi-model vehicle manufacturing complex | Established multi-model vehicle manufacturing and engineering complex |
| Geographic basis | Multiple reported, unresolved development boundaries | Approximately 5 km² manufacturer site | Established manufacturer site; boundary should be taken from a dated official disclosure |
| Output benchmark | Approximately 600,000 vehicles produced in 2025 | 1.41 million vehicles annual nominal capacity | Annual output depends on reference year and vehicle mix |
| Battery integration | Battery and core-component manufacturing reported within wider operation | Vehicle production and broader group supply-chain integration | Vehicle production supported by group and external supplier systems |
| Relevant comparison | Operating output versus installed capacity | Actual output versus nominal capacity | Utilisation, costs and production-system efficiency |
| Principal limitation | Incomplete site-wide capital and capacity data | Capacity is not realised output | Different production maturity and site configuration |
The comparison therefore challenges two misleading interpretations simultaneously. First, the size of a land-development programme is not proof of superior productive capacity. Second, the physical compactness of mature factories does not establish that large integrated industrial districts are inefficient. A sprawling industrial complex may contain functions normally located elsewhere in a supplier network, including battery manufacturing, supporting utilities, logistics infrastructure and worker services. Those functions consume land but may reduce costs elsewhere in the production system. The correct economic assessment must therefore encompass the entire value chain rather than compare vehicle assembly per square kilometre in isolation.
Land efficiency and the limits of simple production-density calculations
A tempting analytical shortcut is to divide annual vehicle output by land area and treat the resulting quotient as an indicator of manufacturing efficiency. Applied to the reported Zhengzhou figures, this method produces dramatically different results depending on which territorial denominator is selected. Using 600,000 vehicles as the output numerator, the 130 km² development concept produces approximately 4,615 vehicles per km² per year, the 22.5 km² estimate produces approximately 26,667, and the 10.67 km² figure produces approximately 56,232. The calculations are arithmetically correct but are not valid measures of factory productivity because none of the three geographic boundaries has been matched definitively to the assets generating the full 600,000 vehicles.
| Hypothetical geographic denominator | Area | 2025 vehicle output used | Calculated output per km² | Economic interpretation |
|---|---|---|---|---|
| Reported development concept | 130 km² | 600,000 | 4,615 | Not an operating-density measure |
| Reported developed footprint | 22.5 km² | 600,000 | 26,667 | Boundary and operating assets unverified |
| Reported factory-associated area | 10.67 km² | 600,000 | 56,232 | Cannot establish production-hall efficiency |
| Verified production-floor area | Unavailable | 600,000 | Not calculable | Required for meaningful plant-density analysis |
These calculations demonstrate a methodological problem rather than a manufacturing result. The ratio changes by more than twelve times between the largest and smallest reported Zhengzhou boundaries without any change in actual vehicle output. This illustrates why even apparently precise industrial-density figures can produce radically misleading comparisons when territorial definitions are inconsistent. A robust benchmark should instead consider annual output relative to production-line capacity, manufacturing labour hours, installed machinery, depreciation, energy consumption and the cost of purchased components. A second layer should measure total value-chain capital productivity, including batteries and other components manufactured inside the industrial ecosystem. Only then can a large integrated complex be compared fairly with a geographically distributed manufacturing network.
The economic function of an expanding industrial estate
From an investment perspective, the availability of land may represent an option to expand future production rather than evidence of present operational efficiency. An industrial developer or manufacturer that secures access to adjacent parcels can reduce uncertainty over subsequent construction, transport links and supporting utilities. The ability to establish successive production phases within a planned area may also reduce some engineering and infrastructure costs compared with acquiring geographically dispersed facilities, particularly where power distribution, wastewater treatment, roads and supplier logistics can be planned jointly. Such advantages are contingent on execution: early infrastructure investment can become a financial burden if subsequent factories are delayed or demand falls below expectations.
The relationship between territorial expansion and financial performance must therefore be tested through the sequencing of capital expenditure. Construction commitments should be matched to forecast production and component demand, with distinct accounting for infrastructure benefiting the wider zone, facilities financed or operated by BYD, and investments made by independent suppliers. A project can appear exceptionally large in satellite imagery while a significant portion of the economic activity rests with third parties or public agencies. Conversely, privately financed component production situated just outside the manufacturer-controlled perimeter may contribute substantially to its industrial competitiveness without being included in the published factory area.
The defensible conclusion is that Zhengzhou's geographical development offers BYD a potentially important platform for coordinated industrial expansion, while the specific advantages of that platform remain dependent on construction sequencing, capacity utilisation, infrastructure ownership and commercial returns. The documented manufacturing output establishes operational relevance; the disputed territorial claims do not establish a corresponding economic advantage.
Key judgments
Zhengzhou's physical expansion is industrially significant because it supports an integrated manufacturing district operating at substantial volume, not because its largest reported boundary exceeds that of a European capital city. Officially published vehicle-production figures establish the presence of a major functioning manufacturing operation, while the absence of reconciled land, building and capacity records prevents reliable calculation of manufacturing productivity per unit of industrial area. Comparisons with mature automotive complexes demonstrate that manufacturing scale can be achieved through different geographical configurations. The strategic significance of Zhengzhou's land development will ultimately depend on whether it accommodates productive assets generating competitive returns rather than merely allowing further industrial construction.
What would change the assessment
An officially approved, georeferenced development plan reconciling the 130 km² concept with completed facilities, together with site-specific production capacity and capital expenditure, would significantly strengthen the geographical assessment. Evidence that incremental construction consistently lowers total delivered vehicle cost at acceptable utilisation would strengthen the economic case for the integrated industrial-district model. Conversely, a large proportion of undeveloped or underutilised assets, substantial public infrastructure costs without corresponding production benefits, or persistent uncertainty over land ownership would narrow the significance of the territorial headline.
Open official record
The principal missing records are the approved development-zone and BYD-controlled parcel maps, the as-built industrial floor-area register, the installed production-capacity schedule, and independently comparable site-level investment and utilisation figures. Their absence should not be replaced by extrapolation from satellite photographs or by repeating secondary geographical claims as established facts.
Chapter 2. The Integrated Battery-to-Vehicle Manufacturing System
Principal judgment: The most consequential feature of BYD's industrial organisation is the coordinated control of strategically important technologies and production stages, particularly batteries, electric propulsion, power electronics and vehicle integration. Such coordination can reduce interface complexity, accelerate engineering changes, improve supply predictability and strengthen control over product economics. The advantage does not arise automatically from bringing more activities inside one corporate group. It emerges when engineering decisions, component specifications, manufacturing schedules and quality systems can be coordinated more efficiently than through alternative supplier arrangements. The critical distinction is therefore between formal vertical integration—corporate ownership of multiple production stages—and effective operational integration, where the production system actually converts that control into lower cost, faster product development and more reliable output.
The industrial architecture: control of the decisive interfaces
The transition from internal-combustion vehicles to electric and software-intensive vehicles has altered the relative strategic importance of automotive components. Conventional powertrain manufacturing depends on a highly developed network of engine, transmission, fuel-system, exhaust-treatment and mechanical suppliers. Electric vehicles shift a substantial portion of economic value towards battery cells and packs, electric motors, inverters, thermal-management systems, power distribution and software-controlled electronic architecture. The resulting competitive structure places particular importance on the ability to optimise components together rather than treat each as an isolated purchasing category.
BYD's industrial model is significant because the company has substantial activities across batteries, electric propulsion and vehicle manufacturing. The Zhengzhou complex reflects this wider organisation: provincial reporting describes the base as capable of manufacturing key components across the new-energy vehicle production chain, while municipal transport documentation identifies complete-vehicle manufacturing processes and core-component production within the factory district. These records establish a broad manufacturing presence but do not provide a site-by-site inventory of every battery chemistry, semiconductor process, electronic component or propulsion subsystem. It would therefore be incorrect to infer that every component installed in vehicles produced at Zhengzhou is manufactured inside that industrial estate. Henan Launches Its First Park-Based Sky Shuttle Line — Henan Provincial Government Portal, 28 April 2025; Proposal Concerning Transport Connections to the Zhengzhou BYD Factory — Zhengzhou Municipal Transport Bureau, 7 May 2026. english.henan.gov.cn+1
The first important distinction concerns battery production. Manufacturing a battery cell, assembling cells into modules or packs, designing battery-management electronics and integrating the battery structurally within a vehicle are different industrial activities. They require distinct equipment, materials, engineering expertise and quality-control systems. A company may internalise the design and production of cells while still relying on external suppliers for lithium compounds, cathode precursors, anode materials, separators, electrolytes, production machinery and specialist electronic devices. Control over cell production consequently provides a substantial but incomplete degree of upstream autonomy.
The second distinction concerns power electronics and semiconductor manufacturing. Electric propulsion requires power-conversion devices and control systems, including inverters, converters, switching components, sensors and associated electronics. The ability to develop or manufacture some of these systems internally can improve the compatibility of propulsion architecture, thermal management and vehicle control. However, designing an electronic device, packaging it, assembling a power module and manufacturing its semiconductor substrate are not interchangeable capabilities. An integrated automaker may control critical design specifications and module assembly while remaining dependent on external fabrication, materials or specialist equipment. The strategic value of integration therefore depends on which technological bottlenecks are actually internalised, not simply on whether the corporate group possesses an electronics division.
The third distinction concerns vehicle architecture itself. In an electric vehicle, the battery enclosure, underbody structure, crash protection, thermal circuits, electrical distribution and software-controlled operating functions interact closely. Decisions about one subsystem affect packaging efficiency, vehicle weight, manufacturing sequences and serviceability elsewhere. Coordinated engineering can reduce the number of negotiated interfaces between suppliers, facilitate common design standards and accelerate changes during product development. But excessive internal standardisation may constrain the adoption of superior external technologies or increase the cost of changing suppliers. The optimisation problem is consequently dynamic: the most efficient organisational boundary at one technological stage may not remain efficient as battery chemistries, computing architectures and manufacturing processes evolve.
The battery value chain and the limits of internal production
Battery manufacturing is particularly important because it combines high material intensity with technically demanding industrial processes. The production chain involves upstream mineral extraction, refining and chemical processing, active-material manufacturing, electrode preparation, cell assembly, electrolyte filling, formation, ageing, testing and final pack integration. Each stage contributes to cost, quality, output yield and supply risk, but the relative importance varies by chemistry and manufacturing configuration.
The International Energy Agency's 2026 assessment provides several decisive reference points. Global battery manufacturing capacity exceeded 4 terawatt-hours by the end of 2025, an increase of approximately 30% from the preceding year. China accounted for more than 80% of that capacity, while the European Union and United States each accounted for approximately 6–7%. The report also identifies deep concentration in cathode materials, precursors and anode manufacturing. More importantly for industrial economics, it notes that production yields exceeding 90% are necessary for commercially competitive battery manufacturing and that newly established facilities often require several years to approach nominal output. Electric Vehicle Batteries — International Energy Agency, Global EV Outlook 2026, May 2026. IEA
The significance of these figures is that battery competitiveness depends on industrial maturity as much as on installed capacity. A production line capable of manufacturing a stated number of gigawatt-hours annually may initially deliver substantially less saleable output because of process instability, equipment availability, quality defects, formation bottlenecks or insufficient demand. The economic loss associated with rejected cells can be disproportionately important because defective output may already contain expensive active materials and embody substantial energy and processing costs. Accordingly, production yield is not merely a quality statistic; it is a direct determinant of the amount of material, energy, labour and capital consumed per saleable kilowatt-hour.
The cost sensitivity becomes particularly apparent when examining manufacturing yields in a controlled hypothetical example. Suppose a battery-production facility incurs €80 in manufacturing and material costs for each kilowatt-hour entering the relevant production process, before allocating losses to defective output. At a 90% saleable yield, the simplified cost per saleable kilowatt-hour becomes approximately €88.89. At 95% yield it falls to €84.21, and at 98% yield to €81.63. The exercise holds all other costs constant and excludes scrap recovery, rework and differences in fixed-cost absorption; it is not an estimate of BYD's actual manufacturing cost. It demonstrates that relatively small changes in process yield can materially affect production economics, particularly when multiplied across large battery volumes.
| Illustrative battery production yield | Input cost per attempted kWh | Simplified cost per saleable kWh | Difference versus 90% yield |
|---|---|---|---|
| 90% | €80 | €88.89 | Baseline |
| 92% | €80 | €86.96 | −2.2% |
| 95% | €80 | €84.21 | −5.3% |
| 97% | €80 | €82.47 | −7.2% |
| 98% | €80 | €81.63 | −8.2% |
Analytical calculation: €80 divided by the saleable yield. This is a controlled sensitivity model, not reported factory performance. The IEA provides the industry context for the importance of achieving yields above 90%; the assumed €80 input cost is illustrative. Electric Vehicle Batteries — International Energy Agency, May 2026.
This illustrates the potential value of accumulated manufacturing experience. An established integrated battery producer can apply process knowledge across product design, electrode specifications, cell formats and production equipment. Engineers responsible for vehicle battery requirements can work directly with manufacturing specialists to determine whether a requested improvement in energy density, charging capability or packaging efficiency can be achieved without unacceptable effects on yield or cycle time. Where this coordination is effective, the producer can avoid repeated design changes that appear attractive at the product-engineering level but create expensive instability in mass production.
The advantage is nevertheless conditional on manufacturing discipline. A vertically integrated company can make poor technological decisions just as readily as a supplier-dependent company. It may invest heavily in a cell format whose economics subsequently deteriorate, retain obsolete equipment to protect internal capacity, or fail to procure more advanced technology from external manufacturers. Internal production should therefore be evaluated against a credible external purchasing alternative, with equivalent specifications, volumes, warranty obligations and delivery conditions.
Battery chemistry as an industrial-organisation decision
The expansion of lithium iron phosphate batteries is especially relevant because chemistry selection affects the structure of the industrial supply chain. LFP cells rely on different cathode materials from nickel-rich lithium-ion systems, with implications for material costs, manufacturing complexity, energy density and procurement. The IEA reports that LFP batteries accounted for more than 55% of global electric-vehicle battery deployment in 2025, compared with approximately half in 2024. It further reports that average LFP battery-pack prices were more than 40% below those of nickel manganese cobalt alternatives on a per-kilowatt-hour basis in 2025, while cautioning that the aggregate comparison reflects differences in application and performance requirements as well as underlying material economics. Electric Vehicle Batteries — International Energy Agency, May 2026. IEA
These figures establish that chemistry selection can affect costs on a scale potentially larger than many individual assembly-process improvements. The implication is not that LFP is universally superior. Battery chemistry involves trade-offs concerning energy density, mass, packaging, temperature performance, charging characteristics, lifetime and market positioning. A manufacturer specialising in long-range premium vehicles may rationally choose a different battery chemistry from one optimising affordable urban vehicles. Nevertheless, where product requirements permit the adoption of lower-cost chemistry without unacceptable performance penalties, the economic advantage can be substantial.
BYD's broader battery and vehicle integration creates the organisational conditions for such trade-offs to be addressed at the level of the entire vehicle rather than through isolated component procurement. A battery technology with lower cell-level energy density may still support competitive vehicle performance if structural packaging, thermal control, vehicle weight and electrical efficiency are optimised collectively. Conversely, an apparently inexpensive cell may create additional system costs if it requires heavier structures, more complex thermal management or reduced vehicle performance. The appropriate comparison is therefore total battery-system and vehicle cost at equivalent delivered functionality, not cell price alone.
China's upstream position adds another dimension. The IEA states that LFP cathode-material and precursor manufacturing remains overwhelmingly concentrated in China, even as other regions attempt to establish production capacity. It also reports that European LFP battery demand in 2025 was still supported almost entirely by imports from China, either as batteries imported directly or embedded within imported electric vehicles. This concentration means that European manufacturers may adopt the same battery chemistry as Chinese competitors without obtaining comparable cost or supply-security advantages unless the relevant upstream material and process capabilities are also developed or diversified. Electric Vehicle Batteries — International Energy Agency, May 2026. IEA
From supplier interfaces to integrated engineering decisions
The traditional automotive supply model is often described as modular, but that description conceals substantial differences between manufacturers. European automotive groups operate sophisticated internal engineering organisations, maintain direct manufacturing capabilities and exercise significant influence over suppliers. Their dependence on specialised external companies is not necessarily a weakness; it has historically supported technological specialisation, competition between component producers, international sourcing and flexibility in capital allocation. The relevant question is whether a particular manufacturing interface is more efficiently governed through a supplier contract or through integrated corporate engineering and production.
In a modular system, a vehicle manufacturer specifies performance, durability, safety and cost requirements for a component, while the supplier assumes responsibility for satisfying those requirements within agreed contractual conditions. This approach can provide access to technologies developed across multiple customers and reduce the manufacturer’s direct exposure to specialist production assets. Its disadvantages become more pronounced when interfaces are technically complex, specifications change frequently, or production schedules require rapid coordination across several component systems. Repeated engineering approvals, tooling changes, validation procedures and supply negotiations can extend the time between identifying a product improvement and implementing it on the production line.
Vertical integration modifies these transactions. Where internal engineering teams share common information systems, management priorities and product-development schedules, some contractual boundaries become internal coordination problems. Decisions about battery packaging, inverter design and vehicle assembly can potentially be made through a common programme-management structure. Internal production teams may also gain earlier visibility into demand forecasts and platform changes, reducing the need to maintain inventories against uncertain customer orders. However, internal coordination is not automatically faster; large integrated corporations can develop their own bureaucratic approval procedures, competing investment priorities and organisational barriers.
The potential advantage of BYD's model is therefore not the absence of suppliers but the possibility of reducing the number of economically significant interfaces that require negotiation between independently controlled companies. This can matter greatly during rapid product iteration, especially where design changes affect multiple systems simultaneously. A new battery configuration may require modifications to structural packaging, cooling, electronic controls, production fixtures and validation procedures. If those activities are independently scheduled, the delay is determined partly by the slowest external interface. If they are coordinated within a common operating system, at least some of those delays may be reduced.
No public source examined here establishes a statistically comparable time-to-market advantage for Zhengzhou over an identified European facility after controlling for vehicle class, regulatory testing, engineering complexity and model novelty. Claims that Chinese manufacturers introduce new models in a fraction of the time required by European competitors should therefore be treated as hypotheses requiring comparable programme-level evidence, not as quantified Zhengzhou operating results.
The financial boundary of vertical integration
The economics of component internalisation are often oversimplified. A manufacturer that produces a battery internally does not eliminate the cost of that battery. It substitutes internal material purchases, process costs, labour, energy, depreciation, maintenance, research and development, working capital and capital financing for the price charged by an external supplier. It may avoid a portion of the supplier's profit margin, procurement expenses and transport costs, but it also assumes responsibility for capacity utilisation, technological obsolescence, manufacturing defects and the financial risks previously borne by the supplier.
A simplified economic test can be expressed as follows: internal production is attractive when the fully allocated cost of manufacturing a component, including the opportunity cost of capital and quality obligations, is lower than the risk-adjusted cost of purchasing an equivalent component externally. This comparison must consider long-term supply security, technological control and the consequences of future demand changes. An internal manufacturing operation that appears competitive at 95% utilisation may become uneconomic at 55% utilisation because its fixed costs are distributed across fewer saleable units. Conversely, an external supplier may impose higher prices or less favourable delivery conditions when its customer lacks alternative sources.
The most defensible analysis therefore distinguishes three forms of integration: technological integration, which provides control over designs and intellectual property; production integration, which provides control over manufacturing capacity and operations; and transactional integration, which reduces external negotiation and coordination burdens. A company can possess one without possessing all three. For instance, a manufacturer may design a powertrain internally while contracting out manufacturing, or purchase battery cells while maintaining full control over vehicle-level battery management. The optimal structure depends on the technology's strategic importance, the scale of demand and the competitiveness of alternative suppliers.
| Value-chain stage | Potential advantage of internal control | Principal remaining dependency | Industrial risk | Decision-relevant performance measure |
|---|---|---|---|---|
| Battery chemistry and cell design | Coordinated technology choices and vehicle requirements | Advanced materials, chemical inputs, technical expertise | Chemistry lock-in | Cost and performance per usable kWh |
| Electrode and cell production | Process learning, yield improvement, scheduling control | Active materials, separators, electrolytes and equipment | Scrap, yield losses and fixed-capital burden | Saleable yield, throughput, cell cost |
| Battery-pack integration | Packaging, thermal and structural optimisation | Electrical devices, cooling components, safety validation | System complexity and recalls | Pack cost, mass, reliability |
| Power electronics | Coordinated propulsion control and electrical architecture | Semiconductor fabrication, substrates, specialist equipment | Component obsolescence and supply concentration | Conversion efficiency, failure rate, unit cost |
| Electric propulsion | System-level motor and inverter design | Magnetic materials, tooling and selected components | Performance and manufacturing trade-offs | Power density, efficiency, cost |
| Vehicle platform engineering | Common components and shorter design-feedback loops | Software tools, regulatory compliance and testing | Platform dependence | Engineering-change lead time |
| Final assembly | Scheduling, line balancing and quality integration | Selected modules, capital equipment and market demand | Low utilisation | Direct labour hours, defects and cost per vehicle |
| Distribution and after-sales | Customer-feedback integration and service-data access | Logistics networks, local regulation and service partners | Inventory and warranty exposure | Delivery time, inventory turnover, warranty cost |
This table identifies economic mechanisms and possible dependencies. It is not a verified inventory of manufacturing stages located physically inside the Zhengzhou site.
The operational significance of integration becomes clearest when these stages are assessed jointly. A cost reduction achieved in battery manufacturing may be offset by additional vehicle assembly complexity. A faster product launch may produce higher warranty expenses if validation is shortened excessively. Greater internal control over semiconductors may strengthen supply security but reduce flexibility if external technologies improve faster. A credible assessment must therefore identify how management balances cost, technology performance, production stability and capital allocation across the integrated system.
Integrated production and technological iteration
One of the most important potential advantages of close coordination is the ability to shorten the feedback cycle between manufacturing problems and product engineering. In conventional industrial organisations, production defects may require investigation by the assembly plant, a component supplier, a design engineering team and one or more specialist subcontractors before a corrective action is authorised. Where responsibility is fragmented, identifying the relevant technical cause can take longer than the physical implementation of the correction.
A closely integrated manufacturing organisation can potentially reduce these delays through shared manufacturing data, common engineering standards and direct access to process specialists. For battery production, this may involve linking electrode-coating measurements, cell formation results and subsequent battery performance to upstream process settings. For vehicle manufacturing, it may involve connecting structural assembly measurements, electrical-system tests and end-of-line quality results to specific production batches and component configurations. The aim is not simply to collect more data, but to ensure that engineers can identify causes, validate corrections and introduce controlled process changes without losing traceability.
Artificial intelligence and advanced analytics can strengthen this architecture by identifying correlations between production parameters and defects, forecasting equipment failures and assisting with production scheduling. Their effectiveness depends on data quality, consistent component identification, reliable sensors and the ability to intervene safely in manufacturing processes. An algorithm cannot compensate for incorrectly calibrated machinery, unstable material quality or poorly designed process controls. The economic benefit emerges when data-driven recommendations translate into measurable reductions in scrap, downtime, inspection costs or engineering delays.
The International Energy Agency's 2026 assessment explicitly links China's battery-manufacturing cost position to industrial efficiency, automation and component availability, while also noting that European and American production costs can remain as much as 50% higher under assessed conditions before public support. This is evidence of a substantial structural difference in battery industrial economics, but it is not evidence that vertical integration alone explains the entire gap. Differences in plant maturity, materials sourcing, chemistry, production volumes, equipment and financing conditions all contribute. Electric Vehicle Batteries — International Energy Agency, May 2026. IEA
Residual dependencies and the vulnerabilities of internal concentration
The integration model should not be confused with complete technological independence. Battery and vehicle manufacturing remain dependent on materials, machinery, energy, software and specialist expertise distributed across multiple industries. The concentration of several internal manufacturing stages can reduce exposure to some external suppliers while increasing exposure to disruptions affecting the common industrial site or corporate production system. A failure in central utilities, a serious quality problem affecting a common battery platform, or a shortage of one critical electronic component may affect multiple vehicle models simultaneously.
The same concentration can create financial vulnerabilities. A manufacturer that simultaneously invests in battery factories, vehicle assembly, propulsion systems and supporting infrastructure must maintain sufficient demand to utilise assets across several stages. When demand slows, underutilisation can propagate through the internal supply chain. External suppliers may attempt to compensate by selling to other manufacturers, whereas an internal component business designed primarily around one corporate group's vehicle platforms may have fewer immediate alternatives. The significance of this risk depends on whether internal component operations can serve outside customers, switch production efficiently or adapt to different product categories.
A further concern is the allocation of capital between competing technologies. Lithium-ion batteries remain commercially dominant, but the IEA records continuing developments in sodium-ion and solid-state technologies. It notes that sodium-ion manufacturing capacity remains very small relative to lithium-ion production and that solid-state technologies have not yet demonstrated their promised performance advantages at full commercial scale. These uncertainties matter because a deeply integrated production system may have substantial existing investments tied to particular cell formats, manufacturing processes and materials. Its capacity to respond to technological change depends not only on research capability, but also on the flexibility of its installed assets. Electric Vehicle Batteries — International Energy Agency, May 2026. IEA
Key judgments
BYD's integrated manufacturing system has a credible economic rationale because electric-vehicle production contains technically interdependent stages whose coordination can influence total product cost and development speed. The strongest potential advantages concern battery-system optimisation, industrial process learning, production scheduling and engineering-change management. These effects are most valuable when internal production remains competitive with external alternatives and when utilisation is high enough to absorb the substantial fixed costs of specialised manufacturing assets. The available Zhengzhou-specific record establishes a broad component-and-vehicle manufacturing ecosystem, but not the complete internal sourcing ratio, cost advantage or technological autonomy of every production stage.
What would change the assessment
A detailed manufacturing bill of materials distinguishing internal and externally sourced components, accompanied by comparable unit costs, battery yields and product-development schedules, would permit a substantially stronger estimate of integration benefits. Evidence that internal component businesses remain competitive when benchmarked against independent suppliers would reinforce the case for vertical integration. Evidence of persistent underutilisation, low internal transfer-price transparency or delayed adoption of superior external technologies would weaken it.
Open official record
The decisive missing information comprises Zhengzhou's component-level production inventory, the proportion of locally manufactured components installed in vehicles assembled on site, comparable internal and external sourcing costs, battery production yields, engineering-change lead times and the capital employed in each major manufacturing stage.
Chapter 3. Labour, Infrastructure, Logistics and the Economics of Industrial Concentration
Principal judgment: Zhengzhou's industrial competitiveness depends on a combination of labour-market access, internal transport, supporting infrastructure, regional supplier development and coordinated production management. These conditions can substantially influence manufacturing costs, but their effects are neither automatic nor universally transferable. The economic value of industrial concentration lies in reducing the time, uncertainty and resources required to move people, materials, components and production information through a complex manufacturing system. Zhengzhou provides concrete evidence of investment in workforce support and internal mobility, while local official records also reveal unresolved transport constraints. These limitations are important because they demonstrate that the challenges of a very large industrial ecosystem do not disappear when production becomes geographically concentrated; they change character, shifting from the management of distant suppliers towards the management of an extensive, interdependent industrial district.
Workforce concentration and the organisation of industrial labour
Large manufacturing complexes require not only production machinery but also the continuous availability of workers with appropriate technical skills. Automotive production incorporates highly automated processes alongside labour-intensive and specialist activities such as equipment maintenance, quality inspection, material handling, engineering validation, line commissioning and production supervision. Battery manufacturing introduces additional requirements involving chemical processing, electrical safety, precision equipment, contamination control and process engineering. Even as automation reduces direct labour requirements per unit of production, the technical complexity of the remaining workforce can increase.
The employment figures published for Zhengzhou illustrate both the scale of the operation and the difficulty of interpreting workforce totals. The account published by the Henan provincial government portal in February 2025 reported approximately 60,000 employees at BYD's Zhengzhou operation, with more than 90% originating from Zhengzhou or neighbouring areas. It also described a plan to recruit 20,000 additional employees during the first quarter of 2025, covering both manufacturing and research-related activities. These figures demonstrate a substantial recruitment requirement, but a recruitment objective is not a verified increase in employment, and the reported workforce should not be treated as a fixed baseline throughout 2025 or 2026. Zhengzhou Emerges as Crucial Hub for New Energy Vehicles — Henan Provincial Government Portal, 24 February 2025. english.henan.gov.cn
The same source records the existence of staff dormitories, subsidised canteen arrangements and employee benefits. Such facilities can reduce the practical obstacles associated with recruiting and retaining a large workforce, particularly when factories operate multiple shifts or when employees move from surrounding areas to industrial employment. Nevertheless, the existence of dormitories cannot establish their total residential capacity. The recurring claim that accommodation is planned for 60,000 workers remains distinct from the reported employment figure of approximately 60,000. It would require an approved residential development plan, occupancy data and evidence of which housing facilities are intended for BYD workers as opposed to other users of the wider district.
The industrial relevance of workforce accommodation is broader than its housing function. Commuting time, worker turnover, absenteeism, recruitment costs and shift reliability all influence the ability of a factory to maintain predictable output. If workers can live close to their place of employment, the manufacturer may face fewer disruptions associated with long-distance travel, particularly where production schedules change or overtime is required. On the other hand, employer-linked accommodation can create additional management obligations and concentrate workforce welfare, transportation and housing risks around the industrial enterprise. Its net economic contribution depends on accommodation quality, employee preferences, actual occupancy, recruitment alternatives and the cost of providing the service.
The distinction between employment and labour productivity
A workforce estimate of approximately 60,000 employees and annual production of 545,000 vehicles might suggest a ratio of about 9.1 vehicles per employee in 2024. Such a calculation is possible mathematically, but it is not a reliable measure of automotive labour productivity. The employment figure refers to early February 2025 rather than average employment during 2024, and the workforce may include personnel producing batteries and components, employees in supporting functions, temporary workers, engineers and staff involved in constructing or commissioning additional capacity. Vehicle output alone would not capture the value of these other activities.
A comparable European plant may purchase batteries, motors or electronic assemblies from independent suppliers whose employees are not included in its direct factory workforce. Dividing vehicle output by employees at the final assembly site would consequently inflate its apparent labour productivity relative to an integrated site where a wider part of the value chain is included in the employment total. This is a central problem in comparisons between vertically integrated and supplier-dependent manufacturers: the organisational boundary can change the reported productivity denominator even when the underlying amount of labour required to produce a vehicle is similar.
The correct measure depends on the analytical objective. Direct assembly productivity should use hours worked in the relevant assembly processes. Manufacturing labour productivity across the integrated enterprise should account for work performed in components, batteries and supporting services. Economic productivity should measure value added relative to labour inputs, with a corresponding definition of outsourced activities and intermediate purchases. Total industrial competitiveness should extend the analysis to capital costs, energy, materials, production yields and commercial performance.
| Labour and productivity indicator | What it measures | Why it matters | Zhengzhou-specific evidence |
|---|---|---|---|
| Direct assembly labour hours per vehicle | Work required for final vehicle assembly | Measures assembly-process efficiency | Not publicly established |
| Battery labour hours per saleable kWh | Labour intensity of battery production | Allows comparison across cell plants | Not publicly established |
| Manufacturing value added per employee | Economic contribution net of intermediate inputs | More meaningful than output per employee | Not established from available plant accounts |
| Production output per paid labour hour | Factory throughput relative to paid time | Sensitive to shift schedules and downtime | Requires payroll and production records |
| Technical maintenance staffing | Workforce devoted to equipment availability | Reflects automation complexity | Not established |
| Absenteeism and turnover | Workforce continuity | Influences production reliability and training costs | Not established |
| Recruitment pipeline | Ability to expand employment | Relevant during capacity ramp-up | Recruitment objectives documented |
| Total reported workforce | Scale of employment associated with operations | Relevant to regional economic dependence | Approximately 60,000 in early February 2025 |
The distinction also changes how policymakers should interpret automation. A highly automated factory may employ fewer workers directly in assembly while supporting large numbers of employees in tooling, controls engineering, battery production and logistics. Automation can therefore transform the occupational structure of an industrial district without eliminating the need for a substantial labour force. The relevant strategic issue for Europe is not simply the number of jobs associated with each vehicle, but whether its workforce can support production systems with competitive costs, high technical reliability and increasing domestic technological content.
Internal logistics as an element of industrial productivity
One of the more distinctive aspects of Zhengzhou's industrial infrastructure is its internal elevated transport system. The Henan provincial government portal reported that the BYD park's Sky Shuttle began operating on 28 April 2025. The line extends approximately 7.69 kilometres, incorporates 12 stations and connects several categories of facilities, including offices, factories, dormitories and canteens. The source describes an initial operating pattern concentrated around morning and evening peak periods. Henan Launches Its First Park-Based Sky Shuttle Line — Henan Provincial Government Portal, 28 April 2025. english.henan.gov.cn
This infrastructure demonstrates that Zhengzhou's scale requires transport arrangements extending beyond conventional factory circulation. In a smaller production plant, employees may move between facilities on foot or using ordinary internal roads. Across a much larger district, travel times become a meaningful organisational variable. Connecting accommodation, workplaces and service facilities through dedicated transport can reduce uncertainty around shift changes and internal movement. The benefit is particularly relevant where several manufacturing buildings operate different shift patterns and where workforce numbers are large enough to generate concentrated peak demand.
However, internal passenger transport should not be confused with material logistics. The documented Sky Shuttle is evidence of a functioning movement system connecting workers and facilities; it is not evidence that battery cells, vehicle bodies, motors or other industrial components are transported on the same infrastructure. Freight logistics require separate analysis of roads, warehousing, automated guided vehicles, conveyors, shipping operations, inventory management and external suppliers. These systems may interact with passenger infrastructure, but their economic contribution must be measured independently.
The internal transport system also carries continuing operating costs. Passenger services require maintenance, staffing or automated operation, power, safety systems and appropriate capacity. The economic test is whether these costs are offset by lower commuting delays, improved labour availability, reduced reliance on other transport modes or greater flexibility in workforce deployment. The existence of a dedicated transport system demonstrates the industrial district's organisational complexity, but does not itself establish a net reduction in the cost of vehicle manufacturing.
The unresolved last-mile connection with metropolitan Zhengzhou
A document published on the Zhengzhou municipal transport authority's website in May 2026 provides a particularly useful counterweight to the assumption that internal concentration eliminates logistical barriers. It records a proposal to establish a direct express bus connection between the metropolitan area and the BYD factory. The submission identifies substantial cross-district commuting demand, approximately 27 kilometres of supporting roads already developed around the BYD industrial park, and the existing 7.69-kilometre internal Sky Shuttle with 12 stations. It proposes an approximately 55–65-kilometre express route connecting urban transport interchanges with the factory district, while describing the limitations of existing public transport links.
This is a published transport proposal, not proof that the recommended service was implemented. Nor should its description of existing conditions be treated as an independently audited transport-performance study. It is nevertheless valuable because it identifies a concrete issue within the institutional record: the industrial park's internal accessibility and its wider connection to the urban labour market are different problems. Proposal Concerning a Direct Express Bus Route to the Zhengzhou BYD Factory — Zhengzhou Municipal Transport Bureau Website, 7 May 2026. 郑州市交通运输局
This distinction has direct implications for industrial economics. If a manufacturing site becomes increasingly self-contained, journeys between factories, accommodation and internal service centres may be shortened, but external employees and suppliers still require access to the district. The concentration of employment can create substantial peak-hour demand on the connecting road and public transport networks. Failure to coordinate transport services with employment growth can generate costs through commuting uncertainty, worker fatigue, reduced recruitment accessibility and pressure on the surrounding housing market.
A comprehensive assessment of Zhengzhou's labour infrastructure should therefore consider travel time from the main residential catchment areas, the capacity of public transport connections, the location of employee accommodation and the reliability of shift-change arrangements. It should also separate workers employed directly by BYD from employees of contractors and supplier companies. The commercial effect of each transport investment would depend on actual user volumes, operating costs and the extent to which it changes labour availability or production reliability. The evidence examined does not provide sufficiently comparable measures to quantify those effects for Zhengzhou.
Freight logistics, inventory and working-capital efficiency
The principal economic rationale for concentrating interconnected manufacturing operations is the possibility of reducing the distance and uncertainty between successive production stages. In automotive manufacturing, delays in critical components can interrupt production even when all other materials and labour are available. A factory may maintain buffer inventories to protect against such disruptions, but inventory ties up working capital and creates storage, handling, insurance and obsolescence costs. A more closely coordinated supplier network can potentially reduce the amount of inventory needed to maintain reliable production.
Physical proximity can contribute to these improvements, particularly when components are delivered in small batches or synchronised with vehicle assembly sequences. Yet distance is only one determinant of logistics performance. A supplier located adjacent to a vehicle plant may still create delays if production scheduling is poorly coordinated or if the quality of delivered components is unstable. Conversely, a supplier located hundreds of kilometres away may provide reliable service through predictable transport, adequate inventory systems and effective information exchange. Accordingly, the benefit of industrial concentration should be measured through delivery reliability, inventory days, production interruptions and total logistics cost, rather than distance alone.
The financial effect of inventory reduction can be illustrated without assuming proprietary BYD data. Suppose an industrial operation consumes €10 billion of purchased materials and components annually and carries inventory equivalent to 30 days of that expenditure. Using a 365-day convention, the implied material inventory would be approximately €822 million. Reducing the inventory requirement to 20 days would release approximately €274 million of working capital, before considering changes in safety stocks, inventory valuation and financing arrangements. At an assumed 8% annual cost of capital, the associated financing-cost reduction would be approximately €21.9 million annually. These values are hypothetical, but they demonstrate why improvements in supply-chain coordination can have material financial consequences independently of direct production-cost savings.
| Illustrative inventory scenario | Inventory days | Annual material expenditure | Average inventory capital | Capital released versus 30 days |
|---|---|---|---|---|
| High inventory | 30 | €10 billion | €821.9 million | Baseline |
| Moderate reduction | 25 | €10 billion | €684.9 million | €137.0 million |
| Stronger coordination | 20 | €10 billion | €547.9 million | €274.0 million |
| Highly compressed inventory | 15 | €10 billion | €411.0 million | €411.0 million |
Illustrative working-capital sensitivity using a constant €10 billion annual material expenditure and a 365-day year. These are not BYD inventory figures, observed European benchmarks or recommended inventory targets. Reduced inventory can increase disruption exposure if delivery reliability deteriorates.
The example also reveals why inventory reduction cannot be pursued without considering resilience. A manufacturer that eliminates buffers across every production stage becomes more vulnerable to unexpected interruptions in energy supply, transport, materials or quality. Industrial concentration may reduce routine delivery uncertainty while increasing exposure to common disruptions. A fire, flooding event, utility failure or major transport interruption affecting a central manufacturing district can potentially disrupt several stages of production simultaneously. The optimal level of inventory therefore depends on the balance between financing costs, storage expenses and the economic consequences of production stoppages.
Energy supply and the hidden infrastructure requirements of integration
Industrial concentration increases the importance of energy infrastructure because the manufacturing functions brought together may have very different demand profiles. Vehicle assembly uses electricity for welding, robotics, paint operations, ventilation, testing and supporting equipment. Battery-cell manufacturing involves electrically intensive and environmentally controlled production processes, including coating, drying, electrolyte handling, formation and testing. Additional demand arises from climate control, compressed air, wastewater treatment, material handling and supporting industrial services.
A large integrated district may achieve advantages through common energy planning, shared utilities, coordinated peak-load management and more efficient infrastructure investment. These benefits depend on the industrial process mix and the design of distribution systems. The opportunity for energy optimisation is especially important where production operations have different load patterns and where some processes can be scheduled without affecting delivery commitments. However, shared infrastructure can also increase dependence on central systems, making electrical redundancy, process continuity and emergency operations critical.
The available Zhengzhou-specific evidence does not provide a verified site-wide annual electricity-consumption figure, peak electrical load, energy cost per vehicle, battery-production energy intensity or a complete description of power-supply redundancy. Consequently, there is no defensible basis for claiming that the complex achieves a particular electricity-cost advantage over European factories. China's broader industrial energy conditions may influence manufacturing competitiveness, but a credible plant-level comparison would require actual tariffs, contracted supply arrangements, demand charges, electricity consumption, equipment utilisation and equivalent process boundaries. It would also need to distinguish vehicle assembly energy requirements from the much more demanding upstream battery processes.
This issue illustrates a larger problem with comparisons based on aggregate vehicle costs. If a manufacturer produces its own battery cells, the electricity consumed during battery manufacturing becomes part of its internal production cost. A European manufacturer purchasing finished cells may record those energy costs indirectly through the supplier's price rather than through electricity expenditure at its assembly facility. Comparing the two companies' direct electricity bills would therefore provide little information about their relative industrial efficiency. The appropriate unit of analysis is energy consumed across equivalent portions of the value chain.
Logistics resilience and the strategic significance of China's domestic industrial network
Zhengzhou's position within China's wider manufacturing economy provides access to a large industrial market for materials, components, machinery and specialist services. This is potentially advantageous because the reliability of an integrated vehicle complex depends not only on the activities performed within its own boundaries, but also on the maturity and geographical distribution of upstream industries. Battery materials, semiconductors, precision machinery and industrial controls may be supplied from other Chinese manufacturing regions, creating a domestic production network that is geographically dispersed even when final manufacturing is highly concentrated.
The International Energy Agency's 2026 report identifies China's dominant position in global battery-cell manufacturing and in several upstream active-material supply chains. It also stresses that the concentration of these activities creates vulnerabilities for other producing regions, particularly where battery factories remain dependent on imported materials and components. The implication for Zhengzhou is that BYD's integrated production model operates inside a national industrial ecosystem with considerable supporting manufacturing depth. Such depth may reduce reliance on international supply movements for particular components, but it does not eliminate dependence on geographically dispersed Chinese suppliers or imported raw materials. Electric Vehicle Batteries — International Energy Agency, May 2026. IEA
This distinction is central to the question of whether Europe can develop a comparable manufacturing model. Reproducing the physical concentration of vehicle assembly and selected components would not automatically reproduce China's upstream materials ecosystem, experienced battery workforce or supporting equipment industries. A European industrial district could be geographically integrated while remaining dependent on imported cells, cathode materials, semiconductors and specialist machinery. Conversely, a European network of factories distributed across several countries might achieve considerable operational coordination if it shared common engineering standards, information systems, supplier contracts and logistics management.
The relative merits of geographic concentration and distributed production therefore depend on the nature of the component being supplied. Bulky and highly sequenced parts can benefit substantially from proximity to assembly operations. Standardised electronic devices may be economically transported over long distances, although their supply reliability can still be strategically important. Battery cells combine significant mass and value with demanding safety and logistics requirements, making the geographical relationship between cell production and vehicle assembly more consequential. Upstream minerals and chemical materials, by contrast, are governed partly by geological availability, refining capacity and global transport economics rather than the location of the final vehicle plant.
Regional industrial policy and the creation of a self-reinforcing manufacturing ecosystem
The development of a large automotive complex can alter the economic incentives of neighbouring suppliers and public authorities. Once an anchor manufacturer reaches substantial production volume, component businesses may find local investment more attractive because they can expect recurring demand, shorter transport distances and opportunities for technical cooperation. Public authorities may also have incentives to improve roads, utilities, education and logistics services in order to support the resulting employment and industrial activity. If these investments attract further suppliers, the original manufacturing complex can become the centre of a broader industrial cluster whose advantages extend beyond the boundaries of the anchor factory.
Henan's provincial industrial strategy is consistent with this mechanism. The provincial government portal reported that Henan introduced policy measures in 2022 to accelerate new-energy vehicle development, with Zhengzhou serving as a central location. It also documented the presence of several major automotive manufacturers and component operations in the regional economy. Zhengzhou's August 2026 industrial report identifies a wider combination of automotive, electronics, equipment manufacturing and new materials industries. Together, these records support the conclusion that BYD's local manufacturing activities are being developed within an established regional industrial-policy framework. They do not, however, quantify the portion of public investment specifically attributable to BYD or establish how much of the regional cluster's performance would have occurred without the company's expansion. Zhengzhou Emerges as Crucial Hub for New Energy Vehicles — Henan Provincial Government Portal, 24 February 2025; Zhengzhou's Position in China's National New Industrialisation Programme — Zhengzhou Municipal Government, 10 August 2026. english.henan.gov.cn+1
This creates an important distinction between private corporate efficiency and the effects of public industrial coordination. If local authorities finance infrastructure that reduces manufacturers' direct costs, the resulting competitiveness may be genuine from the perspective of the company but cannot be attributed entirely to internal manufacturing efficiency. A complete economic assessment must account for the infrastructure costs borne by public institutions, the benefits shared among multiple firms and the wider fiscal returns generated through employment and economic activity. Infrastructure investment can be justified when it delivers durable economic benefits, but those benefits should be compared against the opportunity cost of using public resources elsewhere.
For European authorities, the lesson is not that every automotive manufacturer requires a large state-backed industrial district. It is that industrial infrastructure, component investment and workforce development must be coordinated with credible production demand. Isolated investments in battery factories, transport links or technical training may deliver limited returns if they are not aligned with a sufficiently stable manufacturing base. Equally, granting extensive support to an anchor manufacturer without clear investment commitments, performance conditions and provisions for supplier access can expose public authorities to concentration risks.
Measuring the true economic benefit of concentration
An integrated industrial complex should be assessed through a comprehensive set of operating and financial measures. These include manufacturing cost per saleable vehicle, capital expenditure per unit of sustainable production capacity, average inventory across the value chain, supplier delivery reliability, manufacturing defects, production interruptions, employee commuting conditions, energy use and total return on invested capital. The measures must be calculated consistently so that the organisational boundary between internal manufacturing and external purchasing does not distort the comparison.
The principal challenge is that industrial concentration creates both internal efficiencies and additional shared costs. Reduced freight movements between nearby facilities may be offset by the cost of building and operating common infrastructure. Shorter engineering interfaces may improve product development but require substantial investment in common data systems. Workforce accommodation may improve recruitment but create additional capital and maintenance obligations. Higher automation may reduce direct labour intensity while increasing depreciation and specialist maintenance expenditure. These effects cannot be reduced to a single measure of factory size or an isolated comparison of wage rates.
The following framework identifies the performance measures necessary to determine whether Zhengzhou's concentration creates a net industrial advantage.
| Performance dimension | Potential benefit of concentration | Potential offsetting cost or risk | Required measurement |
|---|---|---|---|
| Labour accessibility | Reduced internal commuting and improved shift coordination | Housing, passenger transport and workforce-service costs | Employee travel time, absenteeism, recruitment and transport expenditure |
| Component logistics | Lower inter-facility transport and handling requirements | Common infrastructure investment and concentration risk | Total delivered component cost, lead-time variability |
| Inventory management | Reduced safety stocks and working-capital needs | Greater exposure to supply interruptions | Inventory days, stockouts and interruption costs |
| Energy infrastructure | Shared utilities and coordinated load management | High capital requirements and common-system failures | Energy cost per equivalent output unit, reliability |
| Equipment maintenance | Central technical expertise and shared services | Greater dependence on specialist teams and common systems | Overall equipment effectiveness and maintenance cost |
| Production expansion | More coordinated construction and commissioning | Underutilised land, equipment and infrastructure | Capital expenditure per unit of sustainable capacity |
| Supplier development | Proximity, recurring demand and faster technical coordination | Dependence on one major customer | Supplier costs, customer diversification and quality |
| Industrial resilience | Greater control over internal production stages | Common-mode operational disruption | Recovery time, redundancy and business-interruption losses |
Why industrial concentration can create diminishing returns
The benefits of concentration are not unlimited. As an industrial district expands, the distance between individual facilities may increase, internal roads may become congested, passenger transport requirements may grow and common utilities may require more complex redundancy arrangements. The land and infrastructure necessary to support new factories may become progressively more expensive if additional construction requires major road connections, substations, wastewater treatment or extensive civil engineering. At the same time, management complexity can increase as the number of production operations and interdependencies rises.
These effects suggest that the economically optimal configuration is unlikely to be determined by maximum physical concentration. Rather, it depends on balancing the advantages of proximity against the costs of complexity, infrastructure, resilience and capital. Manufacturing stages that benefit from tightly synchronised production may be best located near one another, while activities requiring specialised utilities, hazardous-material management or distinct supply chains may be more efficiently operated in separate facilities. The relevant organisational achievement is not the elimination of distance but the deliberate design of interfaces between production systems.
This is also where digital manufacturing and industrial artificial intelligence become strategically important. Reliable production data, common component identification and accurate demand forecasts can improve coordination across geographically distributed facilities. Consequently, a European manufacturer may be able to reproduce part of the economic benefit associated with an integrated Chinese industrial district without relocating every production stage to one site. The effectiveness of this alternative depends on the consistency of engineering standards, the quality of supplier relationships, the availability of compatible digital systems and the ability to change production schedules without excessive contractual or organisational friction.
The potential advantage of Zhengzhou is therefore best understood as the interaction of physical concentration with organisational control. Where large manufacturing volumes support frequent deliveries, shared engineering and common infrastructure, concentration can reinforce productivity. Where facilities are underutilised or dependent on expensive shared systems, the same configuration can amplify financial and operational risks. Without site-level logistics and financial data, the magnitude of this balance remains unresolved.
Key judgments
Zhengzhou demonstrates that a large automotive industrial ecosystem requires infrastructure extending well beyond production lines. The documented workforce, internal elevated transport system, road development and regional industrial policy provide concrete evidence of this wider organisational structure. The principal potential advantages include coordinated access to labour, reduced uncertainty in component delivery, lower inventory requirements and more integrated technical support. However, the official transport record also identifies metropolitan accessibility concerns, while the absence of site-level energy, logistics and workforce productivity data prevents a reliable calculation of the net economic benefit arising from concentration.
What would change the assessment
Comparable evidence on internal freight movements, supplier delivery performance, material inventory, employee commuting, electricity consumption and total infrastructure costs would allow the mechanisms identified in this chapter to be quantified. Demonstrated reductions in logistics costs and inventory without increased production interruptions would strengthen the case for industrial concentration. Conversely, persistent metropolitan transport constraints, underutilised supporting infrastructure, common-system failures or increasing logistics complexity would indicate that some benefits of geographic integration are being offset by diseconomies of scale.
Open official record
The most important outstanding information includes a current workforce and occupational breakdown, verified accommodation capacity, internal freight-network specifications, supplier-location and delivery data, site-wide electricity and water consumption, utility redundancy arrangements, and the division of infrastructure expenditure between BYD, associated private enterprises and public authorities.
Pillar I — Consolidated Industrial Assessment
The three chapters establish a consistent distinction between the geographical, organisational and economic dimensions of BYD's Zhengzhou development. Geographical expansion provides opportunities for investment sequencing and the concentration of manufacturing functions, but its extent is not evidence of productivity. Vertical integration can improve technological coordination, supply-chain control and manufacturing iteration, but it also transfers component-production risks and capital requirements to the integrated enterprise. Labour, infrastructure and logistics determine whether these organisational advantages translate into reliable production, lower working-capital requirements and commercially sustainable output.
The strongest observable evidence is the existence of a large operational vehicle-manufacturing base embedded within a broader industrial cluster. The weaker evidence concerns the precise territorial boundaries, the proportion of manufacturing inputs produced internally, site-level productivity and the economic returns attributable specifically to concentration. This distinction should govern any comparison with European manufacturers: the appropriate benchmark is the fully allocated economic performance of equivalent battery-to-vehicle production systems, including supplier costs, capital intensity, energy, logistics and quality, rather than the comparative size of their industrial estates.
For European industrial strategy, the immediate implication is that the competitive significance of Zhengzhou is not adequately described as a conventional economy-of-scale advantage. It is a possible economy of coordinated industrial systems, in which manufacturing scale interacts with engineering integration, supplier proximity, process knowledge and public infrastructure. Whether that system consistently outperforms alternative production configurations can only be established through comparable operating and financial evidence. Its documented emergence is sufficient to justify serious strategic attention; its unverified territorial claims are not sufficient to determine the structure of Europe's industrial response.
PILLAR II — PRODUCTIVITY, TECHNOLOGY AND COMPETITIVE ECONOMICS
Chapter 4. Cost Structures, Capacity Utilisation and Manufacturing Productivity
Principal judgment: The economic threat represented by BYD's industrial organisation is not that a Chinese manufacturer can produce vehicles in a geographically larger complex than its European competitors, but that it may combine lower component acquisition costs, greater platform standardisation, competitive battery chemistry, mature industrial processes and concentrated production volumes into a lower fully allocated cost per vehicle. The competitive advantage is not uniform across the automotive industry, and it cannot be inferred directly from reported production figures or corporate profit margins. The strongest independent evidence concerns batteries, where China's price and manufacturing-cost advantages are substantial. The unresolved questions concern the proportion of those advantages attributable specifically to BYD, their transmission into final-vehicle economics, and whether the company's capital-intensive manufacturing system can sustain adequate returns when utilisation weakens, prices decline or export barriers increase.
The structure of automotive manufacturing costs: why apparent price advantages are not equivalent to productive efficiency
An accurate comparison between Chinese and European automotive manufacturers must begin with the distinction between manufacturing cost, cost of goods sold, vehicle selling price and economic profitability. These categories are frequently conflated in public discussion, creating the impression that a manufacturer offering a lower retail price must possess an equivalent production-cost advantage. In reality, the price paid by a consumer incorporates product specifications, taxes, distribution costs, logistics, financing arrangements, commercial margins and the effects of competition. Manufacturing cost reflects a narrower but still complex combination of purchased materials, internally manufactured components, direct labour, energy, consumables, production overhead and depreciation. Corporate profitability introduces additional expenses for research and development, administration, marketing, restructuring and financial obligations, depending on the reporting framework. The distinction is indispensable when evaluating BYD because the company manufactures a broader range of components internally than many competing vehicle assemblers, while its financial statements also consolidate activities beyond automotive manufacturing.
The audited financial record provides an important corrective to the assumption that industrial scale automatically generates superior financial returns. According to BYD's 2025 annual report, the company generated approximately RMB 804 billion in consolidated revenue during 2025, compared with approximately RMB 777 billion in 2024. In its July 2026 corporate communication, BYD reported net profit of approximately RMB 32.6 billion and sales of approximately 4.6 million new-energy vehicles for 2025. The same corporate data imply a net-profit-to-revenue ratio of approximately 4.1%, calculated using rounded figures. This ratio is an indicator of group-wide profitability, not an automotive operating margin, a factory-level return or the profit earned on vehicles manufactured at Zhengzhou. The distinction matters because BYD's consolidated activities include automobiles, batteries, electronic products and other operations, while the company's vehicle sales include battery-electric and plug-in hybrid vehicles rather than exclusively pure-electric cars. BYD Company Limited, Annual Report 2025 — Hong Kong Exchanges and Clearing, March 2026; BYD Ranks 91st in the 2026 Fortune Global 500 — BYD, 28 July 2026. www1.hkexnews.hk+1
The relationship between revenue growth, production expansion and profitability is particularly important. BYD's reported vehicle sales increased to approximately 4.6 million in 2025, while its group net profit was lower than in the preceding year. The company therefore demonstrates that substantial manufacturing scale can coexist with pressure on returns. Industrial expansion may improve bargaining power, distribute engineering costs across more units and reduce some production expenses, but competition can transfer those gains to consumers through lower selling prices. In a market characterised by aggressive discounting and rapid model turnover, technological and manufacturing improvements may be necessary merely to preserve market share, rather than producing a sustained increase in profitability.
This dynamic changes how policymakers should interpret Chinese automotive competitiveness. The ability to sell vehicles at low prices does not necessarily mean that every manufacturer, model or production plant is generating attractive economic returns. At the same time, weak margins do not prove that production is inefficient: they may reflect intense competition, deliberate commercial positioning, high investment in new technologies or temporary costs associated with expansion. Assessing economic sustainability requires the combined examination of gross margins, operating returns, capital expenditure, working capital and free cash generation over several years. A manufacturer's capacity to tolerate weak margins can also become a competitive instrument if it possesses strong liquidity, diversified activities or continuing access to finance, but that tolerance cannot be regarded as unlimited.
Corporate evidence: scale, sales and profitability across different industrial systems
The financial disclosures of BYD, Volkswagen, Hyundai and Tesla allow a comparison of corporate scale and commercial outcomes, although not a definitive comparison of vehicle-manufacturing unit costs. Their reporting boundaries differ substantially. Volkswagen operates multiple passenger-car brands, commercial vehicles and financial services, and has significant Chinese joint ventures accounted for separately. Hyundai's financial data include a broad vehicle portfolio and activities reported under Korean accounting standards. Tesla combines automotive production with energy storage and services. BYD's consolidated accounts include automotive and non-automotive manufacturing. Consequently, revenue per vehicle, consolidated net margin or total personnel per delivered vehicle should not be interpreted as equivalent productivity statistics across the four enterprises.
The companies' primary disclosures nevertheless establish an important competitive landscape. Volkswagen reported approximately 8.87 million vehicles produced in 2025, group sales revenue of €321.9 billion and an operating result of €8.9 billion, equivalent to an operating return on sales of 2.8%. The company explicitly attributed the decline in profitability partly to substantial impairment charges and product-planning adjustments, including measures affecting Porsche. Hyundai Motor reported worldwide wholesale vehicle sales of 4,138,389 units, revenue of approximately KRW 186.3 trillion and operating profit of KRW 11.47 trillion, corresponding to an operating margin of 6.2%. Tesla reported production of 1,654,667 vehicles and deliveries of 1,636,129, while its annual filing recorded a total automotive gross margin of 17.8%, a metric that is not equivalent to the operating margins reported by Volkswagen or Hyundai. Volkswagen Group 2025 Financial Results — Volkswagen AG, March 2026; Hyundai Motor Announces 2025 Annual and Fourth-Quarter Business Results — Hyundai Motor Company, 29 January 2026; Tesla Fourth Quarter 2025 Production, Deliveries and Deployments — Tesla, 2 January 2026; Tesla Form 10-K, Fiscal Year 2025 — US Securities and Exchange Commission, 2026. Volkswagen Group+3
| Manufacturer | 2025 vehicle production or sales measure | 2025 consolidated revenue | Financial performance measure | Industrial interpretation |
|---|---|---|---|---|
| BYD | Approximately 4.60 million NEVs sold | Approximately RMB 804.0 billion | Approximately RMB 32.6 billion group net profit | Large integrated NEV manufacturer; automotive profitability cannot be isolated from consolidated figures |
| Volkswagen Group | 8.866 million vehicles produced | €321.9 billion | €8.868 billion operating result; 2.8% operating margin | Multi-brand global manufacturing group with substantial legacy and transition costs |
| Hyundai Motor | 4.138 million vehicles sold, wholesale basis | KRW 186.3 trillion | KRW 11.47 trillion operating profit; 6.2% operating margin | Diversified powertrain portfolio and internationally distributed production |
| Tesla | 1.655 million vehicles produced | Not used for this comparison because reporting segments differ | 17.8% total automotive gross margin | More concentrated electric-vehicle architecture; gross margin is not operating profitability |
All figures concern fiscal 2025. Production, wholesale sales and deliveries are different measures. Group-level and automotive-segment margins are not interchangeable; currencies are retained in their original reporting units and no cross-currency profitability ranking is attempted.
The principal finding is that manufacturing scale and profitability do not exhibit a simple, uniform relationship across the leading companies. Volkswagen's enormous production base did not prevent substantial pressure on its reported operating return in 2025. Hyundai, with a different geographical footprint and product mix, reported a higher operating margin. Tesla's automotive gross margin remained positive despite lower production and deliveries than BYD, while the SEC filing explicitly identified lower fixed-cost absorption among the factors affecting automotive cost performance. BYD combined very large NEV volumes with group profitability that was materially more modest than its absolute revenue might suggest. These outcomes cannot establish which manufacturer possesses the most efficient assembly plant, but they demonstrate that a competitive industrial model must optimise capital, product mix, commercial positioning and operating flexibility together.
The battery cost gap: the most quantifiable source of structural competitive divergence
The International Energy Agency's Global EV Outlook 2026 offers the strongest quantitative basis for assessing the industrial-cost gap between China and Europe. According to its analysis, average battery-pack prices in China were approximately 35% lower than European averages in 2025, compared with a 25% differential in 2022. The IEA also found that manufacturing costs in Europe and the United States could be as much as 50% higher than in China before public support, largely reflecting differences in production efficiency, automation and material and component costs. These figures are not specific to BYD or Zhengzhou; they describe regional industrial conditions. Nevertheless, battery systems represent a sufficiently important part of electric-vehicle economics that the differential can materially influence the competitiveness of complete vehicles. Electric Vehicle Batteries — International Energy Agency, Global EV Outlook 2026, May 2026. IEA
The direction and magnitude of the cost advantage must be stated precisely. If the European battery-pack price is normalised to 100, the reported Chinese average is approximately 65. Expressed instead as a European premium over the Chinese benchmark, the difference is approximately 53.8%, because the denominator changes. Thus, a Chinese price 35% below the European price and a European price approximately 54% above the Chinese price describe the same relationship. Confusing these percentages is a common source of misleading comparisons. The two regional averages also reflect product and chemistry differences, meaning that they are not identical-specification procurement quotations.
Battery economics additionally interact with the size of the pack installed in a vehicle. The IEA reports that average battery-electric passenger-car battery sizes in 2025 were close to 70 kWh in the European Union and below 60 kWh in China. This difference reflects market composition and vehicle design requirements, among other factors. It means that comparing average expenditure on battery systems across regions without controlling for battery capacity can exaggerate or understate manufacturing advantages. A smaller pack may reduce material expenditure, but a lower-capacity vehicle is not necessarily functionally equivalent to one equipped with a larger battery. Electric Vehicle Batteries — International Energy Agency, May 2026. IEA
For a controlled sensitivity analysis, assume a European battery-pack procurement price of €100 per kWh and a Chinese equivalent of €65, consistent with the IEA's reported average percentage differential. These are analytical index values expressed in euros for computational convenience, not independently verified transaction prices for a particular battery chemistry or vehicle programme. At a common pack capacity of 60 kWh, the resulting expenditure would be €6,000 and €3,900 respectively, representing an illustrative difference of €2,100 per vehicle. At 70 kWh, the difference would increase to €2,450. If the lower pack price applied to an annual production programme of 300,000 vehicles with 60 kWh batteries, the gross difference in battery expenditure would amount to €630 million per year, before adjustments for quality, performance, warranty, transport, taxes, sourcing conditions and engineering requirements.
| Battery size | Europe at assumed €100/kWh | China at assumed €65/kWh | Illustrative difference per vehicle | Annual difference at 300,000 vehicles |
|---|---|---|---|---|
| 40 kWh | €4,000 | €2,600 | €1,400 | €420 million |
| 50 kWh | €5,000 | €3,250 | €1,750 | €525 million |
| 60 kWh | €6,000 | €3,900 | €2,100 | €630 million |
| 70 kWh | €7,000 | €4,550 | €2,450 | €735 million |
| 80 kWh | €8,000 | €5,200 | €2,800 | €840 million |
Analytical sensitivity, not observed BYD procurement costs. The model applies the IEA's approximately 35% regional price differential to hypothetical European pack costs, holding capacity and specifications constant. It does not establish that an equivalent 35% procurement gap exists for every model, supplier or contract.
The industrial implications become more significant when battery cost differences are combined with platform and vehicle-design choices. If a manufacturer can use a less expensive chemistry, reduce structural material requirements, simplify thermal management and standardise battery packaging, the total advantage may exceed the difference in purchased cells alone. Conversely, a European manufacturer that purchases competitive cells from an established Asian supplier may substantially narrow the immediate battery-cost difference without possessing equivalent upstream autonomy. The strategic policy question is therefore separate from the corporate procurement question. A manufacturer may improve vehicle affordability through imported batteries while the European industrial system remains dependent on external technology and manufacturing capacity.
Production utilisation: the point at which scale becomes a liability
The central financial vulnerability of large manufacturing complexes is fixed-cost absorption. Manufacturing facilities require major upfront investment in buildings, equipment, automation, tooling, utilities and engineering. Once installed, a substantial portion of these costs persists even when production declines. The cost allocated to each vehicle therefore increases as output falls, particularly when equipment and labour schedules cannot be adjusted proportionally. A factory may possess highly efficient machinery and still record poor economic performance if demand is insufficient to utilise its capacity.
Consider a hypothetical electric-vehicle assembly operation with sustainable annual capacity of 300,000 vehicles, annual fixed manufacturing costs of €900 million and variable manufacturing costs of €18,000 per vehicle. The fixed-cost allocation would be €3,000 per vehicle at full capacity, €3,750 at 80% utilisation and €6,000 at 50% utilisation. Total manufacturing cost would rise from €21,000 per vehicle at full capacity to €24,000 at 50%, with no change in variable cost, product design or technical efficiency. The example demonstrates that a facility's cost competitiveness can deteriorate rapidly even when its production process remains technologically unchanged.
| Utilisation | Annual output | Fixed cost per vehicle | Assumed variable cost | Total manufacturing cost per vehicle |
|---|---|---|---|---|
| 50% | 150,000 | €6,000 | €18,000 | €24,000 |
| 60% | 180,000 | €5,000 | €18,000 | €23,000 |
| 70% | 210,000 | €4,286 | €18,000 | €22,286 |
| 80% | 240,000 | €3,750 | €18,000 | €21,750 |
| 90% | 270,000 | €3,333 | €18,000 | €21,333 |
| 100% | 300,000 | €3,000 | €18,000 | €21,000 |
Illustrative manufacturing model with €900 million annual fixed costs, €18,000 variable costs per vehicle and 300,000 units of sustainable annual capacity. It is not a description of Zhengzhou, Volkswagen, Tesla or Hyundai. No financing charges, corporate overhead, selling expenditure or changes in product mix are included.
The model also explains why expanding production capacity can temporarily reduce rather than improve financial returns. If a manufacturer installs additional capacity before sufficient demand exists, the new facilities generate depreciation, maintenance and commissioning costs while contributing relatively little output. Early production may also suffer from higher scrap, training requirements and equipment adjustments. The resulting cost disadvantage can persist even when the new plant is technically more advanced than older facilities. Manufacturers must therefore distinguish the long-run cost potential of a mature factory from the transitional costs incurred while reaching commercially sustainable utilisation.
This is especially relevant to Europe's planned electric-vehicle transition. The IEA projects that European Union electric-vehicle manufacturing capacity, including dedicated electric factories and facilities capable of producing both conventional and electric vehicles, could reach approximately 15 million vehicles annually by 2030, compared with projected domestic demand of approximately 7 million under its Stated Policies Scenario. These figures must not be interpreted as a prediction that all European factories will produce only 7 million vehicles or remain 53% utilised: capacity includes facilities that can manufacture different powertrains, while manufacturers can export vehicles and adjust production portfolios. Nevertheless, the mismatch illustrates the risk of planning industrial investment around aggregate nominal capacity rather than credible demand, product competitiveness and export opportunities. Manufacturing and Trade — International Energy Agency, Global EV Outlook 2026, May 2026. IEA
The same economic mechanism applies to China. Large installed capacity can create pressure to maintain production even when domestic demand weakens, because reducing prices may be preferable to allowing expensive assets to remain idle. The IEA reports that China's production of approximately 16 million electric cars in 2025 exceeded domestic demand by roughly 20%, while Chinese electric-car exports doubled to more than 2.5 million. It also identifies intense domestic price competition as an important driver of overseas sales. This does not imply that every Chinese vehicle manufacturer is producing below cost, but it demonstrates that capacity utilisation and export access have become structurally important to the financial sustainability of Chinese electric-vehicle manufacturing. Manufacturing and Trade — International Energy Agency, May 2026. IEA
Manufacturing productivity and the importance of quality-adjusted throughput
A factory's productive performance cannot be assessed solely through the number of vehicles leaving its assembly lines. Output must be adjusted for quality, product complexity, resource consumption and capital employed. A production system that completes more vehicles per hour but generates higher warranty expenses or requires extensive rework may not be more economical than a slower system with more stable quality. Likewise, a manufacturer producing large numbers of relatively simple vehicles should not automatically be described as more productive than a manufacturer producing technically complex vehicles in smaller batches.
The principal variables are takt time, production cycle time, line balance, equipment availability, performance losses, first-pass yield and total manufacturing cost. Takt time represents the pace required to satisfy demand within the available production time, while actual cycle time describes the time required for a particular operation. A factory can meet a rapid final-output cadence through multiple production lines or parallel processes without each individual vehicle being fully manufactured within that interval. Overall equipment effectiveness combines availability, speed performance and quality, but its value depends heavily on how downtime, planned maintenance and acceptable output are defined.
A simplified numerical illustration shows why the distinction matters. Suppose an assembly operation has 7,200 scheduled production hours annually and a nominal output rate of 60 vehicles per hour. The theoretical annual maximum would be 432,000 vehicles. If equipment availability were 90%, operating speed performance 95% and first-pass quality 98%, the combined overall equipment effectiveness would be approximately 83.8%, producing an indicative 361,973 first-pass acceptable vehicles under these assumptions. Improving availability to 94%, performance to 97% and first-pass quality to 99% would increase the combined measure to approximately 90.3% and output to about 390,000 acceptable vehicles, without increasing the number of scheduled operating hours. This is an illustrative model, not measured Zhengzhou performance.
| Manufacturing configuration | Availability | Performance | First-pass quality | Combined OEE | Illustrative acceptable output |
|---|---|---|---|---|---|
| Base operating case | 90% | 95% | 98% | 83.8% | Approximately 361,973 |
| Availability improvement | 94% | 95% | 98% | 87.5% | Approximately 378,050 |
| Speed and reliability improvement | 94% | 97% | 98% | 89.4% | Approximately 386,010 |
| Integrated improvement | 94% | 97% | 99% | 90.3% | Approximately 389,949 |
Analytical sensitivity using 432,000 theoretical annual vehicles. Values are calculated from availability × performance × quality, with rounding. The model excludes bottlenecks outside the assessed manufacturing system.
The implication for European manufacturers is substantial. Improving the performance of existing assets may create additional effective capacity without requiring another industrial site. A factory that increases its quality-adjusted throughput through process stability, predictive maintenance and line balancing can reduce fixed costs per saleable vehicle while avoiding the financial burden associated with major new construction. Such improvements may be especially attractive in regions where labour, energy and capital are expensive, provided the required technological investment delivers a measurable reduction in unit cost.
The relationship between capital productivity and competitive sustainability
Capital productivity is the variable that connects industrial expansion with long-term economic viability. A highly automated, vertically integrated factory can reduce direct manufacturing costs while requiring exceptionally large investment in equipment and infrastructure. If the resulting capital costs are ignored, the factory may appear highly efficient even though its return on invested capital is inadequate. Conversely, a manufacturer that outsources more production may report lower fixed assets while paying higher prices for components whose suppliers carry the associated investment burden.
A valid comparison should therefore assess the combined capital employed across equivalent parts of the battery-to-vehicle value chain. The economic boundary matters more than the accounting boundary. If one manufacturer produces batteries internally and another purchases them, the capital necessary to produce the cells has not disappeared; it has moved to the supplier. The comparison must include the cost of purchased cells or reconstruct the upstream production chain on a comparable basis. Similarly, software development and manufacturing engineering should be allocated over the volume of vehicles expected to use the resulting technology, rather than treated as costs unrelated to the production system.
For Zhengzhou, the necessary plant-level data remain unavailable in the reviewed public record. The documented output and BYD's consolidated accounts are insufficient to calculate return on invested capital for the complex, identify the depreciation associated with individual production phases or establish the economic contribution of each component operation. The absence of these records does not invalidate the integrated-manufacturing model, but it prevents a definitive judgment that Zhengzhou is economically superior to more distributed European production systems.
Key judgments
The largest independently documented cost disadvantage facing European electric-vehicle production remains the regional battery value chain, where manufacturing efficiency, chemistry, materials and component sourcing interact. Scale and integration can reinforce these advantages, but their benefits are conditional on utilisation and economic returns. European manufacturers possess opportunities to improve existing facilities through higher quality-adjusted throughput, product simplification and competitive sourcing, while avoiding the assumption that every competitive response requires greenfield expansion. The decisive measure is the sustainable fully allocated cost of a vehicle meeting equivalent commercial and regulatory requirements, accompanied by acceptable capital returns.
What would change the assessment
Comparable factory-level data on manufacturing cost, invested capital, operating hours, product mix, utilisation, warranty expenses and component sourcing would allow a stronger conclusion about BYD's actual cost advantage. Evidence that integrated Chinese manufacturing consistently maintains lower fully allocated costs while earning competitive returns would strengthen the case for a structural productivity transformation. Conversely, sustained overcapacity, weaker capital returns or cost advantages dependent on loss-making suppliers would narrow the economic significance of the model.
Open official record
The critical missing information is Zhengzhou-specific capital expenditure, installed production capacity by vehicle and battery line, depreciation, manufacturing labour hours, energy consumption, first-pass quality, warranty allocation, internal transfer pricing and return on invested capital.
Chapter 5. Robotics, Artificial Intelligence and the Compression of Industrial Lead Times
Principal judgment: Advanced automation can narrow important dimensions of the production-cost gap between European and Chinese automotive manufacturers, but only when machinery, software, engineering organisation and manufacturing processes are redesigned as a coherent operating system. The central technological challenge is not the acquisition of more industrial robots. It is the ability to convert automation into higher effective throughput, shorter equipment stoppages, lower defect rates, faster production ramp-ups and more rapid implementation of engineering changes. Europe possesses considerable industrial-automation expertise and established robot-intensive manufacturing industries. Its disadvantage is therefore not a general absence of robotics capability, but the uneven speed at which new technology, standardised vehicle architectures and integrated manufacturing information systems are deployed across established production networks. Zhengzhou's development demonstrates the strategic relevance of concentrating manufacturing technologies and engineering decisions, but its specific advantages in artificial intelligence, robot productivity and model-introduction time remain insufficiently documented to justify precise factory-level comparisons.
Industrial robotics in 2026: China's expanding installed base and Europe's established technical position
The global robotics industry has reached a level of development that makes automation a structural determinant of manufacturing competitiveness rather than an optional modernisation programme. According to the International Federation of Robotics, the worldwide operational stock reached approximately five million industrial robots in 2025, following the installation of more than 600,000 new units during that year. China's industrial sector installed approximately 354,000 robots, representing 59% of worldwide annual installations and an increase of approximately 20% from 2024. These figures demonstrate the exceptional scale of China's automation investment, but they do not establish the number of robots deployed at Zhengzhou or the productivity of any particular manufacturer's equipment. Five Million Robots Now Operate in Factories Globally — International Federation of Robotics, 24 September 2026. International Federation of Robotics
The importance of these statistics is that China's advantage is increasingly reinforced by its domestic market for automation equipment. High investment volumes create opportunities for robot manufacturers, industrial software companies, integrators and specialist component suppliers to develop products at scale. A large installed base can support local engineering expertise, maintenance services, replacement components and accumulated experience in automation projects. It can also reduce deployment costs where standardised equipment and integration methods are reused across factories. Nevertheless, a national installation total is not an automotive-industry statistic, and the Chinese industrial economy includes electronics, metals, machinery, logistics-related manufacturing and other sectors with distinct automation requirements.
European industry is not starting from a technologically primitive position. The International Federation of Robotics' 2025 statistics, based on 2024 operational data, placed South Korea first in manufacturing robot density with 1,220 industrial robots per 10,000 manufacturing employees, while Germany recorded 449. The same statistical publication reported an operational robot density of 567 for China, 446 for Japan and 231 for the European Union. Robot density is a ratio of installed industrial robots to manufacturing employment, not a measure of automotive production cost or manufacturing quality. It can also change when the number of manufacturing employees changes, even without an equivalent improvement in factory-level efficiency. World Robotics 2025: Industrial Robots, Executive Summary — International Federation of Robotics, 2025. IFR International Federation of Robotics
The comparison reveals an industrial landscape that is more complex than a simple division between an automated China and a labour-intensive Europe. Germany's manufacturing sector already possesses a highly developed automation base, while South Korea demonstrates that exceptionally high robot density is compatible with a manufacturing model that is geographically distributed and extensively integrated with specialist suppliers. China's distinctive strength lies in the combination of a very large and growing installed automation base with extensive battery manufacturing, electronic-component production, industrial equipment supply and domestic demand. The European challenge is to convert its substantial technological capabilities into competitive production systems across a wider range of vehicle price segments.
| Robotics indicator | Verified reference figure | Reference period | Industrial significance | Limitation |
|---|---|---|---|---|
| Global operational industrial robots | Approximately 5 million | 2025 | Scale of worldwide industrial automation | All manufacturing sectors |
| Global annual installations | More than 600,000 | 2025 | Annual automation investment flow | Does not measure productivity |
| China annual installations | Approximately 354,000 | 2025 | World's largest robotics deployment market | Not automotive-specific |
| China's share of annual installations | Approximately 59% | 2025 | Concentration of new deployments | Not a share of global robot stock |
| South Korea manufacturing robot density | 1,220 per 10,000 employees | 2024 | Very high automation penetration | Economy-wide manufacturing ratio |
| China manufacturing robot density | 567 per 10,000 employees | 2024 | Large and intensive automation base | Not BYD-specific |
| Germany manufacturing robot density | 449 per 10,000 employees | 2024 | Strong European automation capability | Not a plant efficiency measure |
| European Union manufacturing robot density | 231 per 10,000 employees | 2024 | Significant but uneven automation across member states | Cross-country industry composition differs |
| Zhengzhou industrial robot stock | Not established | October 2026 cut-off | Required for direct plant analysis | No verified comparable inventory |
| Zhengzhou quality-adjusted automation performance | Not established | October 2026 cut-off | Required for productivity assessment | No audited plant-level operational series |
Sources: World Robotics 2026 — International Federation of Robotics, September 2026 and World Robotics 2025, Executive Summary — International Federation of Robotics. The robot-density figures are from the 2024 reference year; the installation figures are from 2025. They should not be treated as one contemporaneous measurement.
The industrial-policy consequences extend beyond vehicle assembly. Where a country's manufacturers purchase large quantities of robots, domestic suppliers can benefit from recurring demand for mechanical systems, motion controls, industrial sensors, machine vision, servo drives, safety equipment and software integration. A competitive automation industry can reduce dependence on externally sourced equipment, but only where local suppliers are technologically capable and price competitive. China has developed considerable strength in industrial robotics deployment, while European firms retain important competencies in factory automation, machinery, control systems and industrial software. The policy question is how to preserve and expand those competencies while ensuring that European vehicle manufacturers adopt productivity-enhancing technology rapidly enough to compete.
What automotive automation actually performs
The automotive production process contains multiple automation domains with different technical characteristics and economic returns. Body-in-white manufacturing is particularly suitable for repeatable robotic operations, including welding, positioning, fastening and handling large structural components. Painting can also be highly automated because repeatability, environmental control and material application consistency are critical. Final assembly remains more complex because it involves a wider range of components, variable geometries, human inspection and operations requiring flexibility. Battery-cell manufacturing is different again: its competitiveness depends heavily on continuous process control, precision handling, environmental conditions, material consistency and equipment uptime.
As a result, claims that a factory is 95%, 98% or 99% automated have limited analytical meaning unless the denominator is defined. A manufacturer might calculate automation as the proportion of welding points completed by robots, the percentage of operations automated in one workshop, the number of automated process steps or the share of certain production activities requiring no direct human intervention. These measures cannot be equated with the percentage of total labour eliminated or the fraction of all factory activities performed autonomously.
For Zhengzhou, public descriptions of very high automation should therefore be interpreted as attributed claims concerning particular production environments, not verified evidence that the complete industrial district operates without substantial human intervention. Even extensively automated facilities require personnel for maintenance, process engineering, material handling, quality assurance, software management, equipment commissioning and production planning. Moreover, adding automation to one workshop may merely transfer the bottleneck to another stage. A faster welding operation has limited value if painting, battery delivery, final testing or logistics cannot match the resulting production flow.
The appropriate analytical approach is to examine the automation contribution of individual processes while preserving the interactions between them.
| Manufacturing operation | Principal automation technologies | Potential economic benefit | Main technical constraint | Required KPI |
|---|---|---|---|---|
| Body-in-white | Industrial robots, welding controls, machine vision | Repeatability, dimensional precision, high throughput | Model-change tooling and fixture requirements | Weld defects, cycle time, equipment availability |
| Painting | Robotic application, process sensors, environmental controls | Material efficiency, finish consistency, reduced exposure | Energy requirements, surface defects, rework | Paint usage, rework, energy per vehicle |
| Battery electrodes | Precision coating, drying control, inspection | Lower scrap and process variability | Material consistency and environmental stability | Coating defects, yield, energy per kWh |
| Cell assembly | High-speed handling, sealing, inspection | Throughput and quality consistency | Contamination and equipment precision | Saleable yield, downtime |
| Battery formation/testing | Automated electrical testing and data acquisition | Traceability and defect detection | Formation time and equipment capacity | Testing throughput, rejection rates |
| Final assembly | Assisted handling, robotic fastening, cobots | Ergonomics, quality and selected labour savings | Product variability, accessibility | Labour hours, torque defects, rework |
| End-of-line inspection | Computer vision, automated diagnostics | Earlier defect identification | False positives and validation requirements | Escape rate, false rejection rate |
| Internal logistics | AGVs, AMRs, warehouse control systems | Delivery reliability and inventory control | Traffic coordination and infrastructure | On-time delivery, stoppages |
| Maintenance | Condition monitoring, predictive analytics | Reduced unexpected downtime | Sensor quality and causal reliability | Unplanned downtime, maintenance cost |
AGV means automated guided vehicle; AMR means autonomous mobile robot. These are technology categories and possible applications, not a verified equipment inventory for Zhengzhou.
The potential competitive advantage comes from coordinating these operations rather than independently maximising their automation levels. A manufacturer can increase robot speed without increasing saleable vehicle throughput if another operation remains the bottleneck. It can also reduce direct labour while increasing maintenance complexity or equipment depreciation. The economic objective must therefore be the optimisation of the complete production flow, not the pursuit of the largest possible number of robots.
Artificial intelligence in manufacturing: from data acquisition to controlled industrial decisions
Artificial intelligence can improve manufacturing competitiveness by detecting patterns in complex production data, forecasting disruptions and supporting decisions that would otherwise require substantial manual analysis. Its industrial value differs from that of general-purpose conversational systems. Manufacturing AI must operate within environments where sensor measurements, product specifications, process tolerances and physical safety constraints determine whether an intervention is acceptable. An AI system that recommends changing a machine setting must be integrated with validated engineering limits and appropriate human or automated approval procedures.
The first major application is quality analytics. Automotive and battery factories generate information from dimensional measurements, electrical tests, surface inspection, acoustic monitoring, thermal sensors and process-control systems. Machine-learning algorithms can identify patterns associated with defective products, helping engineers distinguish process problems from random variation. In battery manufacturing, detecting an emerging defect before an entire production batch is completed can reduce material losses. In vehicle manufacturing, identifying recurring assembly problems can reduce rework and warranty exposure. The benefit depends on whether the detection system is sufficiently accurate and whether corrective action can be implemented without excessive interruption.
The second application is predictive maintenance. Industrial equipment produces signals concerning temperature, vibration, current consumption, movement precision and other operating characteristics. Statistical models and machine-learning systems can use those signals to identify patterns preceding equipment failure. Where the predictions are reliable, maintenance can be scheduled before a machine becomes unavailable unexpectedly. However, predictive maintenance has economic value only when avoided downtime exceeds the costs of sensors, software, system integration and unnecessary maintenance interventions. An algorithm generating frequent false warnings can reduce rather than improve production availability.
The third application is production scheduling and logistics coordination. Manufacturers must reconcile component availability, equipment capacity, delivery commitments, workforce schedules and changing customer demand. Mathematical optimisation and AI-assisted planning can help identify schedules that reduce bottlenecks and inventory requirements. The challenge becomes particularly significant in a vertically integrated system because changes in vehicle assembly can affect battery production, component manufacturing and inbound logistics simultaneously. A common planning environment may provide better visibility across these operations, but the actual benefit depends on the consistency and reliability of the underlying data.
The fourth application is engineering knowledge management. Automotive development generates enormous quantities of technical information, including component designs, testing results, manufacturing deviations and supplier specifications. AI-supported search, classification and engineering analysis may help identify previous design solutions or locate conflicts between requirements. Such systems can reduce time spent retrieving information and documenting changes. They cannot replace the need for physical validation, safety testing, regulatory compliance or engineering accountability.
The central implication is that AI creates economic value when incorporated into a controlled manufacturing process whose objectives and constraints are explicitly defined. Deploying AI software without reliable industrial data, interoperable equipment and disciplined engineering workflows is unlikely to generate the productivity improvements implied by promotional claims.
The economic value of reducing unplanned downtime
Manufacturing interruptions create costs through lost production, labour inefficiency, delayed delivery and potentially higher scrap. The value of avoiding downtime depends on the contribution generated by additional saleable output and the extent to which lost production can be recovered through overtime or alternative shifts. The relationship is therefore not equivalent to multiplying factory revenue by interrupted hours.
A controlled example illustrates the sensitivity. Assume an automotive operation has a sustainable production rate of 60 vehicles per hour, annual scheduled operating time of 6,000 hours, and that each additional vehicle sold generates €3,000 of contribution after directly avoidable costs. If equipment improvements reduce unrecovered production losses by 20 hours annually, the additional output could reach 1,200 vehicles and generate €3.6 million of incremental contribution. A reduction of 50 hours would imply €9 million under the same conditions. These values exclude equipment investment, additional working capital, maintenance expenditure and the possibility that demand or downstream capacity prevents the additional vehicles from being sold.
| Annual unrecovered downtime eliminated | Additional vehicles at 60 per hour | Contribution at assumed €3,000 per vehicle |
|---|---|---|
| 10 hours | 600 | €1.8 million |
| 20 hours | 1,200 | €3.6 million |
| 30 hours | 1,800 | €5.4 million |
| 50 hours | 3,000 | €9.0 million |
| 100 hours | 6,000 | €18.0 million |
Illustrative model. It assumes demand exists, output is saleable, production losses cannot otherwise be recovered and €3,000 is the relevant incremental contribution per vehicle. It does not describe measured results at BYD or any European manufacturer.
The example demonstrates why relatively small improvements in equipment availability can justify investment in maintenance analytics at high-volume factories. It also identifies the economic limitation: the value of additional capacity depends on the ability to sell the output. Where demand is insufficient or production is already recoverable through unused shifts, the contribution benefit is smaller. Automation projects must therefore be evaluated against operating conditions rather than generic claims of increased production speed.
Compression of industrial lead times: separating development, industrialisation and production cadence
The introduction of a new vehicle model involves several overlapping activities: product definition, engineering design, component selection, software development, prototype construction, testing, homologation, tooling, supplier qualification, production-line commissioning and manufacturing ramp-up. The total elapsed time depends on whether the model is based on an existing platform, the extent of technical innovation, regulatory requirements and the manufacturer’s ability to conduct activities concurrently.
A common error is to compare the development of an extensively redesigned European vehicle platform with the launch of a Chinese model using an existing architecture and then attribute the entire timing difference to organisational superiority. The comparison must distinguish a new platform from a derivative model, a complete redesign from a limited update, and public model presentation from the beginning of serial production. It must also identify whether the reported duration starts with initial concept approval, formal programme authorisation or engineering freeze.
Vertical integration can accelerate parts of the development process by enabling concurrent engineering. Battery, propulsion and vehicle teams can evaluate design changes together, while manufacturing specialists assess production feasibility before specifications become final. Standardised platforms can reduce the number of unique engineering interfaces and allow existing tooling or software modules to be reused. Digital simulation and virtual validation can further reduce the number of physical prototypes required for some engineering activities, although safety-critical systems still require physical tests and formal compliance procedures.
For Zhengzhou, the public record reviewed does not establish a complete and independently comparable series of model-development durations. Consequently, assigning a specific Chinese advantage of six, twelve or eighteen months over European competitors would be speculative. The useful alternative is to identify the conditions under which development time can be shortened and quantify how hypothetical improvements would affect investment recovery.
Consider a model-development programme requiring €1.2 billion of engineering and industrialisation expenditure, with expected lifetime sales of 800,000 vehicles. The simple development-cost allocation is €1,500 per vehicle. If the manufacturer can reuse platform technology and reduce investment to €900 million while maintaining the same expected sales, the allocation falls to €1,125, a saving of €375 per vehicle. If, instead, market demand is weaker and lifetime volume falls to 500,000, the original €1.2 billion programme carries an allocation of €2,400 per vehicle. These calculations illustrate why the combination of platform reuse and reliable sales volume can be more important than a development-time reduction considered in isolation.
| Programme scenario | Development and industrialisation expenditure | Lifetime vehicle volume | Simple expenditure allocation per vehicle |
|---|---|---|---|
| Original programme | €1.2 billion | 800,000 | €1,500 |
| Reused architecture | €900 million | 800,000 | €1,125 |
| Higher-volume platform | €1.2 billion | 1,200,000 | €1,000 |
| Reduced market demand | €1.2 billion | 500,000 | €2,400 |
| Reused architecture, weaker demand | €900 million | 500,000 | €1,800 |
Hypothetical programme economics. The calculation divides programme expenditure by lifetime sales and excludes discounting, model-specific manufacturing investment, warranty, capital costs and product differences. It demonstrates sensitivity rather than actual manufacturer expenditure.
The ability to introduce models more frequently can also create competitive risks. Shorter product cycles may increase engineering expenditure, accelerate the depreciation of specialised tooling and complicate spare-parts support. Frequent changes can reduce the period available to recover development investments and may increase software maintenance obligations. A company that introduces a new model rapidly but earns inadequate returns has not necessarily achieved a superior industrial outcome. The relevant objective is therefore shorter economically productive development cycles, not the maximum possible frequency of new launches.
The industrial conditions required for AI and robotics investment to succeed
European manufacturers can invest in the same broad categories of automation used in China, but the capital required depends on the starting condition of the factory. Introducing predictive maintenance into an existing production line may require sensors, connectivity, software integration and engineering work without replacing the entire line. Automating a previously manual handling operation may require new robots, fixtures, guarding, safety validation and training. Redesigning a factory around new vehicle architectures may require extensive investment in tooling, material flows, software systems and building modifications.
The capital burden should therefore be assessed at the level of individual manufacturing processes. There is no credible universal cost per robot, cost per automated production line or capital expenditure per vehicle of capacity that can be applied across all manufacturers. Costs vary according to payload, precision, operating environment, software, safety requirements, commissioning complexity and existing infrastructure. A robot purchased for basic material handling is not economically comparable to a fully integrated welding cell or precision battery-manufacturing system.
A disciplined investment programme should begin with quantified operating losses, identify the technologies capable of reducing them and calculate the contribution benefit under conservative utilisation assumptions. The relevant measures include direct labour savings, quality improvement, reduced equipment downtime, lower scrap, inventory reduction and the ability to manufacture different models using common equipment. Expected benefits should be tested against installation disruption, maintenance requirements, software support, financing costs and the possibility that market demand changes before the investment is fully recovered.
| Automation investment category | Typical investment scope | Principal economic benefit | Main implementation risk | Appropriate evaluation |
|---|---|---|---|---|
| Machine vision | Cameras, lighting, computing, software validation | Defect detection and reduced rework | False classifications, integration | Quality improvement relative to total cost |
| Predictive maintenance | Sensors, industrial connectivity, models | Avoided downtime and improved availability | Poor signal quality, unnecessary interventions | Value of unrecovered downtime avoided |
| Robotic handling | Robots, tooling, guarding, safety systems | Labour efficiency and ergonomic improvement | Model variability and commissioning downtime | Cost per equivalent operation |
| Flexible assembly | Reconfigurable fixtures, controls, programming | Multi-model production and reduced changeover | Higher complexity and initial investment | Utilisation across product scenarios |
| Battery automation | Precision process equipment and inspection | High yield and saleable throughput | Process instability and scrap | Cost per saleable kWh |
| Production digital twin | Engineering models, plant data and simulation | Faster validation and change planning | Incomplete or inaccurate models | Verified development and commissioning savings |
| Integrated production planning | ERP/MES interfaces, scheduling algorithms | Inventory and schedule coordination | Data inconsistency, cybersecurity | Total logistics and interruption cost |
| AI-assisted engineering | Technical data integration, validated AI systems | Faster information retrieval and engineering support | Incorrect outputs and validation burden | Measured engineering time and quality |
ERP denotes enterprise resource planning; MES denotes manufacturing execution systems. The table describes investment requirements and evaluation methods, not fixed procurement budgets.
The role of European public policy should be complementary rather than substitutive. Financial incentives for automation can help overcome investment constraints, particularly among smaller component suppliers, but an incentive that merely reimburses equipment purchases does not guarantee productive deployment. More effective measures would link public support to measurable improvements in manufacturing capability, technical training, digital integration and commercially sustainable production. In the European context, supporting interoperable industrial software and common data standards may also deliver benefits across networks of independent suppliers, enabling distributed manufacturers to coordinate some activities that vertically integrated groups perform internally.
The five-year technological outlook
Between 2026 and 2031, the most economically consequential developments are likely to concern the industrial application of machine learning, more flexible production automation, quality analytics and the coordination of manufacturing information. Humanoid robotics and highly autonomous industrial systems may attract considerable investment, but their economic relevance must be established through demonstrated reliability, safety, maintenance costs and productive performance. Announcements of pilot projects or prototype deployments should not be treated as evidence of commercial manufacturing efficiency.
The International Federation of Robotics' September 2026 publication demonstrates that automation investment is accelerating globally, with China accounting for the majority of new industrial robot installations. This increases the pressure on European manufacturers to modernise production, but it also creates opportunities for European automation suppliers to sell equipment and expertise into expanding markets. The strategic risk is not simply that European factories will have fewer robots, but that European industry may lose influence over the technologies, software and equipment through which future manufacturing systems are designed and controlled. Five Million Robots Now Operate in Factories Globally — International Federation of Robotics, September 2026. International Federation of Robotics
Europe's strongest response is therefore to combine industrial automation investment with the preservation of its machinery, controls, robotics and systems-integration capabilities. A manufacturer that purchases automation equipment but depends entirely on external suppliers for engineering, software modification and maintenance may improve short-term production efficiency while acquiring new strategic dependencies. A more durable approach develops internal engineering competence and maintains competitive relationships with specialist suppliers capable of providing technology upgrades over the life of the factory.
Key judgments
Robotics and artificial intelligence can materially improve European automotive competitiveness, but their economic value depends on integration with product architecture, manufacturing quality and capital allocation. European industry already possesses substantial automation capabilities, particularly in Germany and its associated supplier networks. China's advantage is reinforced by the scale and momentum of automation deployment and by the manufacturing ecosystem in which those technologies operate. Zhengzhou-specific claims of exceptional automation performance remain insufficiently defined to support numerical superiority rankings. The decisive future measure is not the proportion of automated operations, but the reduction in quality-adjusted manufacturing cost and engineering lead time at acceptable capital returns.
What would change the assessment
Verified comparisons of production-line availability, first-pass quality, labour hours, robot utilisation, maintenance expenditure and engineering-change duration would allow stronger judgments about automation productivity. Demonstrated European improvements achieved through flexible automation and common production platforms would reduce the strategic significance of geographical concentration. Conversely, evidence that Chinese manufacturers consistently achieve shorter model-introduction cycles and lower total manufacturing costs across equivalent vehicle categories would strengthen the argument that Europe's operating model requires more fundamental restructuring.
Open official record
The decisive missing evidence comprises Zhengzhou's robot inventory by production function, manufacturing execution-system architecture, quality-adjusted production rates, AI deployment records, maintenance outcomes and comparable model-introduction schedules. Without these data, claims of a specific automation or AI productivity advantage must remain conditional.
Chapter 6. Comparative Industrial Models: BYD, Volkswagen, Hyundai, Tesla and European Producers
Principal judgment: The leading automotive manufacturers are not competing through a single industrial model. BYD combines substantial internal component capabilities with a rapidly expanded new-energy vehicle portfolio. Volkswagen operates a geographically distributed, multi-brand industrial system with extensive specialist suppliers and increasing direct involvement in battery technology. Hyundai combines global production, established powertrain expertise and industrial coordination across a wider Korean manufacturing ecosystem. Tesla emphasises dedicated electric-vehicle architectures, standardisation, software integration and highly concentrated production platforms. These models involve different choices concerning capital intensity, technological control, supplier dependence and exposure to market volatility. The evidence does not establish that BYD's configuration is universally superior; rather, it indicates that the competitive advantage of each system depends on how effectively it combines vehicle architecture, component economics, utilisation and commercial demand.
BYD: integrated components, manufacturing scale and exposure to intensifying competition
BYD's industrial organisation differs from that of many established manufacturers because the company entered the automotive industry's technological transformation with substantial battery-related expertise. Its corporate activities encompass batteries, vehicle technologies, electronics and associated manufacturing operations, enabling the company to exercise direct influence over several components that have become strategically important in electrified vehicles. BYD's official description of its technologies identifies the Blade Battery, cell-to-body integration and dedicated electric-vehicle platforms among its principal innovations. These are first-party claims concerning the company's technologies, not independent evidence that every implementation is economically superior to competing designs. About BYD — BYD Corporate Information, accessed October 2026. BYD AUTO
The company's approach offers several advantages. Control over battery architecture permits vehicle engineering decisions to be coordinated with cell design and packaging. Internal propulsion and electrical-system development can reduce some supplier interfaces. Large sales volumes create opportunities to spread platform development costs across multiple models. A substantial domestic manufacturing base provides access to the wider Chinese supply ecosystem, including active materials, equipment and electronic components. The advantages are most pronounced where platforms share components and production volumes remain sufficiently high to utilise internal manufacturing capacity.
The same configuration creates vulnerabilities. Investment in several manufacturing stages commits substantial capital to technologies and production volumes whose profitability depends on future demand. Where competitive pressure forces vehicle prices downward, internal component businesses may have limited ability to maintain margins independently of the vehicle division. A company may protect market share through price reductions while transferring financial pressure upstream into its internal production chain or external suppliers. Large sales volumes consequently do not guarantee attractive returns on the capital required to sustain them.
BYD's 2025 financial outcome demonstrates this distinction. Its reported NEV sales reached approximately 4.6 million units and consolidated revenue approximately RMB 804 billion, but its net profit was approximately RMB 32.6 billion. The combination of significant volume and a net margin of roughly 4.1% illustrates that industrial scale and commercial pressure can coexist. This ratio should not be compared directly with Volkswagen's operating margin or Tesla's automotive gross margin; the underlying accounting categories and business activities differ. It does, however, limit the inference that exceptional manufacturing scale necessarily produces exceptional profitability. BYD Company Limited, Annual Report 2025 — Hong Kong Exchanges and Clearing, March 2026; BYD Corporate Financial and Sales Update — BYD, July 2026. www1.hkexnews.hk+1
The strategic significance of BYD's model is therefore the potential to coordinate a broad production system, not an assumption that its entire value chain consistently earns superior returns. The model performs best when its internally developed technologies remain competitive, common platforms achieve substantial volume and the manufacturing system adapts rapidly to demand changes. It becomes more vulnerable when technological change requires costly retooling, internal component capacity exceeds requirements or price competition absorbs the savings generated by manufacturing improvements.
Volkswagen: industrial breadth, inherited complexity and the transition towards greater battery integration
Volkswagen's industrial organisation illustrates both the advantages and disadvantages of a mature global automotive manufacturing system. The group operates multiple brands with different market positions, vehicle architectures and technological requirements. Its production network is geographically extensive and supported by a sophisticated supplier base. Such an organisation provides diversification, access to specialist technologies and the ability to serve different customer segments. It also creates substantial engineering and organisational complexity, particularly when legacy combustion-engine operations coexist with expanding electric-vehicle production and software development.
Volkswagen's 2025 financial results show the magnitude of this challenge. The group reported approximately 8.866 million vehicles produced, €321.9 billion in revenue and €8.868 billion in operating profit, corresponding to a 2.8% operating margin. Its 2025 annual report identifies impairment charges and product-planning adjustments among the major factors affecting reported profitability. The group also disclosed substantial investment and operating expenditure associated with its software and battery activities. These costs should not be interpreted exclusively as evidence of structural inefficiency, because they include expenditure intended to support future technology development, but they demonstrate the financial burden of transforming a large established production system while sustaining existing operations. Volkswagen Group Annual Report 2025 — Results of Operations. Volkswagen Group Annual Report 2025
Volkswagen's response increasingly includes direct control over battery-cell technology. On 17 December 2025, the group announced that its PowerCo subsidiary had commissioned the Salzgitter gigafactory and produced the first Unified Cells manufactured in Europe. Volkswagen stated that the cells would proceed through final road testing before their planned introduction in electric urban vehicles across several group brands. This development is strategically important because it shows that European manufacturers are not necessarily committed to a permanently external battery-supply model. Instead, they are selectively internalising technologies where they perceive a need for greater control over design, supply security and industrial costs. Start of European Battery Cell Production: PowerCo Commissions Salzgitter Gigafactory — Volkswagen Group, 17 December 2025. Volkswagen Group
The distinction between commencing production and reaching commercially competitive scale is essential. Initial cell production demonstrates that the industrial process has entered an operational phase, but does not establish mature yields, full capacity utilisation or costs equivalent to established Asian manufacturers. Volkswagen's battery strategy must therefore be evaluated over several production cycles, including the performance of its cells in commercial vehicles, manufacturing yields, supply-chain reliability and the amount of capital necessary to reach stable output.
Volkswagen's potential advantage lies in the combination of platform scale, established manufacturing expertise and a large customer base. If it can standardise battery systems, reduce model-specific engineering complexity and use common components across several brands, it may achieve substantial economies without physically concentrating all production in one industrial district. Its principal challenge is to reduce the cost of managing diversity. A large portfolio can become an advantage when differentiation is supported by common engineering foundations; it becomes a liability when brands maintain unnecessary technical duplication, fragmented software systems or separate component architectures.
Hyundai: the alternative of disciplined global manufacturing integration
Hyundai provides a particularly useful comparator because its manufacturing strategy demonstrates that industrial competitiveness can be sustained through a system combining internal capabilities, external suppliers, established engineering and internationally distributed production. Its industrial organisation cannot be reduced to the geographical concentration of one factory. Instead, it relies on coordination between vehicle production, engineering, supplier networks and different powertrain technologies.
Hyundai Motor reported worldwide wholesale sales of 4,138,389 vehicles in 2025, revenue of approximately KRW 186.3 trillion and operating profit of KRW 11.47 trillion, corresponding to a 6.2% operating margin. The company attributed pressure on annual profitability partly to international trade uncertainty and tariffs. Its results nevertheless show that a manufacturer with a diversified portfolio and substantial global operations can maintain positive operating performance without adopting an industrial configuration identical to BYD's. Hyundai Motor Announces 2025 Annual and Fourth-Quarter Business Results — Hyundai Motor Company, 29 January 2026. Hyundai
Hyundai's strategy also illustrates the economic value of powertrain flexibility. The company maintained a broad portfolio of conventional, hybrid and battery-electric vehicles, allowing it to respond to differences in consumer demand and regulatory environments. This diversification can protect revenue when electric-vehicle adoption develops unevenly across markets. However, maintaining multiple powertrain technologies also increases engineering requirements and manufacturing complexity, potentially limiting the cost advantages available to a manufacturer specialising exclusively in electrified platforms.
The Korean industrial ecosystem provides an additional structural advantage. South Korea's very high robot density demonstrates substantial automation capabilities across manufacturing, while its established battery and electronics industries contribute to a deep technical supplier base. These conditions support sophisticated manufacturing coordination without requiring every component supplier to operate within one physical industrial estate. The model therefore provides evidence that industrial-system integration can be achieved through concentrated corporate coordination and advanced supplier networks without complete geographical concentration.
Hyundai's position is not without vulnerabilities. International production creates exposure to trade restrictions, local-content requirements and currency movements. Multi-powertrain manufacturing can require duplicated equipment and engineering resources. Battery sourcing remains strategically important, and the competitive position of its electric vehicles depends on chemistry, platform design, manufacturing maturity and component costs. Nevertheless, Hyundai demonstrates that the appropriate response to BYD is not necessarily an identical degree of vertical integration, but the creation of sufficiently coordinated and adaptable production systems.
Tesla: platform concentration, manufacturing specialisation and the costs of utilisation volatility
Tesla represents a different industrial model in which dedicated electric-vehicle platforms, software architecture, production standardisation and manufacturing-system design play central roles. Its comparatively concentrated product portfolio allows greater reuse of components and manufacturing processes across high-volume models, although it also increases exposure to changes in demand for those models. Unlike a diversified group producing numerous conventional and electric platforms, Tesla has been able to organise its principal automotive production around a narrower range of vehicle architectures.
The company's 2025 production results illustrate both its scale and the limits of this model. Tesla manufactured 1,654,667 vehicles during the year and delivered 1,636,129. Model 3 and Model Y together accounted for 1,600,767 vehicles produced, representing approximately 96.7% of total automotive production. This concentration is economically relevant because common platforms can support specialised tooling, component standardisation and high-volume manufacturing. However, it also creates dependence on the commercial performance of a relatively small number of vehicle families. Tesla Fourth Quarter 2025 Production, Deliveries and Deployments — Tesla, 2 January 2026. Tesla Investor Relations
Tesla's Form 10-K for 2025 reported that the cost of automotive sales decreased compared with the preceding year, influenced by lower delivery volumes, changes in vehicle mix and reduced material costs. At the same time, the filing explicitly identified lower fixed-cost absorption and increased tariffs as offsetting pressures. Its total automotive gross margin declined from 18.4% in 2024 to 17.8% in 2025. These disclosures are valuable because they demonstrate that a manufacturer with extensive platform standardisation and dedicated electric-vehicle production remains exposed to the economics of utilisation and market demand. Tesla Annual Report 2025, Form 10-K — US Securities and Exchange Commission, 2026. sec.gov
Tesla's international manufacturing system also illustrates why location matters independently of corporate engineering architecture. The company has established production in the United States, China and Europe, allowing it to serve different regional markets while managing trade and logistics exposure. Such a configuration can reduce the need to export every vehicle from a single manufacturing country, but it requires repeated investment in facilities and supporting supply chains. Regional factories may achieve different cost structures because labour, energy, local sourcing, equipment maturity and production volumes vary. A group-wide margin therefore cannot establish whether a particular Tesla plant is more productive than Zhengzhou.
The frequent comparison between Zhengzhou and Tesla's Nevada Gigafactory is especially problematic because the industrial functions are not equivalent. Nevada is associated with batteries, energy products and other manufacturing activities, while vehicle assembly takes place at other Tesla facilities. Comparing the development acreage of Zhengzhou with Nevada's factory site therefore combines different industrial boundaries and production functions. A meaningful comparison would identify the operations included in each facility, their installed and realised capacities, the associated capital expenditure and the cost of equivalent manufactured products. Territorial ratios alone cannot establish industrial superiority.
Direct comparative assessment: five manufacturing models and their economic mechanisms
The competing systems differ in the ways they allocate investment, manage technology and organise supply chains. BYD emphasises direct control over strategically important components and integration with China's domestic manufacturing ecosystem. Volkswagen combines extensive internal engineering with a broad supplier system and increasing direct battery investment. Hyundai relies on coordinated manufacturing and component capabilities across an established industrial network. Tesla concentrates on dedicated electric-vehicle architectures and selected high-volume platforms. Europe's wider manufacturing system consists of numerous original-equipment manufacturers and suppliers whose technological capabilities are substantial but whose industrial coordination varies by company, country and product category.
| Competitive dimension | BYD | Volkswagen | Hyundai | Tesla | Wider European production system |
|---|---|---|---|---|---|
| Principal production model | Integrated NEV manufacturing and selected critical components | Multi-brand, multi-powertrain global network | International multi-powertrain production | Dedicated EV platforms and selected high-volume models | Mixed OEM and specialist-supplier networks |
| Battery strategy | Strong internal battery capabilities | Internal capacity expansion through PowerCo plus external supply | Group and external battery ecosystem | Mixed sourcing and selected internal technology development | Significant reliance on external cell manufacturers |
| Vehicle-platform complexity | Multiple electrified platforms and model families | Extensive portfolio across brands and powertrains | Diverse powertrains and vehicle classes | Highly concentrated principal vehicle families | Highly variable |
| Manufacturing flexibility | Strong potential through integrated operations; site-level metrics unavailable | Broad network but complex coordination | Multi-powertrain and regional adaptability | Platform efficiency with model concentration | Depends on architecture and plant maturity |
| Supplier interface management | Greater internal control of selected stages | Large internal and external supplier ecosystem | Coordinated group and specialist-supplier network | Significant internal engineering with external component sourcing | Fragmented across multiple companies |
| Capital exposure | Batteries, components and vehicle manufacturing | Legacy assets, new platforms, batteries and software | Global plants and multiple technologies | Dedicated EV plants and specialised tooling | Mixed legacy and transition investment |
| Main economic vulnerability | Internal overcapacity and price pressure | Complexity, transformation costs and weak utilisation | Multi-powertrain cost and trade exposure | Model concentration and fixed-cost absorption | Battery costs, fragmentation and investment duplication |
| Main strategic advantage | Coordinated electrified manufacturing capabilities | Global scale, brands, engineering and market access | Diversification, manufacturing discipline and supplier ecosystem | Standardisation, EV specialisation and software integration | Engineering depth, specialist machinery and differentiated products |
This is an analytical comparison of organisational models based on official corporate disclosures. It is not a ranking of site-level manufacturing cost, innovation performance or operational efficiency.
The comparison supports an important distinction. Vertical integration, platform standardisation and supplier coordination are not competing objectives in every circumstance. A manufacturer may simultaneously own some components, outsource others and use common platforms across multiple vehicle models. The industrial question is which activities must remain under direct control to protect competitiveness and which can be supplied more efficiently by specialised firms.
For instance, a company may seek direct control over battery-management software while purchasing cells from external manufacturers. It may own inverter design capabilities while contracting semiconductor fabrication. It may standardise vehicle architectures while operating assembly plants in several countries. Such arrangements can preserve technological control while avoiding some of the capital intensity associated with manufacturing every component internally. Their success depends on the quality of supplier relationships, contractual flexibility, engineering coordination and the availability of alternative sources.
The European industrial model: the strategic value and cost of specialisation
Europe's automotive system should not be treated as one homogeneous manufacturing organisation. German manufacturers have developed substantial capabilities in premium vehicles, complex powertrains, engineering and industrial automation. French manufacturers have important experience in mass-market production, platform development and internationally coordinated vehicle manufacturing. Italy possesses specialist component, machinery, engineering and manufacturing capabilities whose competitiveness depends partly on access to European and international automotive programmes. The United Kingdom combines automotive assembly, premium manufacturing, specialist engineering and international investment relationships, while operating under a distinct trade and regulatory framework.
The diversity of these capabilities provides resilience and opportunities for technological specialisation. A supplier serving several manufacturers can spread development costs across customers and avoid dependence on one platform. Specialist machinery companies can develop technologies applicable beyond automotive production. Premium manufacturers may earn sufficient margins to support advanced engineering and differentiated customer experiences. Yet these strengths do not eliminate the need for competitive battery costs, efficient production and faster product development. In price-sensitive vehicle segments, engineering excellence does not compensate indefinitely for large differences in manufacturing cost.
The relevant strategic choice is therefore not between preserving Europe's existing production model unchanged and recreating Zhengzhou's industrial geography. It is between fragmented production systems whose technical and commercial interfaces remain expensive, and coordinated systems capable of combining specialist expertise with common platforms, efficient procurement and rapid industrial execution. Europe's industrial structure can remain geographically distributed, but the costs associated with unnecessary complexity must be reduced.
The European Commission's 2025 automotive action plan recognises the breadth of the sector's economic importance and identifies innovation, supply chains, competitiveness and the transition to zero-emission mobility as central policy concerns. The Commission's approach provides a framework for industrial coordination, but the economic results will depend on company-level implementation, investment discipline and the competitiveness of technologies actually deployed. Industrial Action Plan for the European Automotive Sector — European Commission, 5 March 2025.
The significance of trade and localisation for competing production models
International trade introduces another dimension into the comparison. A factory's competitiveness in its domestic market does not automatically translate into equivalent competitiveness abroad because vehicles face transportation costs, import duties, distribution expenditure, regulatory requirements and potentially different consumer preferences. A manufacturer may therefore possess a substantial manufacturing-cost advantage but find that part of it is absorbed before the vehicle reaches the foreign consumer.
The IEA reports that approximately 940,000 Chinese-made electric cars were sold in Europe in 2025, an increase of almost 50% compared with 2024. It also estimates that China produced approximately 16 million electric cars during that year, exceeding domestic demand by around 20%. These quantities demonstrate both the international reach of China's electric-vehicle industry and its growing dependence on overseas demand to absorb production. Manufacturing and Trade — International Energy Agency, May 2026. IEA
The distinction between Chinese-owned manufacturing and vehicles exported from China is increasingly important. Chinese manufacturers can respond to trade barriers through local assembly or manufacturing investment in destination markets. This may reduce tariff exposure and create employment in importing countries, but it does not necessarily transfer the full battery-to-vehicle value chain. A vehicle assembled in Europe using imported batteries, electrical systems and other major components may contribute less European technological value than its final assembly location suggests. Conversely, European manufacturers sourcing major components internationally may deliver competitive vehicles while remaining dependent on foreign industrial capabilities.
A rigorous localisation policy must therefore distinguish final assembly, local component manufacturing, domestic value added, technology ownership and strategic control. Requiring domestic assembly alone may encourage investment in factories without generating a proportionate increase in high-value engineering or component production. Requiring excessive local content can raise costs if domestic suppliers lack scale or technological maturity. The appropriate policy design depends on whether the objective is employment, security of supply, technological capability or consumer affordability, because those objectives may require different measures.
Comparative investment choices: when to internalise, outsource or establish joint ventures
The analysis of BYD, Volkswagen, Hyundai and Tesla suggests that corporate decisions should be based on the strategic significance of each component rather than ideological preferences for vertical integration or outsourcing. Internalisation is most attractive when a technology provides critical differentiation, external suppliers create significant bottlenecks, production volumes justify investment and the manufacturer can sustain competitive costs. Outsourcing is more attractive when specialist suppliers possess superior economies of scale, technology changes rapidly or demand is uncertain. Joint ventures and long-term partnerships can provide intermediate solutions, allowing manufacturers to obtain greater influence over technology and supply without assuming the entire capital burden.
For battery cells, direct manufacturing may be strategically justified where large recurring demand provides the necessary scale and where the manufacturer possesses or can acquire process expertise. However, building a cell factory is not equivalent to establishing a competitive battery industry. The IEA emphasises that reaching mature production efficiency can require several years and that access to active materials, manufacturing equipment and experienced personnel remains critical. Electric Vehicle Batteries — International Energy Agency, May 2026. IEA
For semiconductors, internal design capabilities may be important even where direct wafer fabrication is not economically justified. The capital intensity and technological specialisation of semiconductor production can make external foundry relationships more efficient than manufacturing every device within an automotive group. For electric motors, power electronics and thermal-management systems, the appropriate organisational boundary depends on design differentiation, supplier capabilities and product volumes. For software, control over architecture, integration and cybersecurity can be strategically important even when some development or infrastructure services are externally sourced.
| Industrial activity | Case for internalisation | Case for specialist outsourcing | Case for partnership or joint venture |
|---|---|---|---|
| Battery-cell design | Technology differentiation and system optimisation | Access to established chemistry and process expertise | Shared development and supply security |
| Battery-cell manufacturing | Large stable demand and manufacturing competence | Avoid high capital requirements and ramp-up risks | Shared investment and technical learning |
| Battery-management systems | Control over safety, integration and software | Specialist implementation and components | Shared development under OEM specifications |
| Power semiconductors | Strategic device design and qualification | Specialist fabrication economics | Long-term foundry and technology agreements |
| Electric motors and inverters | System-level optimisation | Competitive specialist component supply | Co-designed common platforms |
| Vehicle software architecture | Product differentiation and lifecycle control | Specialist tools and selected software modules | Controlled interfaces and shared development |
| Industrial robotics | Control over critical process integration | Access to specialist machinery suppliers | Joint engineering and long-term support |
| Final vehicle assembly | Product control, quality and market access | Contract manufacturing under suitable conditions | Localisation and market-entry partnerships |
The optimal arrangement may change as technology develops. A manufacturer may initially outsource an unfamiliar component, acquire expertise through a partnership and later internalise production once scale and technical competence justify the investment. Conversely, an internally manufactured component may become commercially unattractive if external suppliers achieve superior cost or performance. Industrial strategy must preserve the option to change organisational boundaries without incurring prohibitive financial losses.
The competitive implications for European investment allocation
European manufacturers face a difficult capital-allocation problem because they must finance new technologies while maintaining substantial existing operations. Investment in battery production, software architecture and automation competes with the need to maintain current factories, support established model ranges and meet regulatory requirements. A strategy that attempts to internalise every major emerging technology may exceed available financial resources or create unnecessary duplication across manufacturers. A strategy relying entirely on external supply may preserve near-term financial flexibility while weakening long-term technological control.
The most economically credible response is selective integration combined with stronger industrial coordination. Common battery platforms can reduce engineering fragmentation, while competitive external cell procurement can preserve flexibility during technology transitions. Shared software and electrical architectures can reduce development duplication. Advanced automation can improve the productivity of existing European factories, particularly where new equipment is accompanied by simplified product architectures. Partnerships with experienced cell and materials producers can accelerate manufacturing learning, although their contribution to technological sovereignty depends on the transfer and retention of actual engineering capability.
The opportunity for European specialist suppliers is significant. The transition towards electric vehicles creates new demand for machinery, industrial controls, power electronics, battery-production equipment, thermal-management technologies and factory software. However, suppliers must adapt to a market in which vehicle manufacturers increasingly seek integrated systems rather than large numbers of independently developed components. Businesses that depend heavily on conventional powertrain systems or small production runs may face pressure to consolidate or move into new technological activities.
The challenge is therefore both technological and organisational. Europe must decide which capabilities require domestic control, which can be developed through international partnerships and which should remain subject to competitive global procurement. It must also ensure that investments in new manufacturing capacity are supported by credible demand and commercially viable production processes. Public support cannot permanently compensate for low utilisation, poor manufacturing yields or excessive engineering complexity.
Final comparative net assessment
The evidence establishes that BYD represents a formidable competitor, but not that its industrial model is the only viable configuration for future automotive manufacturing. Volkswagen possesses enormous industrial scale and engineering capabilities but faces the costs of organisational complexity and technological transition. Hyundai demonstrates the potential resilience of a coordinated global production system with diversified powertrains and substantial manufacturing expertise. Tesla illustrates the benefits of concentrated electric-vehicle platforms while also demonstrating exposure to model concentration and fixed-cost absorption. BYD's potential strength is the ability to coordinate several strategically important stages of the electric-vehicle value chain within one corporate and industrial ecosystem.
No reliable public comparison presently establishes that Zhengzhou has a lower fully allocated manufacturing cost, shorter model-introduction period or higher return on invested capital than each of these competitors after controlling for product specifications and accounting boundaries. The strongest available evidence concerns China's broader battery and component advantages, the scale of its manufacturing ecosystem and the expansion of its automation base. These advantages are strategically important, but their transmission into individual factory economics must be demonstrated rather than assumed.
The most consequential conclusion for European industry is that the future competitive contest will be determined less by the absolute size of manufacturing estates than by the quality of industrial organisation. Manufacturers that combine affordable batteries, simplified architectures, effective automation, reliable suppliers and rapid engineering execution can remain competitive even without reproducing the geographical dimensions associated with Zhengzhou. Manufacturers that retain excessive complexity, underutilised assets and high component costs will remain exposed regardless of brand reputation or the scale of their historical investment.
Key judgments
BYD's integrated model is one credible response to the economics of electric-vehicle manufacturing, while Volkswagen, Hyundai and Tesla demonstrate alternative configurations with different advantages and vulnerabilities. Europe's industrial competitiveness will depend on adopting the most effective elements of these models rather than attempting to reproduce any one of them in full. The central priorities are competitive battery access, reduced platform complexity, flexible automation, stronger control over critical technologies and disciplined allocation of capital. Industrial organisation must ultimately be judged by sustained economic performance rather than physical scale or technological ambition.
What would change the assessment
Comparable model-level manufacturing costs, battery sourcing terms, production-line utilisation, product-development expenditure and capital returns would permit a more definitive ranking of manufacturing systems. Evidence that one configuration consistently produces superior quality-adjusted output and financial returns across several vehicle classes would strengthen the case for convergence towards that model. Conversely, continued success among manufacturers employing different production architectures would reinforce the conclusion that organisational adaptability matters more than any universal factory configuration.
Open official record
The most consequential missing evidence comprises internationally comparable vehicle-programme cost data, plant-level manufacturing capital, supplier purchasing conditions, model-development schedules, battery production yields and consistent operational measures for major production facilities. Until such information becomes available, conclusions regarding absolute manufacturing superiority must remain bounded by the documented differences in corporate structure, financial performance and industrial capabilities.
Pillar II — Consolidated Net Assessment
The evidence across productivity, automation and comparative corporate organisation supports a clear but qualified conclusion. BYD's industrial model has the potential to combine a structurally advantageous battery ecosystem with extensive manufacturing coordination, significant investment in technology and large production volumes. China's industrial environment amplifies these advantages through the scale of its battery and component industries, the rapid expansion of robotics and an established network of specialist suppliers. Nevertheless, the financial performance of individual manufacturers demonstrates that high volume and advanced technology do not guarantee attractive returns. Utilisation, commercial demand, price competition and capital intensity remain decisive.
For European manufacturers, the competitive gap should be understood as a combination of measurable battery-cost differences, unequal manufacturing maturity in selected emerging technologies, organisational complexity and the challenge of adapting established assets. It is not evidence that European labour or engineering is intrinsically uncompetitive. European industry retains substantial automation expertise, sophisticated manufacturing capabilities and internationally competitive specialist suppliers. The strategic task is to combine those strengths with simpler product architectures, more effective supplier coordination and investment programmes capable of producing measurable reductions in total manufacturing cost.
The economic significance of Zhengzhou will ultimately be determined by whether its integrated manufacturing system maintains superior performance when production growth slows, competition intensifies and the full capital cost of expansion is absorbed. Until plant-level results establish that outcome, the strongest defensible judgment is that Zhengzhou exemplifies a potentially important industrial-organisation model whose advantages are substantial in principle but contingent in magnitude.
PILLAR III — EUROPEAN ECONOMIC SECURITY AND INDUSTRIAL RESPONSE
Chapter 7. European Union Industrial Strategy and Battery Supply-Chain Sovereignty
Principal judgment: The European Union cannot respond effectively to BYD's industrial model by treating electric-vehicle manufacturing as an isolated competition between final assembly plants. Its economic-security challenge lies in the distribution of technological capabilities, productive assets and investment risks across the entire battery-to-vehicle value chain. Europe possesses a substantial automotive market, sophisticated engineering, leading industrial-equipment producers and considerable manufacturing expertise, but these strengths do not automatically secure competitive battery production or control over the materials and technologies essential to electrified transport. The appropriate industrial response must therefore distinguish between three separate objectives: maintaining commercially viable vehicle manufacturing in Europe, preserving control over strategically important technologies, and reducing exposure to concentrated foreign supply chains. Achieving one does not necessarily secure the other two. The European policy framework has evolved materially during 2025 and 2026, particularly through the automotive action plan, the Battery Booster, the Industrial Accelerator Act proposal and critical-raw-material measures. The central weakness is no longer the complete absence of policy instruments, but the difficulty of converting numerous initiatives into a coordinated industrial system capable of competing on cost, reliability and technological performance.
Europe's automotive transition is simultaneously a competitiveness problem and an economic-security problem
The European automotive industry's historical strength has rested on a combination of manufacturing scale, specialised engineering, established supplier relationships, technological development and access to international markets. Electrification has altered the distribution of industrial value and investment requirements without eliminating those underlying capabilities. The challenge for public authorities is that technological competitiveness cannot be restored through a single regulatory adjustment or financial incentive. A manufacturer facing expensive battery inputs, fragmented engineering platforms and weak production utilisation may remain uncompetitive even if consumer subsidies increase demand or tariffs raise the price of imported vehicles. Conversely, a manufacturer that reduces costs through imported batteries may improve its immediate commercial position while deepening Europe's dependence on external production capacity. The distinction is essential because industrial policy must evaluate the location and control of value creation, rather than merely the nationality of the brand appearing on a finished vehicle.
The International Energy Agency's 2026 assessment provides a particularly clear representation of the structural imbalance. At the end of 2025, China accounted for more than 80% of worldwide lithium-ion battery nameplate manufacturing capacity, while the European Union represented approximately 6–7%. China also accounted for approximately 85% of global cathode active-material production and more than 90% of anode active-material production used in electric-vehicle batteries. These figures describe different stages of production, but together they establish a concentration extending well beyond the final battery cell. The geographical asymmetry is compounded by the origin of the firms operating in the sector: the IEA reports that Chinese manufacturers accounted for more than half of the European Union's electric-car battery market in 2025, including cells produced locally and those imported from abroad. Global EV Outlook 2026: Electric Vehicle Batteries — International Energy Agency, May 2026; Global EV Outlook 2026: Manufacturing and Trade — International Energy Agency, May 2026.
This evidence demonstrates why the industrial nationality of a production facility is not equivalent to the location of technological control. A battery cell produced in Europe by a foreign-controlled manufacturer contributes to European manufacturing activity, employment and potentially supply resilience. However, decisions concerning intellectual property, production equipment, investment priorities, technology transfer and global capacity allocation may remain under the control of an enterprise headquartered elsewhere. The distinction does not make foreign investment undesirable; it means that a policy designed to strengthen European technological capabilities must examine the rights, knowledge and productive functions retained in Europe rather than considering domestic production sufficient by itself.
The converse is equally important. A European-controlled battery enterprise operating foreign facilities may retain valuable engineering and commercial capabilities within Europe while exposing its physical supply chains to international disruptions. Sovereignty is therefore not an absolute geographical condition but a portfolio of capabilities: the ability to design technologies, obtain essential inputs, manufacture competitively, substitute suppliers, maintain equipment, control critical information and recover from interruption. An economically credible European strategy must prioritise the capabilities whose loss would create the highest switching costs or most serious industrial disruption.
The regulatory sequence of 2025–2026: from sectoral rescue towards industrial-system coordination
The European Commission's Industrial Action Plan for the automotive sector, presented on 5 March 2025, established a policy framework addressing innovation, clean mobility, industrial competitiveness, supply chains, skills and the sector's regulatory environment. The subsequent Automotive Package, presented on 16 December 2025, developed this approach through proposed changes concerning vehicle emissions, support for battery manufacturing, administrative simplification and the decarbonisation of corporate vehicle fleets. The two initiatives must be distinguished: the first set out the Commission's broader industrial response, while the second introduced a more specific package of legislative proposals and financial measures. Announced objectives should not be confused with completed implementation or demonstrated industrial outcomes. Industrial Action Plan for the European Automotive Sector — European Commission, 5 March 2025; Automotive Package — European Commission, 16 December 2025.
The December 2025 package is significant because it attempts to reconcile industrial competitiveness with the decarbonisation framework. The Commission proposed greater flexibility in passenger-car and van emissions requirements, describing a framework under which manufacturers would face a 90% tailpipe-emissions reduction target from 2035, with the remaining component addressed through specified compensatory mechanisms. This was a Commission proposal, not proof that the previous legislative requirements had already been replaced. The legal distinction matters because manufacturers make investment decisions based on expected future compliance obligations, and prolonged uncertainty over the final rules can discourage capital expenditure or encourage companies to maintain several competing technological pathways simultaneously. A regulatory system intended to provide flexibility can inadvertently increase investment complexity if manufacturers cannot determine which requirements will ultimately apply. Automotive Package: For a Clean and Competitive Automotive Sector — European Commission, December 2025.
The Commission's Industrial Accelerator Act proposal of 4 March 2026 adds a further dimension. Proposed as COM(2026)100, it seeks to strengthen production in strategic sectors through targeted European-origin and low-carbon requirements, including provisions linked to public procurement and public support schemes. Automotive manufacturing is among the sectors addressed, alongside steel, cement, aluminium and selected clean technologies. The proposal also seeks to simplify industrial permitting and encourage investment that contributes to European production capabilities. As of the October 2026 analytical cut-off, the measure must be treated according to its legislative status rather than described as an automatically applicable system of compulsory domestic-content requirements. Industrial Accelerator Act, COM(2026)100 — European Commission, 4 March 2026; Commission Proposes Industrial Accelerator Act to Strengthen Industry and Create Jobs in Europe — European Commission, 4 March 2026.
These initiatives reveal a gradual movement from policies primarily concerned with emissions and the adoption of electric vehicles towards measures addressing the location, sustainability and technological content of industrial production. This shift is economically justified because the replacement of internal-combustion vehicles with electric vehicles does not necessarily preserve the existing European supply chain. New powertrain architectures can reduce demand for conventional components while increasing demand for battery materials, electronics and specialised equipment. Without a policy capable of supporting commercially viable investment in those activities, Europe could achieve substantial transport electrification while losing parts of its manufacturing value added.
The Battery Booster: industrial financing and the problem of commercial ramp-up
The Commission formally established the Battery Booster Facility on 9 June 2026, mobilising up to €1.5 billion from European Union Emissions Trading System revenues through the Innovation Fund. The instrument is designed to support battery-cell manufacturers during the difficult transition from construction and commissioning towards stable commercial production. Its principal financing mechanism is interest-free lending rather than an unconditional grant, with eligibility linked to battery technology suitable for electric vehicles and production facilities located within the European Economic Area. The published framework identifies a minimum production capacity of 10 GWh for eligible projects. New Battery Booster Set to Inject €1.5 Billion into the European Battery Industry — European Commission, 9 June 2026; Battery Booster Facility — European Commission, June 2026.
The design addresses a genuine industrial-financing problem. Battery-cell manufacturing involves capital-intensive equipment and process development, while early production frequently experiences lower yields, additional quality-control expenditure and incomplete capacity utilisation. Commercial lenders may be reluctant to provide sufficient financing during this period if the project has not yet demonstrated stable production economics. Public support can reduce financing pressure and allow technically credible projects to reach maturity. However, the intervention creates a policy risk if financing is used to sustain operations whose underlying costs, product specifications or demand prospects remain structurally uncompetitive. Interest-free debt reduces financing expenditure; it does not remove the need to repay capital or deliver commercially acceptable products.
The scale of the instrument must also be placed in perspective. At an illustrative industrial-investment requirement of €100 million per GWh of annual battery capacity, a hypothetical 20 GWh production project would require €2 billion of investment. This is not a verified European factory cost and excludes possible upstream investments, land, financing and other project-specific requirements. It illustrates why a €1.5 billion facility cannot be expected to finance an entire continent-wide battery industry. Its strategic value lies instead in improving the financing conditions of selected projects and mobilising additional private investment where the probability of successful industrialisation is credible. Public financing should therefore be concentrated on projects demonstrating process competence, commercially relevant technology, realistic customer commitments and a path towards competitive unit costs.
The broader Battery Booster strategy identifies a €1.8 billion support framework, including the €1.5 billion facility and additional measures addressing critical raw materials. The European Commission's competitiveness-coordination initiative also emphasises coordination of public and private investment across the battery value chain. Its published figures concerning potential additional GDP and employment effects are prospective policy estimates rather than realised economic benefits. They should not be presented as jobs or output already created. Battery Booster — European Commission, 2026.
| European policy instrument | Documented amount or benchmark | Legal or operational status at cut-off | Intended industrial effect | Principal execution risk |
|---|---|---|---|---|
| Automotive Industrial Action Plan | Sector-wide policy framework | Commission communication, March 2025 | Coordinate competitiveness and transition measures | Fragmented implementation |
| Automotive Package | Multiple legislative and support proposals | Commission package, December 2025 | Regulatory flexibility, battery support and demand measures | Legislative uncertainty and inconsistent investment signals |
| Battery Booster Facility | Up to €1.5 billion | Established June 2026 | Support competitive battery-cell ramp-up | Support for facilities that fail to reach economic scale |
| Wider Battery Booster measures | €1.8 billion framework | Announced coordination and support programme | Strengthen the European battery value chain | Incomplete coverage of upstream supply dependencies |
| Industrial Accelerator Act | COM(2026)100 | Legislative proposal, March 2026 | Strategic production, low-carbon demand and investment | Cost increases and legal implementation uncertainty |
| Critical Raw Materials Act | 2030 extraction, processing, recycling and diversification benchmarks | EU regulatory framework | Reduce strategic material dependencies | Project delays, financing and environmental constraints |
| EU Batteries Regulation | Sustainability, traceability and lifecycle obligations | Phased application under Regulation 2023/1542 | Transparency, durability and circularity | Compliance costs and implementation complexity |
Amounts and benchmarks refer to different policy functions and are not additive measures of total new investment. Sources: European Commission Automotive Package, Battery Booster Facility, Industrial Accelerator Act, and Critical Raw Materials Act.
Critical materials: the difference between owning battery factories and controlling supply
European battery sovereignty cannot be established by constructing cell-production facilities alone. The manufacturing process depends on refined lithium compounds, graphite and other anode materials, cathode precursors, processing chemicals, separators, electrolytes and specialised industrial equipment. The concentration of many intermediate activities in China means that a European factory may remain vulnerable to external supply interruptions even when its final cell-production stage is located within the Union. This is the central difference between manufacturing capacity and supply-chain resilience.
The Critical Raw Materials Act provides a legal and policy framework for addressing this exposure. Its 2030 benchmarks aim for European extraction capacity equivalent to at least 10% of annual consumption of strategic raw materials, processing capacity equivalent to at least 40%, and recycling capacity equivalent to at least 25%. The framework also seeks to prevent dependence on a single third country for more than 65% of Union consumption at the relevant processing stage. These are regulatory benchmarks and policy objectives, not evidence that Europe currently satisfies them. Their achievability depends on geological resources, investment, permitting, technical competence, environmental requirements and the availability of commercially viable projects. Critical Raw Materials Act — European Commission.
The targets should be interpreted as a diversification strategy rather than a programme for complete domestic self-sufficiency. Europe does not need to extract every mineral it consumes to obtain greater resilience. It needs sufficient alternatives, strategic inventories where justified, reliable international agreements and processing capabilities that prevent a single supplier from exercising disproportionate control. In batteries, this includes the capacity to manufacture high-quality cathode and anode materials and maintain technically validated alternative sources. It also requires attention to equipment and process knowledge, because material availability has little value if European firms cannot transform those materials into commercially competitive components.
Recycling offers an important long-term contribution, but it cannot immediately compensate for the shortage of domestically available battery materials. The IEA notes that many electric-vehicle batteries deployed in recent years remain in service and will not become available for recycling until later in the 2030s or beyond. The mismatch between rapidly expanding battery production and the delayed availability of end-of-life cells means that recycling facilities cannot rely exclusively on retired vehicle batteries during the initial industrial expansion. Production scrap can provide feedstock, but its availability depends on cell-manufacturing volumes and process yields. Consequently, recycling should be integrated into industrial strategy without assuming that future circular-material flows are already sufficient to support current production requirements. Electric Vehicle Batteries — International Energy Agency, May 2026.
Technological sovereignty and the risk of becoming an assembly economy
The most serious long-term industrial-security risk is not necessarily the complete disappearance of European vehicle production. A more plausible vulnerability is the progressive concentration of high-value components and process knowledge outside Europe while domestic facilities retain final assembly and selected engineering functions. Under such a configuration, Europe could continue producing substantial numbers of vehicles, yet lose influence over battery chemistry, manufacturing equipment, critical electronics and future technology standards. This distinction matters because assembly output can remain visible in industrial statistics even as the domestic share of technological value declines.
A manufacturing strategy centred on final vehicle localisation may therefore produce misleading results. A locally assembled vehicle incorporating imported cells, imported power electronics and foreign-controlled software can generate employment and satisfy certain commercial objectives without creating the same technological capabilities as a production system controlling those inputs. Conversely, purchasing foreign components can be economically rational when it provides access to superior technology or significantly lowers costs. The strategic objective should not be the elimination of imports, but the prevention of dependencies that cannot be managed or substituted at acceptable cost.
The European Union's policy architecture should consequently distinguish commercially efficient imports from strategically critical dependencies. Components whose supply can be diversified across several competitive jurisdictions do not necessarily justify expensive domestic duplication. Technologies whose loss would prevent production, compromise safety or eliminate future engineering capability may warrant targeted investment despite initially higher costs. The appropriate decision requires a component-level assessment of technological concentration, substitutability, switching time, stockholding feasibility and the importance of the underlying knowledge to future industrial development.
Key judgments
The European Union has developed a more substantial framework for automotive and battery industrial policy during 2025–2026, but its effectiveness will depend on implementation and commercial performance. Battery-cell manufacturing, critical materials, industrial automation and technology ownership must be coordinated rather than addressed through disconnected programmes. The greatest policy risk is the creation of nominal capacity without competitive output, followed by pressure for continuing public financial support. The strongest strategic opportunity is to establish commercially viable European capabilities at the points where external concentration creates the greatest economic-security exposure.
What would change the assessment
Evidence that European battery facilities are reaching stable commercial yields, securing diversified material supplies and winning contracts without permanent operating support would materially strengthen the case for industrial recovery. Conversely, repeated cancellations, underutilised publicly supported projects, continuing dependence on single-source materials or the migration of battery engineering capability outside Europe would weaken the expectation that the current policy framework can deliver technological sovereignty.
Open official record
The consequential missing evidence concerns the actual disbursement and performance of Battery Booster-supported projects, the commercial operating status of European battery facilities, the origin and ownership of critical battery technologies, and the extent to which announced raw-material projects are progressing through financing, permitting, construction and production.
Chapter 8. Germany, France, Italy and the United Kingdom: Distinct Exposures and National Responses
Principal judgment: The competitive challenge posed by Chinese integrated automotive manufacturing is not uniform across Europe's major industrial economies. Germany faces the largest direct exposure among the four countries considered because of the scale of its vehicle manufacturing, global brands, engineering infrastructure and supplier network. France's central challenge is to convert battery and electric-vehicle investment into commercially competitive domestic production while preserving affordable mass-market mobility. Italy faces a particularly acute problem of declining vehicle assembly volumes combined with the need to reposition its extensive specialist component and machinery industries. The United Kingdom must secure sufficient investment and battery capacity to maintain its manufacturing base while operating outside the European Union's industrial and trade-policy framework. These differences make a single national policy template inappropriate. They also create a strong case for European-level coordination, since the most economically efficient industrial response may distribute different production functions among countries rather than attempt to reproduce complete battery-to-vehicle supply chains within every national border.
A comparable production baseline: different national trajectories within one European industry
The 2025 international passenger-car production series published by Germany's automotive industry association, the VDA, illustrates the differences between national industrial positions. It reports approximately 4.149 million passenger cars manufactured in Germany, 1.062 million in France and 237,849 in Italy. These figures represent passenger-car production and therefore exclude certain commercial-vehicle activities. They also should not be combined indiscriminately with national statistics using different vehicle categories or reporting methodologies. The VDA series records 905,117 vehicles for the United Kingdom in 2025, while the British Society of Motor Manufacturers and Traders reports 717,371 passenger cars and 47,344 commercial vehicles, or 764,715 total vehicles. The divergence is material and unresolved on the basis of the published definitions examined here; the UK national series is therefore used for UK-specific industrial analysis rather than silently substituting one number for the other. Automobile Production: National and International Annual Figures — German Association of the Automotive Industry, updated February 2026; Tough Year for Auto but New Models and Industrial Strategy Can Deliver Growth — Society of Motor Manufacturers and Traders, 29 January 2026.
| Country | 2025 reference production | Year-on-year change | Source and scope | Principal competitive issue |
|---|---|---|---|---|
| Germany | 4,148,836 passenger cars | Approximately +2% | VDA international production series | Managing high-volume technological transition and supplier exposure |
| France | 1,061,700 passenger cars | Approximately +17% | VDA international production series | Converting industrial investment into competitive electric vehicles |
| Italy | 237,849 passenger cars | Approximately −23% | VDA international production series | Rebuilding assembly volumes and repositioning suppliers |
| United Kingdom | 717,371 cars; 764,715 total vehicles | Cars −8%; total vehicles −15.5% | SMMT domestic production series | Investment, supply-chain localisation and manufacturing resilience |
The table does not provide a complete measure of each country's automotive economy. Germany's international manufacturers operate substantial foreign production facilities, while Italy's specialist suppliers can generate industrial value without corresponding domestic final-assembly volumes. French automotive groups operate extensive international manufacturing networks, and British vehicle production depends significantly on the investment strategies of internationally owned manufacturers. Nevertheless, production figures matter because assembly plants create recurring demand for local components, logistics, maintenance, technical services and industrial skills. Sustained volume reductions can weaken supplier economics even when certain high-value engineering functions remain competitive.
The relationship between vehicle output and national industrial strength must also be assessed over time. Germany's large production base gives its manufacturers substantial resources and supplier relationships but creates significant exposure when established vehicle architectures lose market share. France's growth in 2025 illustrates that domestic production can recover, although a single year does not prove lasting competitiveness. Italy's contraction increases the urgency of industrial adjustment because reduced production volume can undermine the economics of specialised suppliers whose facilities were designed around larger domestic output. Britain's experience demonstrates the vulnerability of national production to company-specific disruptions, trade conditions and changes in investment allocation.
Germany: the greatest industrial exposure, but also the strongest existing manufacturing base
Germany's central challenge is to adapt one of the world's most sophisticated automotive manufacturing systems to a competitive environment in which battery economics, software architecture and production flexibility have become more important. The country's established strengths include large-scale automotive engineering, machinery, industrial controls, premium vehicle development and an extensive network of specialist suppliers. These capabilities constitute substantial competitive assets, but they were developed around technologies and business models that cannot all be transferred directly to electric vehicles.
The VDA's production figures show that Germany remained a major global vehicle-manufacturing location in 2025, producing approximately 4.15 million passenger cars. This domestic industrial base supports employment, exports, supplier investment and manufacturing knowledge. Its scale also means that changes in production technology have far-reaching economic consequences. The decline in demand for certain combustion-engine components affects suppliers specialising in fuel systems, exhaust treatment, transmissions and related mechanical technologies, even where the final vehicle manufacturer remains commercially successful. Electric vehicles create new demand for battery modules, thermal management, electrical systems and software, but the transition between these industrial activities does not automatically preserve the same employment structure or regional distribution of production. Automobile Production — VDA, February 2026.
Germany's domestic electric-vehicle market provides an important counterweight to concerns about industrial decline. The Federal Ministry for Economic Affairs reported that battery-electric passenger cars accounted for 19.1% of new German registrations in 2025, with 545,142 units registered, an increase of 43.2% over 2024. The ministry also reported that German brands achieved a 63% share of the domestic battery-electric market. These figures do not eliminate the threat from Chinese manufacturers, but they demonstrate that established German producers retain substantial commercial capabilities in electric vehicles. The question is whether they can translate this position into globally competitive manufacturing economics, particularly in affordable and mid-market segments where battery costs constitute a critical constraint. Great Prospects for Electric Mobility — German Federal Ministry for Economic Affairs, 2026.
Germany's greatest structural challenge is the financial burden of simultaneous industrial systems. Established manufacturers must maintain conventional vehicle production while financing batteries, software, electronics and new assembly technologies. A factory designed for combustion-engine vehicles may require significant modifications to manufacture electric vehicles efficiently. Existing supplier contracts, workforce arrangements and equipment investment can reduce the speed with which manufacturers alter production architecture. These constraints should not be interpreted as evidence of inadequate engineering competence; they are consequences of transforming a large capital-intensive industry while continuing to serve existing markets.
The development of PowerCo's battery manufacturing capabilities demonstrates one response. Volkswagen's December 2025 announcement of initial Unified Cell production at Salzgitter represented progress towards internal European battery manufacturing, but successful commissioning does not establish commercially mature production economics. Germany's policy challenge is to help such investments reach competitive yields and reliable production while avoiding the assumption that domestic manufacture alone guarantees cost parity with Asian suppliers. Public support should be linked to demonstrable industrial outcomes: output, product quality, customer commitments, cost reduction and the development of transferable manufacturing knowledge. PowerCo Commissions Salzgitter Gigafactory — Volkswagen Group, 17 December 2025.
Germany should not attempt to preserve every existing component activity in its present form. Its strongest long-term response is likely to involve concentrating investment in competitive vehicle platforms, battery technologies, power electronics, industrial equipment and software capabilities while supporting the transition of suppliers exposed to declining conventional powertrain demand. The country possesses substantial opportunities to use its automation and engineering industries to reduce manufacturing costs, but those opportunities depend on coordinated product simplification and investment discipline. Increasing the sophistication of production machinery without reducing unnecessary engineering complexity would yield only limited benefits.
The German federal and regional policy framework also faces coordination challenges. Industrial investment is influenced by national regulation, regional infrastructure, energy markets, European Union rules and the decisions of internationally operating manufacturers. Incentives that encourage competing battery projects without sufficient demand could increase underutilised capacity. A more durable strategy would support a smaller number of commercially credible production ecosystems capable of serving multiple manufacturers, while preserving competition and avoiding excessive dependence on individual companies.
France: maintaining affordable mass-market manufacturing while building an integrated battery industry
France's automotive challenge differs from Germany's because its industrial priorities include maintaining accessible vehicle prices, developing competitive electric-vehicle manufacturing and supporting the establishment of a domestic battery industry. Its industrial strengths include established vehicle manufacturers, engineering capabilities, public-sector coordination and access to the wider European market. However, the viability of domestic production depends on the ability to manufacture vehicles at costs compatible with consumer demand rather than relying indefinitely on price premiums or purchasing incentives.
The VDA's international production series records approximately 1.062 million passenger cars manufactured in France in 2025, an increase of roughly 17% from 2024. This represents a meaningful improvement in domestic output, although the figure alone does not establish the profitability of the plants involved or the extent to which production growth was driven by new models, recovery from earlier disruptions or investment decisions. The strategic priority is to convert higher production volumes into sustained manufacturing competitiveness, including the ability to serve lower-priced electric-vehicle segments. Automobile Production — VDA, February 2026.
France's industrial-policy choices are closely linked to the economics of battery supply. Domestic battery manufacturing can strengthen employment, supply security and technical capability, but the financial risk is substantial when factories must compete with mature Asian production at lower costs. The International Energy Agency's finding that European battery manufacturing can face significant cost disadvantages before support is particularly important for France because the country's strategy depends on establishing industrial activities whose profitability may require several years of manufacturing learning. Initial public support may be justified where commercially realistic projects generate skills and technology spillovers, but such support must be accompanied by clear milestones for production yields, pricing and customer demand. Electric Vehicle Batteries — International Energy Agency, May 2026.
France also has an opportunity to use product architecture and manufacturing specialisation to strengthen its position. Affordable electric vehicles require engineering decisions that minimise material intensity, component complexity and manufacturing labour without compromising safety and essential performance. Battery capacity should be matched to consumer requirements rather than increased indiscriminately, because excessively large packs raise vehicle cost and resource demand. A domestic production strategy centred on well-defined market segments can therefore be more credible than attempting to compete across every vehicle category simultaneously.
The relationship between French vehicle producers and battery suppliers is especially important. Vehicle manufacturers need secure access to competitive cells, but battery projects require customers willing to commit to substantial future volumes. Long-term offtake agreements can reduce financing uncertainty, although they may expose manufacturers to unfavourable prices if the technology becomes less competitive. Contract structures should allow appropriate adjustment for improvements in chemistry, manufacturing efficiency and material prices while protecting the investment required to establish domestic production.
France's policy challenge is consequently to reconcile strategic ambition with market discipline. It must support enough upstream capability to reduce structural dependence while ensuring that local-content objectives do not make its vehicles prohibitively expensive. European cooperation is essential because France alone cannot efficiently reproduce every stage of the global battery supply chain. Its most credible position is as part of a continental production system combining competitive cells, vehicle engineering, advanced manufacturing and diversified materials sourcing.
Italy: declining vehicle production and the strategic repositioning of a specialist industrial economy
Italy presents the most acute mismatch among the four countries between its broad industrial capabilities and the recent performance of domestic passenger-car production. The VDA series records 237,849 passenger cars manufactured in Italy in 2025, down approximately 23% from 309,758 in 2024. These figures concern passenger cars rather than all motor vehicles, but they reveal a substantial contraction in the domestic assembly base. The implication extends beyond final assembly because many suppliers depend on stable production programmes, predictable engineering orders and sufficient scale to justify machinery investment. Automobile Production — VDA, February 2026.
Italy's industrial exposure is frequently underestimated when analysis focuses exclusively on finished vehicles. Its automotive economy includes component manufacturers, machine-tool producers, metalworking firms, automation specialists, engineering services, precision equipment and materials-processing businesses. These capabilities can remain internationally relevant even when domestic assembly volumes fall, but they require access to competitive vehicle platforms and new technological markets. The transition to electrification changes demand for traditional mechanical components while creating opportunities in power electronics, thermal systems, industrial equipment, battery-production machinery and advanced manufacturing. The strategic problem is that not every incumbent supplier possesses the financial resources or technical capability to reposition quickly.
The Ministry of Enterprises and Made in Italy's policy response includes targeted measures for the automotive supply chain. On 7 September 2026, the ministry announced €300 million for automotive-related investment through mini development contracts. The programme was designed to support new vehicles, low-emission propulsion technologies, advanced components, connected and autonomous mobility systems, industrial diversification and related research and training. The ministry specified that 60% of the resources would be reserved for projects proposed by small and medium-sized enterprises, including a specific allocation for micro and small firms, while 40% would be directed towards programmes in southern Italian regions. Eligible support could combine grants and subsidised financing, potentially covering up to 75% of eligible expenditure under the applicable conditions. Automotive: €300 Million for the Supply Chain Through Mini Development Contracts — Ministry of Enterprises and Made in Italy, 7 September 2026.
The programme addresses an important weakness: smaller suppliers frequently face difficulty financing the transition from established products to new technologies before receiving firm customer commitments. Nevertheless, financial assistance alone cannot guarantee successful industrial repositioning. A component manufacturer may acquire new machinery but remain unable to compete if its products are not incorporated into major vehicle platforms or if its customers face persistent production declines. Support should therefore be linked to validated technical capabilities, credible customer programmes, export diversification and measurable productivity improvements.
Italy's industrial-policy opportunity is broader than the preservation of traditional automotive assembly. The country can develop a stronger position in equipment and components used by advanced electric-vehicle manufacturing systems, including automation, precision handling, quality inspection and industrial process engineering. These activities can supply European and international customers, reducing dependence on the success of a single domestic automaker. However, participation in internationally competitive supply chains requires technical certification, investment in research and development, digital integration and the capacity to manufacture at consistent quality and cost.
A further challenge concerns the geographical concentration of supplier investment. Different Italian industrial districts possess distinct capabilities in machinery, metalworking, electronics, automotive engineering and industrial services. A national strategy that spreads limited resources across too many disconnected projects may fail to achieve the minimum scale required for commercially sustainable production. More effective coordination would identify complementary capabilities and support integrated projects involving manufacturers, research institutions and industrial customers. The objective should be to create commercially viable technological specialisations rather than reproduce every stage of the battery-to-vehicle chain within Italy.
The Italian case also illustrates the importance of distinguishing industrial employment protection from technological renewal. Maintaining production in an existing facility may preserve jobs temporarily, but it does not ensure competitiveness if the products manufactured are losing market relevance. Conversely, investment in new technology may initially require fewer workers while supporting higher-value employment over the longer term. Public policy must therefore combine investment support with technical training, supplier diversification and credible pathways for workers whose existing skills are tied to declining production activities.
United Kingdom: investment attraction, battery capacity and the constraints of a separate policy framework
The United Kingdom faces a distinctive industrial challenge because it operates outside the European Union while remaining closely connected to European vehicle markets and manufacturing supply chains. Its automotive economy includes internationally owned assembly plants, specialist engineering companies, premium manufacturers and suppliers operating across several countries. Investment decisions are therefore particularly sensitive to the terms of market access, the availability of competitive batteries, the cost of energy and labour, and the credibility of long-term government policy.
The Society of Motor Manufacturers and Traders reported that UK factories produced 764,715 vehicles in 2025, comprising 717,371 passenger cars and 47,344 commercial vehicles. Total production fell by 15.5% from 2024. The SMMT identified several contributing factors, including a cyber incident affecting a major manufacturer, trade uncertainty, commercial-vehicle factory consolidation and restructuring associated with the transition to electrification. The figures demonstrate that national manufacturing performance can be materially affected by operational and company-specific disruptions as well as by long-term market conditions. Tough Year for Auto but New Models and Industrial Strategy Can Deliver Growth — Society of Motor Manufacturers and Traders, 29 January 2026.
The British government's principal automotive industrial-support programme is DRIVE35, which was launched in 2025 with £2.5 billion of announced funding and subsequently increased to £4 billion through 2035. This revision is important: the earlier £2.5 billion figure is no longer the complete current programme envelope. Updated government guidance published in August 2026 identifies support for research, industrial scale-up and manufacturing transformation, including batteries, vehicle assembly, electric motors, power electronics, upstream supply chains and recycling. The programme combines the development of new technologies with measures intended to attract capital investment and support domestic industrialisation. DRIVE35 Funding Programme — UK Department for Business and Trade, updated 10 August 2026; DRIVE35 Transformation Funding — UK Government, updated August 2026.
The British strategy has several potentially important advantages. It can target investment towards technologies and facilities most relevant to its manufacturing base, while using public funding to support projects that might otherwise locate elsewhere. Its research institutions and engineering companies provide opportunities in advanced propulsion, battery development, electronics and manufacturing technologies. The flexibility of its national policy framework may also permit targeted interventions, although compatibility with trade agreements and the costs of regulatory divergence remain important constraints.
Battery supply is among the most significant issues because British vehicle manufacturers require reliable and competitively priced cells, while the economics of domestic battery production depend on sufficient demand from nearby manufacturers. A battery factory built without secure customers can experience substantial underutilisation; a vehicle factory relying entirely on imported batteries may face higher logistics costs and exposure to trade-rule changes. The UK's policy objective should therefore be to align vehicle-production commitments, battery investment, energy infrastructure and supplier development rather than evaluate each project separately.
The country's position outside the European Union creates both commercial exposure and policy complexity. Automotive supply chains may cross the UK–EU border several times during manufacturing, making customs rules, origin requirements and administrative costs commercially important. Investment intended to satisfy domestic-content requirements in one market may not automatically satisfy those applicable in another. A successful British automotive strategy therefore requires close attention to the practical terms of market access and internationally competitive production costs, rather than assuming that domestic assembly alone secures the industry's export position.
Four national strategies: the consequences for European industrial coordination
The differences between Germany, France, Italy and the United Kingdom imply that industrial coordination should operate through complementary capabilities rather than national duplication. Germany possesses the scale and engineering depth to support large vehicle platforms and sophisticated manufacturing systems. France has opportunities in competitive mass-market electric vehicles and battery industrialisation. Italy can strengthen specialist component and manufacturing-equipment capabilities while addressing its declining assembly base. The United Kingdom can use targeted investment and research support to retain high-value manufacturing and attract new industrial projects.
The danger is that each government attempts to reproduce every emerging automotive technology through its own incentive schemes, creating excessive capacity, fragmented standards and competition for a limited pool of skilled workers and commercial orders. Such an outcome could weaken Europe's collective position despite substantial public expenditure. A more effective framework would identify technologies requiring continental scale, facilitate cross-border investment and allow specialist suppliers to operate across several vehicle programmes.
| National priority | Germany | France | Italy | United Kingdom |
|---|---|---|---|---|
| Principal industrial exposure | High-volume vehicle groups and advanced suppliers | Mass-market vehicle competitiveness and battery industrialisation | Declining assembly and supplier transition | Assembly investment and trade-linked supply chains |
| Immediate operating priority | Reduce complexity and improve productivity | Competitive vehicle and battery costs | Stabilise commercially viable production and diversify suppliers | Secure production programmes and investment |
| Strategic technological priority | Batteries, software, power electronics, automation | Battery processes, affordable EV architectures, components | Machinery, automation, advanced components, electronics | Batteries, advanced propulsion, engineering and scale-up |
| Main public-policy instrument | EU and national industrial measures | EU and national industrial measures | Automotive Fund and targeted supply-chain support | DRIVE35, updated to £4 billion |
| Principal investment risk | Duplicated platforms and transition expenditure | Battery ramp-up and consumer affordability | Small projects without sufficient customer demand | Investment volatility and market-access constraints |
| Preferred coordination model | Continental platform and supplier integration | EU battery and vehicle value-chain partnerships | Multi-customer technology and supplier projects | Cross-border sourcing and investment agreements |
The European Union's institutional response must account for the fact that the United Kingdom is not an EU member and does not automatically participate in Union industrial programmes or regulatory measures on the same basis as member states. Germany, France and Italy operate within the Union's common trade policy and internal-market framework, while the UK has separate instruments and obligations. This creates an additional coordination challenge for automotive manufacturers whose supply chains cross both jurisdictions.
Key judgments
The four national economies face related but materially different industrial risks. Germany has the most extensive automotive production base among them and must transform a large established industrial system. France's principal opportunity lies in combining domestic electric-vehicle production with commercially competitive batteries. Italy requires a coordinated response to declining assembly and a stronger technological position for its specialist suppliers. The United Kingdom must reconcile investment attraction, battery localisation and export competitiveness under a separate regulatory framework. None of these challenges can be solved by replicating Zhengzhou's physical industrial model; each requires a strategy based on existing capabilities, credible demand and economically sustainable investment.
What would change the assessment
Material changes in factory allocation, battery-plant operating performance, domestic vehicle output, export competitiveness and programme funding would alter the relative national outlook. Sustained growth in commercially viable electric-vehicle manufacturing, particularly where supported by domestic engineering and component capabilities, would strengthen the case for successful industrial transition. Continued production decline, cancellation of major investment programmes or increasing reliance on imported high-value components would signal weakening industrial resilience.
Open official record
The most consequential gaps are comparable domestic value-added statistics for electric vehicles, actual battery-production yields and costs, manufacturer investment commitments by country, supplier transition outcomes and independently verified assessments of public-support effectiveness.
Chapter 9. Trade Defence, Localisation, Employment and Strategic Autonomy
Principal judgment: Trade defence can address established unfair subsidisation and reduce some immediate competitive pressure on European automotive manufacturers, but it cannot by itself restore industrial productivity, create battery technologies or reverse supplier dependence. Localisation requirements can direct investment towards Europe, yet their effectiveness depends on which manufacturing stages are established locally, whether those activities become economically competitive and how the measures affect consumer prices. The strategic objective should therefore be to use trade instruments, industrial incentives and regulatory requirements as complementary mechanisms, each designed for a distinct market failure. Europe should defend competition where evidence establishes unfair practices, but avoid using protection as a substitute for manufacturing reform. Its industrial-security interest lies in retaining the capabilities needed to design, manufacture, maintain and adapt strategically important technologies, not in eliminating international trade.
The EU countervailing-duty regime: legal purpose and economic transmission
The European Commission imposed definitive countervailing duties on imports of certain new battery-electric passenger vehicles originating in China through Commission Implementing Regulation (EU) 2024/2754 of 29 October 2024. The instrument followed an anti-subsidy investigation and established company-specific additional duties intended to counteract subsidisation found to be causing injury to the Union industry. The rates are applied to the relevant net free-at-Union-frontier price before duty and are additional to ordinary customs duties. Their legal function is not to equalise every difference in labour costs, manufacturing productivity or industrial scale between China and Europe. They address the subsidisation established through the investigation and the corresponding injury findings under the applicable trade-defence framework. Commission Implementing Regulation (EU) 2024/2754 — European Commission, 29 October 2024, consolidated version February 2026.
The differentiated duty structure is significant because it demonstrates that EU trade defence does not treat all vehicles originating in China as economically or legally identical. The definitive rates include an additional 17.0% for the BYD group, 18.8% for Geely, 35.3% for SAIC and 7.8% for Tesla's Shanghai operation, with separate rates for other cooperating and non-cooperating producers. These are rates under the countervailing regime and should not be described as total import tariffs. They also should not be interpreted as a ranking of manufacturing efficiency. The applicable rates depend on the legal investigation and the companies' circumstances, rather than the physical scale or productive sophistication of their factories. Commission Implementing Regulation (EU) 2024/2754 — European Commission, consolidated February 2026.
| Producer category | Additional countervailing-duty rate | Legal interpretation |
|---|---|---|
| BYD group | 17.0% | Company-specific definitive rate |
| Geely group | 18.8% | Company-specific definitive rate |
| SAIC group | 35.3% | Company-specific definitive rate |
| Tesla Shanghai | 7.8% | Individually established rate |
| Other cooperating producers covered by the relevant category | 20.7% | Applicable cooperating-producer category |
| Other non-cooperating producers | 35.3% | Residual non-cooperating rate |
Rates concern covered battery-electric vehicles originating in China. Product scope, customs documentation, company identity, amendments and applicable customs treatment must be checked for actual import transactions. Source: Commission Implementing Regulation (EU) 2024/2754 — Consolidated Legal Text.
The economic effect of these duties depends on who absorbs the additional cost. A manufacturer or importer may increase the consumer price, reduce its commercial margin, change vehicle specifications, alter distribution expenditure or reorganise production. A tariff does not automatically increase the final retail price by the same percentage as the customs duty because the customs value is only one component of the retail price and because firms may adjust their pricing strategies. The duty can protect the competitive position of European producers by increasing the cost of certain imports, but it may also reduce consumer access to lower-priced vehicles or slow electric-vehicle adoption if alternative products remain more expensive.
Consider a vehicle with a hypothetical customs value of €20,000. An additional countervailing duty of 17% would represent €3,400 before accounting for other taxes and charges. If the ordinary customs duty were 10%, a simplified additive calculation on the same customs base would produce combined duties of €5,400. This is not a retail-price forecast and excludes the effects of customs valuation details, VAT, transport, distribution and commercial pricing. The example illustrates the potential significance of the measure while preserving the distinction between the legal duty base and the consumer transaction.
| Hypothetical import customs value | 10% ordinary duty | 17% additional countervailing duty | Combined amount on unchanged base |
|---|---|---|---|
| €15,000 | €1,500 | €2,550 | €4,050 |
| €20,000 | €2,000 | €3,400 | €5,400 |
| €25,000 | €2,500 | €4,250 | €6,750 |
| €30,000 | €3,000 | €5,100 | €8,100 |
Illustrative calculation using an assumed 10% ordinary customs-duty rate and the BYD-specific additional 17% countervailing rate. The illustration is not an assertion about every applicable customs classification or individual import transaction.
The tariff's effectiveness must therefore be assessed against its policy objective. If the objective is to counteract injurious subsidisation, the appropriate evaluation concerns whether the measure addresses the established trade distortion. If the objective is to preserve European manufacturing, the analysis must also examine investment, production volumes and employment. If the objective is technological sovereignty, the analysis must consider whether domestic producers acquire competitive battery, electronics and software capabilities. These are different outcomes, and success in one does not establish success in the others.
The geographical relocation problem: when production moves but dependency remains
A predictable response to import restrictions is the localisation of production within the destination market. Manufacturers may establish assembly plants, acquire existing facilities or enter partnerships with domestic companies to reduce exposure to import duties and serve local customers more directly. Such investment can create employment, demand for industrial services and additional manufacturing activity. Nevertheless, its contribution to technological sovereignty depends on whether high-value components, engineering functions and production knowledge are also located in Europe.
An electric vehicle assembled in the European Union using imported battery cells, power electronics and other major components may satisfy a narrow interpretation of domestic manufacturing while remaining dependent on external industrial systems. The vehicle's commercial competitiveness can be improved through local assembly, but the strategic value of the investment may remain limited if the manufacturer does not develop a substantial European supplier base or technical workforce. Conversely, the localisation of battery production without competitive upstream materials may reduce some supply risks while leaving others unchanged.
The resulting policy challenge is to define local industrial contribution without creating requirements so rigid that they undermine the commercial viability of production. A local-content measure based entirely on the percentage of domestic expenditure can encourage firms to increase local purchasing even when the resulting products are more expensive or technically inferior. A measure based on final assembly alone may be too weak to support strategic components. A more discriminating approach would identify priority technologies, measure actual domestic value added and assess the location of engineering and manufacturing capabilities, while allowing internationally sourced inputs where they are essential to competitiveness or diversification.
The European Commission's proposed Industrial Accelerator Act reflects this broader debate by considering targeted European-origin and low-carbon requirements linked to public procurement and support schemes. However, the proposal must be distinguished from operative law. Its final implications depend on legislative negotiation, adopted provisions and implementation. Industrial Accelerator Act, COM(2026)100 — European Commission, March 2026.
Consumer prices, welfare and the trade-off between industrial resilience and affordability
Automotive trade policy involves an unavoidable distributional problem. Producers benefit when unfair competition is corrected or when policy support helps them establish competitive operations. Consumers may benefit from cheaper imports, particularly in price-sensitive segments where the cost of an electric vehicle remains a barrier to adoption. Public authorities must consider both effects rather than assuming that every measure strengthening domestic production automatically improves overall welfare.
An intervention that raises the cost of imported electric vehicles may support domestic manufacturing but also reduce consumer choice and purchasing power. The effect is likely to be particularly important in lower-priced segments, where a relatively small absolute price increase can represent a large proportion of household expenditure. If domestic manufacturers use the additional protection to improve productivity and reduce costs, the trade-off may become more favourable over time. If protection merely permits producers to maintain expensive operating structures, consumers may face higher prices without receiving a durable industrial benefit.
The corresponding policy objective should be temporary and conditional support where it is intended to facilitate industrial transition, accompanied by continued competition and measurable productivity improvement. This does not mean that every trade-defence instrument should expire according to an arbitrary industrial deadline. Measures addressing established unfair trade practices operate under their own legal requirements. It means that industrial subsidies and localisation incentives should not become permanent substitutes for commercially sustainable production.
Employment protection and the transformation of automotive work
The automotive industry's employment exposure is substantial because vehicle manufacturing supports direct assembly jobs and a wide range of suppliers, technical services, logistics companies and research activities. Electrification changes the content and location of these jobs. Activities associated with combustion engines and exhaust systems may decline, while demand increases for electronics, battery production, software, industrial automation and electrical engineering. The transition does not guarantee that new employment will emerge in the same regions or require the same skills as the jobs displaced.
The European Commission's automotive action plan identifies the sector's extensive direct and indirect employment contribution and recognises the need for skills adaptation alongside industrial investment. This is important because a policy designed exclusively to maintain existing headcounts may discourage the adoption of productivity-enhancing technology, while an investment strategy that ignores employment adjustment may create substantial social and political resistance. The policy challenge is to manage the transition between occupational structures without preventing manufacturers from adopting more competitive production methods. Industrial Action Plan for the European Automotive Sector — European Commission, March 2025.
The employment implications of automation require particular care. A factory that reduces direct assembly labour hours can improve its competitiveness while creating demand for specialists in controls, robotics, software, maintenance and quality systems. However, the new jobs may be fewer in number, geographically concentrated or inaccessible to workers without appropriate training. Public policy should therefore evaluate employment quality, wage development, retraining outcomes and the sustainability of the underlying business rather than counting only jobs announced during the investment phase.
Subsidy agreements can incorporate obligations concerning training, technical capability and employment outcomes, but such conditions must remain compatible with the economics of the investment. Requiring a highly automated manufacturing facility to maintain an inefficient labour structure would undermine the purpose of productivity support. A more effective approach would help affected workers acquire skills relevant to new manufacturing activities and support industrial diversification in regions where traditional automotive production is declining.
Battery regulation as a tool of industrial transparency
The EU Batteries Regulation establishes requirements concerning sustainability, safety, labelling, information, battery lifecycle management and supply-chain due diligence. Its strategic importance extends beyond environmental protection because traceability and technical documentation can improve visibility into the origin and characteristics of battery products entering the European market. The regulation's provisions apply according to a phased timetable, and obligations must be assessed using the applicable consolidated text. In particular, the battery due-diligence obligations are scheduled to apply from 18 August 2027 under the amended framework, rather than being treated as fully operational in October 2026. Regulation (EU) 2023/1542 on Batteries and Waste Batteries — European Parliament and Council, consolidated 13 August 2026.
A well-designed traceability system can help manufacturers and regulators identify supply concentrations, assess compliance and manage product risks. However, reporting requirements also create costs, particularly for smaller suppliers operating through complex international value chains. The economic value of the system depends on the availability of reliable information and the ability to use it for industrial decisions rather than merely generating administrative documentation. Requirements that are difficult to implement or lack interoperable technical standards may burden European producers without materially improving supply security.
The potential strategic benefit is greatest when traceability is integrated with procurement and industrial-risk management. A manufacturer should be able to identify critical upstream suppliers, assess alternative sources and determine which components create the longest recovery times following disruption. Public authorities can use aggregated information to identify structural dependencies and prioritise investment in alternative capabilities. This approach supports industrial sovereignty more directly than treating compliance documentation as an end in itself.
A decision framework for trade defence and localisation
The principal policy instruments differ in their legal authority, commercial effects and potential disadvantages. A comparative framework is necessary because measures that appear complementary can create conflicting incentives. For example, subsidising domestic battery production while permitting unrestricted imports may create financial pressure on new factories; imposing excessive local-content requirements may increase vehicle prices; supporting production without strengthening demand can create underutilised capacity.
| Policy option | Competent authority | Expected effect | Implementation horizon | Reversibility | Principal downside |
|---|---|---|---|---|---|
| Countervailing duties | European Commission under EU trade-defence law | Address established injurious subsidisation | Existing legal measures; subject to reviews | Legally reviewable under applicable procedures | Higher import costs and possible trade tensions |
| Targeted battery financing | EU and eligible national authorities | Improve bankability and industrial ramp-up | Multi-year | Financial commitments can be difficult to reverse | Public losses from unsuccessful projects |
| Local-origin conditions in support schemes | EU and national authorities under applicable law | Encourage local production and supplier development | Depends on adoption and implementation | Rules may be amended, contracts less easily | Higher costs and reduced sourcing flexibility |
| Critical-material diversification | EU, member states and private firms | Reduce concentrated supply risk | Multi-year | Physical investment is relatively irreversible | High investment and environmental costs |
| Consumer incentives | National governments within applicable frameworks | Stimulate vehicle demand | Potentially short-term | Generally adjustable | Fiscal cost and potential import leakage |
| Worker transition support | National and regional authorities | Reduce employment disruption and improve skills | Medium-term | Programme design adjustable | Weak outcomes if not linked to actual demand |
| Industrial standards and traceability | EU regulators and standards bodies | Improve interoperability and supply visibility | Phased implementation | Technical standards can evolve | Administrative and compliance costs |
The priority should be to select instruments according to the specific industrial constraint being addressed. A battery factory suffering from high scrap requires process engineering and manufacturing expertise, not primarily higher import duties on finished vehicles. A supplier unable to finance new machinery may require investment support, but only if it has credible customers. A strategic raw-material dependency may require international partnerships and processing capacity rather than complete domestic extraction. A shortage of affordable electric vehicles may require lower manufacturing costs and reliable charging infrastructure rather than permanently higher subsidies.
Key judgments
Trade defence and localisation can support European industrial resilience, but they cannot replace the development of competitive technologies and production systems. Countervailing duties should remain grounded in the legal findings and product scope of the relevant investigations. Localisation should be evaluated through domestic value added, technological capability and supply-chain resilience, not merely the physical location of final assembly. Employment policy must support industrial transformation while managing the social consequences of automation and changing production technologies. The strongest approach combines lawful trade defence with commercially disciplined investment, competitive procurement and targeted technological development.
What would change the assessment
Evidence that trade measures are accompanied by sustained productivity improvements and commercially viable investment would strengthen the case for their effectiveness. Evidence that localisation primarily increases prices without developing strategic capabilities would weaken it. The decisive observations concern actual investment, domestic value added, component sourcing, consumer prices, employment outcomes and the performance of supported manufacturers after public assistance declines.
Open official record
The most important unresolved questions concern the precise impact of countervailing duties on consumer prices and manufacturer margins, the extent of high-value localisation associated with new automotive investments, and the measurable effectiveness of skills and industrial-support programmes.
Chapter 10. Scenarios to 2031, Investment Priorities and Final Net Assessment
Principal judgment: Europe's automotive industrial future will not be determined by whether it constructs a manufacturing complex comparable in geographical extent to BYD's Zhengzhou development. It will be determined by whether manufacturers and public authorities can create a competitive relationship between vehicle architecture, battery technology, production efficiency, supplier capabilities and capital allocation. The central strategic risk is a gradual separation between European vehicle brands and the industrial technologies on which their future competitiveness depends. The most favourable outcome is not complete autarky, but an integrated European production system that remains commercially open while retaining sufficient control over critical technologies and alternative supply options. Four pathways are relevant to the period through 2031: coordinated industrial recovery, selective European specialisation, growing dependence on imported technologies, and a protection-driven fragmentation of the market. None can be assigned a defensible numerical probability from the available evidence. Their relative plausibility will depend on observable industrial outcomes rather than policy announcements.
The strategic baseline for 2026–2031: market access is no longer sufficient to secure industrial capability
Europe enters the next five years with a substantial automotive manufacturing base, important engineering capabilities and a policy framework increasingly concerned with industrial sovereignty. Nevertheless, market size alone cannot guarantee the preservation of domestic technological capabilities. A large consumer market may attract foreign manufacturers, but the resulting investment can range from comprehensive industrial production to limited assembly operations relying heavily on imported components. The distinction is economically important because employment, technological knowledge, supplier development and fiscal returns vary according to the activities actually performed locally.
The International Energy Agency's 2026 outlook indicates that China's position in electric-vehicle and battery manufacturing remains dominant. Its assessment identifies China as the world's largest electric-car production centre, accounting for approximately 70% of production under its manufacturing-and-trade scope in 2025, while other IEA reporting uses a broader measure approaching three-quarters. These different presentations should not be averaged or treated as identical series without reconciling their definitions. The report also identifies China's extensive role in battery cells and active materials and expects the country's dominant battery-industry position to persist over the longer horizon under stated policies. Global EV Outlook 2026: Manufacturing and Trade — International Energy Agency, May 2026; Global EV Outlook 2026: Executive Summary — International Energy Agency, May 2026.
The implication is that European industrial policy must operate in an environment where Chinese manufacturers possess substantial established capacities, technological expertise and supplier networks. These advantages cannot be eliminated through short-term investment programmes. They can, however, be offset selectively through product differentiation, commercially competitive manufacturing, technological specialisation and access to diversified global supply chains.
The relevant strategic objective is therefore not to achieve numerical parity with China in every industrial activity. It is to establish a sustainable European position in those manufacturing stages that determine future vehicle competitiveness and industrial security. This requires distinguishing technologies essential to Europe's autonomy from products that can be sourced efficiently and reliably from competitive international suppliers.
Four industrial pathways through 2031
Pathway A — Coordinated industrial recovery. Under this outcome, European manufacturers substantially reduce platform complexity, establish commercially competitive battery supply arrangements and improve manufacturing productivity through automation, industrial software and coordinated engineering. Public support is concentrated on projects with credible customers, validated technologies and measurable milestones. European battery facilities improve yields and utilisation, while domestic machinery and component suppliers increase their participation in new vehicle architectures. The outcome would preserve a broad automotive manufacturing base and increase European control over selected strategic technologies. Its principal constraint is execution: the benefits depend on manufacturers making difficult decisions about legacy capacity, common platforms, supplier relationships and investment priorities.
Pathway B — Selective technological specialisation. Europe maintains a competitive position in premium vehicles, specialised components, industrial equipment, engineering software and selected advanced battery technologies, but continues to rely on imported cells, materials or electronic components for substantial portions of mass-market production. This configuration would preserve important industrial capabilities while accepting a narrower degree of self-sufficiency. It could deliver attractive financial returns if European firms specialise in technologies with strong competitive advantages, but it would leave some segments exposed to foreign supply disruptions and pricing decisions. This pathway is economically credible because complete domestic replication of every stage of the global battery industry may be unnecessarily expensive.
Pathway C — Progressive industrial dependency. European manufacturers maintain commercial brands and some domestic assembly operations but increasingly rely on imported batteries, power electronics, manufacturing equipment and other high-value components. Domestic suppliers lose production volumes as established technologies decline, while investment in new capabilities remains fragmented or commercially unsuccessful. Vehicle prices may remain competitive because manufacturers access lower-cost international components, but the European share of technological value creation declines. This outcome would be particularly problematic where foreign suppliers acquire control over critical design standards or production technologies that are difficult to replace.
Pathway D — Protection-driven fragmentation. Governments respond to competitive pressure primarily through tariffs, localisation rules and extensive subsidies without sufficient improvements in underlying productivity. Trade restrictions encourage manufacturers to reorganise production geographically, but higher component costs and duplicative investment weaken global competitiveness. Some domestic employment may be protected temporarily, while consumers and downstream industries bear higher costs. This pathway becomes more plausible if public authorities respond to repeated investment failures by increasing protection rather than addressing technological and organisational weaknesses.
These pathways overlap in some respects and are not mutually exclusive at national or corporate level. Germany could experience significant technological recovery while some Italian suppliers continue to contract; France could establish competitive battery production while Europe remains dependent on imported active materials; the United Kingdom could attract substantial investment while retaining exposure to foreign-controlled technologies. The purpose of the framework is to identify mechanisms and observable indicators, not to manufacture a precise forecast unsupported by a statistical base rate.
| Strategic pathway | Industrial outcome by 2031 | Principal enabling conditions | Main failure mechanism | Observable confirmation |
|---|---|---|---|---|
| Coordinated recovery | Competitive European vehicle and critical-component manufacturing | Standardised platforms, battery yields, automation, effective financing | Delays and weak capital discipline | Sustained output, lower unit costs, competitive investment returns |
| Selective specialisation | Strong positions in defined technologies and market segments | Engineering differentiation, international sourcing, supplier innovation | Excessive dependence outside specialist segments | Export performance, profitability and retained technical capabilities |
| Progressive dependency | Domestic assembly with declining technological value added | Low-cost imports, limited domestic technology investment | Loss of engineering and supplier capabilities | Rising imported-content shares and supplier contraction |
| Protection-driven fragmentation | More local production requirements but weaker cost competitiveness | Persistent protection and public financial support | High costs, low utilisation and retaliation | Higher prices, repeated support requirements and weak export performance |
The most consequential uncertainty is whether public and private investment will be directed towards industrial capabilities that can eventually operate competitively without continuing extraordinary support. Battery factories, vehicle plants and component operations require sufficient market demand and production maturity to recover capital expenditure. Investment announcements are therefore weak indicators of strategic success unless followed by construction, commissioning, stable output, customer contracts and sustainable financial performance.
Investment priorities: sequence economic constraints rather than distribute funding indiscriminately
The most effective industrial investment programme should begin by identifying where the largest avoidable costs and strategic dependencies arise. In battery manufacturing, this means evaluating cell chemistry, material sourcing, yields, equipment performance and the cost of capital. In vehicle production, it means examining platform complexity, manufacturing quality, labour productivity, automation and utilisation. In supplier networks, it means identifying components whose availability or engineering characteristics determine the performance of the entire vehicle system.
A major policy error would be to treat every industrial project as equally strategic because it is associated with electric vehicles. Some projects may develop technologies with substantial competitive potential; others may reproduce capacity already available at lower cost elsewhere. Public authorities should require evidence that supported investments address an identifiable technological, commercial or security-related constraint. The relevant test is not simply whether an enterprise intends to manufacture batteries or components, but whether it can develop capabilities that strengthen Europe's economic position after the support period.
The following priorities reflect the relative leverage of different interventions rather than a ranking based on fabricated economic scores.
| Investment priority | Target capability | Responsible actors | Indicative time to material effect | Principal measurable result |
|---|---|---|---|---|
| Battery manufacturing maturity | Commercially viable yields and stable output | Cell producers, investors, EU and national authorities | 2–5 years, project-dependent | Saleable kWh, cost per kWh, investment returns |
| Upstream materials diversification | Alternative processing and component supply | Materials firms, governments, industrial customers | 3–5+ years | Qualified suppliers and reduced concentration |
| Vehicle-platform simplification | Lower component and engineering complexity | Automotive manufacturers | 2–5 years | Component count, manufacturing cost, programme expenditure |
| Factory productivity upgrades | Higher quality-adjusted output | Manufacturers, automation suppliers | 1–4 years | Equipment availability, defects and cost per vehicle |
| Supplier industrial transformation | Competence in emerging technologies | Component firms, customers, regional authorities | 2–5 years | New customer contracts and viable product revenue |
| Industrial software integration | Common production and engineering data | OEMs, suppliers, industrial software companies | 1–4 years | Engineering delays, inventory and unplanned downtime |
| Technical workforce transition | Maintenance, electronics, software and advanced manufacturing skills | Employers, training institutions and governments | 1–5 years | Employment outcomes and verified skill acquisition |
| Strategic supply resilience | Diversified sourcing and recovery capacity | Manufacturers, authorities and materials suppliers | 1–5+ years | Switching time, alternative supply and disruption recovery |
The implementation horizons are planning estimates based on the nature of the interventions, not official project completion forecasts. They assume adequate financing, regulatory approvals, technical competence and customer demand.
The sequencing matters. Supporting battery-cell production without credible customers can create idle capacity. Supporting vehicle assembly without competitive batteries can preserve a cost disadvantage. Funding advanced automation without redesigning inefficient production processes can increase capital intensity without lowering unit costs. Investing in raw-material projects without economically viable processing and downstream demand may create assets that fail to develop into an integrated supply chain.
The appropriate approach is therefore to connect each intervention to a clearly defined industrial system. Battery investment should be linked to vehicle-platform requirements, materials supply and customer demand. Automation should be linked to measurable production losses and improvements in quality-adjusted output. Supplier support should be linked to technical qualification and actual market opportunities. Training should be linked to skills required by firms undertaking commercially credible industrial investment.
The economic threshold for successful industrial transformation
The fundamental test of European manufacturing renewal is whether supported firms can reduce their costs and improve technological capabilities sufficiently to remain competitive under normal commercial conditions. A project that reaches its nominal production capacity but requires continuing operating subsidies has not necessarily achieved the desired industrial outcome. A smaller project producing competitively priced technology with sustainable returns may have greater strategic value.
An illustrative financing model demonstrates the importance of cost convergence. Suppose a European battery producer manufactures 20 GWh of saleable cells annually. A persistent manufacturing-cost disadvantage of €10 per kWh would represent €200 million per year across that output. A disadvantage of €20 per kWh would represent €400 million. A public financing programme could reduce interest expenditure or support investment, but a continuing cost gap of this magnitude would eventually need to be addressed through productivity, materials, technology or pricing. The calculation is hypothetical and does not represent observed costs at a particular European battery plant.
| Annual saleable battery production | €5/kWh cost disadvantage | €10/kWh disadvantage | €20/kWh disadvantage |
|---|---|---|---|
| 10 GWh | €50 million/year | €100 million/year | €200 million/year |
| 20 GWh | €100 million/year | €200 million/year | €400 million/year |
| 30 GWh | €150 million/year | €300 million/year | €600 million/year |
| 40 GWh | €200 million/year | €400 million/year | €800 million/year |
Analytical sensitivity using annual saleable capacity, with 1 GWh equal to one million kWh. The assumed cost differences are illustrative, not measured Chinese–European production-cost gaps. The model excludes changes in product specifications, selling prices, production yields and financing conditions.
The significance of the example is that structural manufacturing competitiveness cannot be purchased indefinitely through financing support. A battery producer must eventually achieve sufficiently competitive production costs, quality and product performance to attract customers. Public intervention can be useful during a period of industrial learning, but the investment case should include a credible path to commercial viability under conservative price assumptions.
Decision thresholds and the indicators that should govern public support
The most consequential investment decisions require a clear distinction between intermediate milestones and final outcomes. Construction completion is not evidence of manufacturing competence. Initial production does not establish commercial scale. Nominal capacity does not measure saleable output. Customer announcements do not necessarily represent binding offtake commitments. Employment projections are not equivalent to sustained employment.
A staged investment framework should therefore distinguish technical validation, industrial commissioning, commercial ramp-up and sustained operation. Public financing can be released against objectively verifiable milestones, with additional support conditional on evidence that previous investments have produced the intended results. The precise financial conditions depend on the instrument, legal authority and project risk, but the analytical principle is consistent: public resources should be linked to demonstrated capabilities rather than publicity surrounding an investment announcement.
| Investment stage | Required evidence | Decision consequence | Warning indicator |
|---|---|---|---|
| Project approval | Validated technology, financing plan, credible demand | Authorise initial support | Unsupported forecasts or incomplete financing |
| Construction | Permits, expenditure, contractor progress | Monitor capital deployment | Persistent delays or major overruns |
| Commissioning | Equipment acceptance, product validation | Permit transition to production support | Repeated technical failures |
| Industrial ramp-up | Saleable yield, output, customer qualification | Consider conditional further support | Persistent scrap or weak customer acceptance |
| Commercial operation | Unit costs, revenues, investment returns | Assess long-term viability | Dependence on recurring exceptional assistance |
| Strategic resilience | Supplier diversification, technical capability | Evaluate economic-security benefit | Single-source dependencies remain unchanged |
The framework should also include mechanisms for terminating support where performance remains persistently inadequate. Without credible withdrawal conditions, governments may become financially committed to facilities whose commercial prospects have deteriorated, particularly where large employment announcements create political pressure. Withdrawal should be managed according to contractual obligations and legitimate transition concerns, but an industrial policy unable to recognise unsuccessful projects risks diverting resources from more competitive opportunities.
The risks facing BYD and the wider Chinese manufacturing system
A balanced assessment must recognise that China's industrial position is formidable but not immune to economic constraints. The principal risks include underutilised capacity, intense domestic price competition, export restrictions, material and technological dependencies, environmental obligations and the financial burden of continued investment. These risks are not identical across manufacturers, and the existence of industry-wide overcapacity does not establish that a particular BYD factory operates inefficiently.
The IEA reports that China's electric-car production substantially exceeded domestic demand in 2025, contributing to rapid export growth. It also identifies intense competitive pressure within China's domestic automotive market, which can compress producer margins and encourage overseas expansion. These conditions create incentives for manufacturers to find new markets and improve utilisation, but they may also produce significant financial volatility if overseas sales encounter tariffs or other barriers. Global EV Outlook 2026: Manufacturing and Trade — International Energy Agency, May 2026.
The development of overseas production can mitigate some trade restrictions while increasing financial and managerial complexity. Building factories in Europe or other markets requires local workforce development, supplier qualification, regulatory compliance and sufficient production volumes. A manufacturer may enjoy strong production economics in China but face a different cost structure in a new overseas factory. Replicating the organisational features of an integrated Chinese complex is not necessarily straightforward when the supporting materials and component industries remain concentrated elsewhere.
China also faces technological uncertainties. Battery chemistry, semiconductor technology, industrial software and manufacturing equipment continue to evolve. Existing investments can become less competitive when new processes offer superior economics. A vertically integrated manufacturer may respond quickly because it controls several engineering stages, but it may also face substantial replacement costs if its internal manufacturing assets are tied to older technologies. The long-term advantage depends on the ability to adapt capital-intensive systems rather than merely expand them.
The final strategic judgment: industrial sovereignty requires competitive interdependence
The economic-security implications of Zhengzhou are best understood through a distinction between dependence and interdependence. International automotive manufacturing necessarily involves cross-border flows of materials, components, technology and capital. Complete domestic production of every input would be prohibitively expensive for most countries and could weaken the competitive benefits generated by specialisation. The strategic problem arises when a critical capability is concentrated in a supplier system that cannot be substituted within an acceptable period or at an acceptable cost.
Europe should therefore aim for competitive interdependence: retaining domestic or allied capabilities in strategically important technologies while maintaining access to internationally competitive suppliers. This approach requires identifying critical dependencies through engineering and supply-chain analysis rather than broad assumptions about national origin. It also requires the capacity to respond to disruptions through alternative suppliers, available inventories, flexible production systems and retained technical competence.
Such a strategy is more demanding than conventional protectionism because it requires continuous measurement of industrial performance. Governments must distinguish valuable projects from unsuccessful investments, manufacturers must simplify operations even where doing so challenges established organisational structures, and suppliers must adapt to technologies that may reduce demand for existing products. Public authorities also need to avoid competition between member states that results in duplicated capacity and weak returns. The objective is a coherent European industrial system capable of competing internationally, not a collection of nationally protected factories.
Decision-relevant conclusions for European institutions and manufacturers
The analysis supports five central conclusions. First, the reported territorial expansion of Zhengzhou should not determine European investment priorities because land area is not a reliable measure of manufacturing competitiveness. Second, battery technology and the organisation of component supply represent more consequential sources of industrial advantage. Third, Europe possesses sufficient engineering and automation capabilities to improve its competitive position, but those capabilities must be combined with simplified vehicle architectures and commercially disciplined investment. Fourth, trade defence and localisation can address specific economic-security concerns but cannot compensate indefinitely for high production costs. Fifth, public support should be measured by the industrial capabilities and sustainable economic results it produces, rather than by announced expenditure or nominal manufacturing capacity.
For automotive manufacturers, the highest-leverage actions are to reduce platform complexity, concentrate production on commercially credible programmes, establish competitive battery sourcing, improve quality-adjusted factory productivity and preserve flexibility in component procurement. For public authorities, the priorities are to facilitate commercially viable investment, develop strategic materials and component capabilities, support technical skills and ensure that regulation provides predictable conditions without protecting structurally inefficient production indefinitely.
These conclusions do not imply that every European manufacturer should internalise battery production or that every national economy should establish a complete electric-vehicle value chain. The efficient distribution of industrial functions depends on technological capability, economies of scale, customer demand and the potential to develop competitive supplier networks. A European system combining several highly specialised production centres can be more economically resilient than multiple attempts to replicate a complete integrated complex within each jurisdiction.
Final net assessment
BYD's Zhengzhou industrial development represents a serious challenge to European automotive manufacturers because it embodies an organisational model capable of coordinating large-scale vehicle manufacturing with technologically important components and supporting industrial infrastructure. The existence of the complex and its substantial documented vehicle output demonstrate that this is an operational industrial development rather than merely an announced project. Nevertheless, the geographical claims associated with its expansion remain insufficiently corroborated, and the public record does not establish that the largest reported development area is fully operational or that the complex generates superior financial returns compared with all European alternatives.
The competitive significance of Zhengzhou lies in its ability to operate within China's wider manufacturing ecosystem, where battery production, materials processing, component suppliers and automation investment have reached exceptional scale. Those conditions can confer advantages that are difficult to reproduce quickly. Yet the economic performance of the system remains conditional on product demand, utilisation, technological relevance and capital discipline. Large integrated facilities can achieve substantial efficiencies, but they can also accumulate considerable financial exposure when market conditions change.
Europe's response should consequently reject the false choice between wholesale imitation and passive industrial decline. The Union and its member states possess manufacturing capabilities, technological institutions and economic resources that can support a viable automotive transition, but the distribution of those resources must become more selective and coordinated. Competitive battery production, advanced automation, simplified vehicle platforms, supplier transformation and diversified materials sourcing constitute the most important instruments. Their success must be assessed through manufacturing cost, quality, domestic value added, technology ownership and sustainable returns.
The decisive strategic conclusion is that Europe's automotive future depends not on matching the physical scale of Zhengzhou, but on matching—and where possible surpassing—the economic effectiveness of the industrial relationships it represents. Industrial sovereignty will be preserved only where technological control is accompanied by commercially competitive production. Protection can create time for adjustment, public investment can reduce initial barriers, and international partnerships can diversify supply, but none can replace the continuous improvement of the manufacturing system itself.
Key judgments
Europe remains capable of sustaining a major automotive industry through 2031, but the viability of that industry will depend on its willingness to transform production architecture, capital allocation and supply-chain organisation. BYD's integrated model is a consequential competitive reference, not a universally proven industrial optimum. The strongest European outcome combines selective technological sovereignty with efficient international sourcing and sustained manufacturing productivity. The principal danger is not the loss of every European vehicle factory, but the progressive weakening of the technologies and supplier capabilities that determine where future automotive value is created.
What would change the assessment
A sustained convergence of European battery-production costs towards competitive international benchmarks, combined with higher manufacturing utilisation, successful technological investment and stable export performance, would strengthen the outlook for European industrial recovery. Conversely, increasing reliance on imported high-value components, repeated failures of publicly supported battery projects, declining domestic manufacturing value added and persistent protection-dependent profitability would indicate a movement towards the less favourable pathways.
Open official record
The most consequential evidence required for continued monitoring comprises comparable manufacturing-cost and return-on-capital data, battery-production yields and utilisation, component-level import dependence, realised investment outcomes, supplier transformation results and the commercial performance of newly introduced European electric-vehicle platforms. These records should determine whether policies are maintained, modified or withdrawn during the 2026–2031 period.


