
















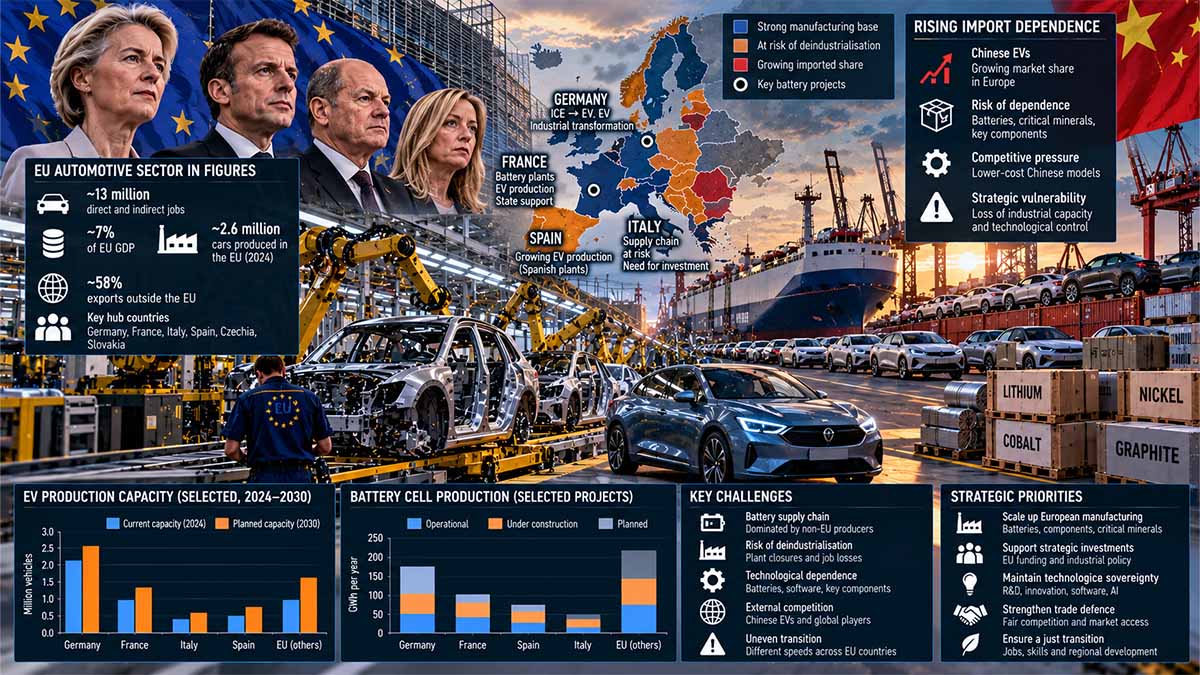
Volvo Cars’ Q3 2026 losses, China’s industrial expansion, and the widening divergence between EU decarbonisation requirements and European automotive competitiveness
Scope: This assessment examines the European Union’s passenger-car regulatory and industrial transition through 28 October 2026, using Volvo Cars’ third-quarter results, European vehicle registrations and trade statistics, and European Commission policy instruments. It evaluates the implications for the EU collectively and for Germany, France, Italy and the United Kingdom separately, with an analytical horizon extending to 2031 and a regulatory outlook to 2035.
Executive Summary — Bottom Line Up Front
Europe’s principal automotive risk is no longer simply that electrification may proceed more slowly than expected. It is that electrification could succeed commercially while an increasing proportion of the vehicles, batteries, components and industrial value added are produced outside Europe.
The evidence establishes a material industrial vulnerability, although it does not establish that EU emissions regulation is the principal cause of the sector’s deterioration.
In the first nine months of 2026, battery-electric vehicles accounted for 22.7% of EU new-car registrations, compared with 36.3% for conventional hybrids, 10.1% for plug-in hybrids and 28.2% for petrol and diesel vehicles combined. Pure-electric uptake is accelerating, but it remains far below the market penetration that a predominantly zero-tailpipe-emission new-car market in 2035 would require. European Automobile Manufacturers’ Association
Volvo Cars illustrates the commercial difficulty. Its third-quarter net result deteriorated from a SEK 4.5 billion profit in 2025 to a SEK 5.7 billion loss in 2026, even as the fully electric share of its global retail sales increased from 22% to 32%. Revenue fell 23%, retail sales contracted 11%, and the company announced approximately 2,500 additional structural job reductions. These simultaneous developments demonstrate that increasing electric penetration does not automatically deliver profitability. attachment.news.eu.nasdaq.com+1
The larger industrial warning comes from trade and production. In the first half of 2026, the EU passenger-car trade surplus contracted 34.2% to €28.7 billion, while vehicles manufactured in China reached 9% of cars sold in the EU and EU-manufactured vehicles accounted for only 68%. European Automobile Manufacturers’ Association
The IEA identifies an accompanying structural asymmetry: Chinese battery-pack prices were approximately 35% below European prices in 2025, and China accounted for more than 80% of global battery-manufacturing capacity. IEA
The central policy choice is therefore not decarbonisation versus industrial protection. It is whether Europe can redesign the instruments and sequencing of decarbonisation so that rising electric-vehicle demand creates European manufacturing capabilities rather than primarily increasing imported industrial content.
The highest-leverage response combines legally credible emissions targets, conditional powertrain flexibility, competitive European battery production, affordable charging, proportionate trade-defence instruments and measurable commitments to local industrial value creation. Maintaining deadlines without these complementary capabilities risks premature capacity loss; postponing transformation without investment obligations risks preserving declining technologies while allowing foreign competitors to consolidate leadership.
Europe’s Electric Car Paradox: The Market Is Changing Faster Than Its Industrial Base Can Survive
Europe’s automotive transition is exposing a fundamental contradiction: the continent is accelerating electrification while losing ground in the manufacturing, technologies and supply chains on which its industrial power depends.
The European Union faces a decision whose consequences extend well beyond the future of the combustion engine. Its regulatory framework is pushing manufacturers towards a predominantly electric market by 2035, yet the industrial system expected to deliver that transformation is under increasing financial and competitive pressure. During the first half of 2026, Europe’s passenger-car trade surplus contracted by 34.2%, while vehicles manufactured in China captured 9% of EU sales. Battery-electric registrations are growing, but conventional hybrids remain the largest propulsion category. The danger is not that Europe will fail to electrify its roads. It is that electrification may advance while factories, engineering capabilities and the highest-value components migrate elsewhere, leaving European consumers purchasing technologies that their own industrial economy has progressively lost the capacity to produce.
Europe’s Automotive Trade Surplus Is Eroding While Its Consumers Buy More Cars
The contradiction is already visible in the European Automobile Manufacturers’ Association’s first-half 2026 statistics. EU passenger-car exports declined 12% in value, to approximately €69.4 billion, while imports increased 15.6%, to €40.7 billion. The resulting trade surplus fell from approximately €43.6 billion to €28.7 billion, a deterioration of nearly €15 billion within one comparable six-month period. Export volumes contracted by 5.9%, while import volumes increased by 16.1%, demonstrating that the weakening external balance cannot be explained exclusively by currency movements or changes in vehicle prices.
The more consequential development concerns manufacturing origin. Only 68% of vehicles sold in the European Union during the first half of 2026 were manufactured within the Union, while China-produced vehicles accounted for 9%. European factories were therefore losing ground in their own market while facing weaker conditions abroad. EU passenger-car production declined 0.4%, even as domestic new-car registrations increased 5.7%. The distinction matters because vehicle consumption and vehicle production contribute differently to national prosperity. Imported cars can satisfy environmental requirements and improve consumer choice without generating equivalent European manufacturing employment, engineering expenditure, supplier contracts or export earnings.
China’s growing penetration must also be interpreted correctly. The 9% figure concerns vehicles manufactured in China, not exclusively Chinese-owned brands. European manufacturers operating Chinese factories can contribute to that share, while Chinese-owned companies manufacturing within Europe contribute to European production. This distinction reveals a structural problem that extends beyond conventional trade competition: multinational manufacturers may preserve their brands, distribution networks and commercial presence while reallocating productive activity away from the European territories that historically supported them.
The Battery-Electric Market Is Growing, but Hybrid Demand Exposes the Regulatory Gap
The latest European registration data do not support the claim that consumers have rejected electrification. During January–September 2026, battery-electric registrations reached 1,931,465 vehicles, representing 22.7% of the EU passenger-car market, compared with 16.1% during the corresponding period of 2025. Pure-electric adoption increased by 6.6 percentage points, a significant acceleration. Nevertheless, conventional hybrids accounted for 36.3%, with 3,090,530 registrations, while plug-in hybrids represented another 10.1%, equivalent to 860,257 vehicles. Petrol and diesel combined retained approximately 28.2% of new registrations.
The figures describe a market moving towards lower-emission technologies without converging on a single propulsion system at the speed implied by a fully zero-tailpipe-emission new-car market. Consumers continue to distinguish between battery-electric vehicles, conventional hybrids and plug-in hybrids according to purchase price, charging accessibility, expected depreciation and practical operating requirements. The difference is particularly consequential for households without private parking and buyers who cannot absorb a substantial initial price premium in exchange for possible future operating savings.
National developments further complicate the picture. Battery-electric registrations increased 79.1% in France and 58.1% in Germany during the first nine months of 2026, while conventional hybrid registrations grew 20.8% in Italy and 20.5% in Spain. Italian plug-in hybrid registrations rose 72.4%. These are growth rates rather than market shares, but they establish that Europe’s automotive transition is proceeding through different technologies and purchasing decisions across national markets operating under the same overarching EU emissions framework.
This divergence creates a financial problem for manufacturers. They must finance electric platforms and battery integration while maintaining products that customers continue purchasing. The cost is not merely technological duplication; it includes simultaneous investment in engineering, tooling, supplier qualification, software and manufacturing capacity. Regulatory compliance may encourage manufacturers to discount electric vehicles even where prevailing market conditions do not support the necessary margins. The result can be rising electric registrations accompanied by weaker profitability.
Volvo and Stellantis Demonstrate That Electrification Does Not Guarantee Profitability
Volvo Cars’ third-quarter 2026 results provide one of the clearest examples of this contradiction. The Swedish manufacturer recorded a SEK 5.7 billion net loss, compared with a SEK 4.5 billion profit one year earlier. Revenue declined 23%, to SEK 66.9 billion, while global retail deliveries fell approximately 11%. Reported operating income deteriorated from a positive SEK 6.4 billion to a loss of SEK 5.6 billion.
Yet Volvo’s fully electric share of global retail sales increased from 22% to 32% over the same period. The company was advancing its technological transition while its consolidated financial performance deteriorated. Its response included an additional SEK 5 billion cost-reduction programme and approximately 2,500 planned job reductions, including around 2,000 positions in Sweden.
The result does not prove that electric vehicles caused Volvo’s losses. The company identified weaker volumes, adverse pricing and sales mix, raw-material costs, foreign-exchange movements, US tariffs and financial effects involving associated businesses. It nevertheless demonstrates that higher electric penetration cannot be treated as a sufficient measure of successful industrial transformation. A manufacturer may increase electric deliveries while losing the revenue and operating margins required to finance future development.
Volvo’s strategy had already changed before this deterioration. In March 2021, the company announced its ambition to become fully electric globally by 2030. In September 2024, it revised that objective, allowing 90–100% of sales to comprise fully electric and plug-in hybrid vehicles, while retaining the possibility of up to 10% mild hybrids. The revision acknowledged that consumer demand and technological transition were not progressing uniformly.
Stellantis illustrates the wider financial pressure. Its 2025 consolidated net loss reached €22.33 billion, compared with a €5.52 billion profit in 2024, while adjusted operating income deteriorated from a positive €8.65 billion to a loss of approximately €840 million. Volkswagen Group’s operating margin contracted from 7.0% in 2023 to 5.9% in 2024 and 2.8% in 2025, with operating profit declining to approximately €8.9 billion in 2025.
These figures arise from different accounting frameworks, corporate structures and commercial circumstances. They cannot be aggregated into a single estimate of the cost of European emissions regulation. Together, however, they expose an industrial system in which product transformation, competition and financial restructuring are occurring simultaneously.
China’s Advantage Begins Long Before the Vehicle Reaches the Showroom
European manufacturers are not competing exclusively against cheaper imported cars. They are confronting an industrial system whose advantages extend across batteries, materials processing, component manufacturing and final assembly.
According to the International Energy Agency’s Global EV Outlook 2026, China manufactured approximately 16 million electric cars in 2025, accounting for nearly three-quarters of global electric-car production, and exported more than 2.5 million. Its domestic electric-car production exceeded local demand by approximately 20%, creating a substantial base for international expansion.
The battery figures are more revealing. By the end of 2025, global lithium-ion battery manufacturing capacity exceeded 4 TWh, with China accounting for more than 80%, compared with approximately 6–7% for the European Union. Chinese-headquartered manufacturers supplied almost three-quarters of the batteries installed in electric cars worldwide and more than half of those deployed in the EU market.
Average battery-pack prices in China were approximately 35% below European levels in 2025, while European and American battery manufacturing costs remained as much as 50% higher than Chinese costs when public support was excluded. China also accounted for approximately 85% of global cathode active material production and more than 90% of anode active material production.
These advantages operate directly through the cost structure of electric vehicles. A European manufacturer may maintain final assembly within the Union while importing battery cells, materials and electronic components from foreign suppliers. The vehicle remains European-produced for manufacturing-origin purposes, but a substantial portion of its industrial value and technological dependence can lie elsewhere.
Tariffs on finished vehicles cannot resolve that problem. The European Commission’s October 2024 countervailing measures against qualifying Chinese battery-electric imports established differentiated additional duties, including 17.0% for BYD, 18.8% for Geely and 35.3% for SAIC. These instruments address investigated subsidisation, not every component of China’s manufacturing competitiveness. They may improve competitive conditions for European producers, but they cannot independently create competitive European battery-cell factories or eliminate dependence on imported materials.
The 2035 Regulation Is Already Being Reconsidered, but Flexibility Has an Industrial Price
Regulation (EU) 2023/851 established a 100% fleet-wide reduction in regulated tailpipe CO₂ emissions for new passenger cars from 2035, following a 55% reduction requirement for 2030–2034 against the applicable 2021 reference targets. The framework governs new-vehicle emissions compliance; it does not prohibit the continued use of existing combustion-engine cars.
In June 2025, the EU adopted Regulation (EU) 2025/1214, introducing three-year averaging for manufacturer compliance during 2025–2027. On 16 December 2025, the European Commission presented a more substantial revision proposal, envisaging a 90% reduction from 2035, with qualifying compensation arrangements involving European low-carbon steel and renewable fuels. The proposed framework would preserve a role for certain hybrid and combustion technologies. As of the October 2026 assessment, that proposal must remain distinguished from enacted law.
The industrial case for flexibility is substantial but conditional. Retaining commercially viable hybrid programmes can protect manufacturing employment, preserve supplier contracts and provide revenue to finance electric investment. Yet indefinite relaxation can create another form of industrial damage by encouraging manufacturers to postpone battery, software and electric-platform development while international competitors continue accumulating scale and expertise.
The Commission’s proposed €1.8 billion Battery Booster, including €1.5 billion intended for interest-free loans to European battery-cell manufacturers, recognises the need to address manufacturing competitiveness alongside regulation. Nevertheless, public financing does not guarantee viable production. Battery factories require reliable orders, high manufacturing yields, qualified materials and competitive operating costs. Announced capacity is not equivalent to commercially usable output.
The critical distinction is therefore between technological flexibility that finances industrial conversion and flexibility that merely extends declining business models. The former can preserve Europe’s productive capabilities; the latter risks allowing those capabilities to deteriorate behind temporary regulatory protection.
Germany, France, Italy and Britain Will Bear Different Costs of Industrial Retrenchment
Germany’s exposure derives from its scale. During the first half of 2026, it produced approximately 2.05 million passenger cars, representing 34.2% of EU output. Its industrial system combines major assembly operations with extensive engineering, machinery and component networks. A shift towards imported electric vehicles or foreign battery systems therefore threatens more than final assembly: it can weaken the demand supporting specialised suppliers, industrial research and export-oriented manufacturing.
France produced approximately 517,420 passenger cars during the same period, an increase of 2.9%. Its challenge is to convert investment in electric vehicles and battery production into sustained domestic output rather than nominal capacity dependent on recurring financial assistance. Competitive manufacturing yields, local supplier contracts and reliable customer demand will matter more than factory announcements.
Italy presents a different vulnerability. Passenger-car production reached approximately 169,300 units in the first half of 2026, up 24.5% from a weak comparison period but representing only 2.8% of EU production. Its strategic exposure lies substantially in specialised components, precision engineering, tooling, industrial machinery and manufacturing automation. Losing established combustion-related contracts without financing conversion towards electric motors, power electronics and new production equipment could weaken industrial capabilities that extend well beyond vehicle assembly.
The United Kingdom operates outside the EU regulatory framework but remains deeply integrated into European automotive trade. British passenger-car production reached 371,756 units in the first half of 2026, declining 3.6%, while approximately 76.9% of production was exported. Its exposure combines manufacturing competitiveness with market access, regulatory divergence and the economics of cross-border supply chains.
The four economies therefore cannot rely on identical interventions. Germany must protect the competitiveness of a large export-oriented system; France must turn new industrial investment into profitable output; Italy must finance supplier transformation; and Britain must preserve manufacturing viability across a distinct regulatory and trade framework. Their common interest is ensuring that electric-vehicle adoption does not become a mechanism for transferring manufacturing investment and technological capabilities outside Europe.
The Next 24 Months Will Determine Whether Europe Preserves Its Industrial Options
Between late 2026 and October 2028, European institutions will face decisions whose consequences extend towards 2035. The outcome of the Commission’s regulatory revision, implementation of the Battery Booster, the operation of existing trade-defence measures and investment in charging infrastructure will influence whether manufacturers can transform their product portfolios without permanently weakening their production networks.
The consequences of inaction will not be distributed evenly. Major manufacturers may respond through international production reallocations, procurement restructuring and reduced investment in less competitive facilities. Smaller suppliers will have fewer alternatives. Engineering-intensive regions in Germany, France and Italy may lose specialised capabilities before new contracts emerge, while British producers remain exposed to the commercial consequences of divergence from their principal export markets.
The most damaging outcome would be a transition that increases electric-vehicle registrations while reducing the proportion of industrial value generated within Europe. Reversing such a development would require more than a later amendment to emissions legislation. Once production programmes have moved, suppliers have disappeared and specialist engineers have left, restoring the original industrial ecosystem becomes costly and uncertain.
The European Union’s policy choice is consequently narrower than the political debate suggests. It must maintain credible decarbonisation while allowing commercially justified technological sequencing, and it must attach public industrial support to measurable production, competitiveness and employment outcomes. Regulatory deadlines alone cannot manufacture batteries, lower production costs or preserve supplier networks.
Europe can achieve a more electric automotive market without achieving a stronger European automotive industry. The cost of confusing those outcomes will fall on manufacturing workers, specialised suppliers, industrial regions and public finances—not on the registration statistics used to declare the transition successful.
Navigational Index
Pillar I — Regulatory Architecture, Consumer Demand and the Volvo Evidence
- Chapter 1 — The European Regulatory Calendar: Binding Requirements, Revisions and the 2035 Transition
- Chapter 2 — Market Adoption and Consumer Economics: Battery Electric, Hybrid and Combustion Technologies
- Chapter 3 — Volvo Cars Q3 2026: Financial Deterioration, Electrification and Industrial Restructuring
Pillar II — Industrial Competitiveness, Chinese Expansion and European Production Sovereignty
- Chapter 4 — The Erosion of Europe’s Automotive Trade Surplus and Production Base
- Chapter 5 — China’s Competitive Architecture: Batteries, Manufacturing Costs, Finished Vehicles and Supply Chains
- Chapter 6 — Industrial Competences, Employment and Regional Clusters: Germany, France, Italy and the United Kingdom
Pillar III — Strategic Policy Choices, Transition Scenarios and Industrial-Security Outcomes
- Chapter 7 — Technological Neutrality, Emissions Integrity and the Political Economy of Transition
- Chapter 8 — Regulatory Sequencing, Trade Defence, Investment and Skills: European Policy Options
- Chapter 9 — The 2027–2031 Outlook, Strategic Indicators and Final Net Assessment
Master Abstract
The emerging distinction between market electrification and industrial sovereignty
The European automotive transition now presents policymakers with two separate questions that have too often been treated as interchangeable. The first concerns whether transport emissions can be reduced consistently with the Union’s climate commitments. The second concerns whether the industrial transformation required to achieve that objective will preserve the manufacturing, engineering, technological and export capabilities that have historically made the automotive sector central to European economic power. Successful progress on the first objective does not necessarily establish success on the second. A battery-electric vehicle registered in the European Union contributes to market electrification irrespective of whether its cells, electronic systems, software architecture or final assembly originate in Europe. For climate regulation, the place of production may be secondary to emissions performance; for industrial strategy, employment and economic security, it is fundamental.
This difference has become consequential because the market is electrifying faster than European production is consolidating its competitive position. ACEA’s September 2026 registration statistics demonstrate a significant expansion of battery-electric demand, yet hybrids remain the largest propulsion category. Its separate first-half industry report indicates that European manufacturers are facing simultaneous pressure from weaker exports and rising imported vehicle penetration. Neither dataset proves that the regulatory timetable caused the trade deterioration, but their combination establishes the central policy problem: the Union can increase electric-vehicle adoption without ensuring that the associated manufacturing value is captured within its territory. European Automobile Manufacturers’ Association+1
The Volvo paradox and the danger of interpreting financial losses as technological failure
Volvo Cars provides a particularly useful illustration because its electric transition is substantial rather than merely aspirational. In the third quarter of 2026, 32% of its global retail deliveries were fully electric, up from 22% one year earlier, and the company reported a 45% fully electric share in Europe. Nevertheless, group profitability deteriorated sharply. The financial bridge attributes the decline to lower wholesale volumes, adverse sales mix and pricing, foreign exchange, raw-material costs, reduced licensing income and other effects, including United States tariffs and financial exposure to associated companies. These findings support a diagnosis of commercial and industrial stress during electrification, not a conclusion that battery-electric vehicles themselves caused the entire loss. Volvo Cars+1
Volvo’s more flexible product strategy also demonstrates that technological sequencing is already changing inside industry. The company is retaining and expanding plug-in-hybrid offerings while investing in dedicated electric platforms, regional products and closer technology and procurement cooperation with Geely. Its announced restructuring involves approximately 2,500 positions, including 2,000 in Sweden, together with an additional SEK 5 billion cost-reduction programme. This is a corporate adaptation to competitive and financial conditions, not evidence that abandoning emissions targets would automatically restore profitability. attachment.news.eu.nasdaq.com+1
Why Chinese competition transforms an environmental transition into an economic-security issue
China’s advantage extends beyond the export price of complete cars. It encompasses battery-cell production, electrode materials, industrial scale, manufacturing efficiency, supply-chain coordination and the capacity to commercialise lower-cost technologies. The IEA reports that China held more than 80% of global lithium-ion battery manufacturing capacity at the end of 2025, while the EU accounted for approximately 6–7%. The agency also documents persistent regional differences in production costs and the difficulty European battery manufacturers face in reaching competitive yields and scale. The implication is that vehicle assembly alone is an insufficient measure of strategic autonomy: an apparently European-made electric vehicle can still embody substantial imported technology and value. IEA
This does not establish a case for unrestricted preservation of combustion engines. Delaying low-emission investment would expose European manufacturers to a different risk: spending scarce capital on products whose long-term markets are contracting, while more efficient international competitors continue to advance in batteries and software. A defensible transition strategy must therefore distinguish between retaining commercially useful hybrid competencies during the transition and protecting obsolete production capacity indefinitely. The appropriate policy objective is to maintain industrial options while accelerating competitive low-carbon manufacturing.
A regulatory correction is already under discussion
The regulatory baseline also requires precision. Regulation (EU) 2023/851 established a 100% fleet-wide reduction in new-vehicle tailpipe CO₂ targets from 2035, but the European Commission presented a proposed revision on 16 December 2025. That proposal would replace the 2035 benchmark with a 90% tailpipe-reduction target, with compensation arrangements involving qualifying low-carbon steel and fuels, permitting a continuing role for certain combustion and hybrid vehicles. A Commission proposal is not equivalent to enacted law, and the analysis must distinguish the existing legislative framework from prospective amendments. EUR-Lex+1
The strongest policy position is therefore neither unconditional regulatory rigidity nor an indefinite postponement of electrification. It is a legally predictable, emissions-accountable transition whose instruments respond to measurable industrial conditions: European production investment, actual charging availability, affordable vehicle supply, battery-cell competitiveness, supply-chain diversification and workforce conversion. Under that approach, flexibility becomes a means of preserving the capacity to decarbonise rather than a substitute for decarbonisation.
Key Evidence Table — Verified Industrial and Regulatory Baseline
The figures below preserve the different accounting, geographical and statistical definitions used by the reporting institutions. In particular, Volvo’s global financial performance cannot be equated directly with EU registrations, while the European trade surplus measures completed-vehicle trade rather than total automotive value added.
| Indicator | Value/status | Reference date | Definition/scope | Issuer | Exact source |
|---|---|---|---|---|---|
| Volvo Cars net income | SEK −5.7bn versus +4.5bn | Q3 2026 / Q3 2025 | Consolidated group net result | Volvo Cars | Interim Report, p. 10 — Oct 2026 |
| Volvo Cars EBIT | SEK −5.6bn versus +6.4bn | Q3 2026 / Q3 2025 | Reported operating income | Volvo Cars | Interim Report, pp. 2, 10 — Oct 2026 |
| Volvo Cars adjusted EBIT | SEK −3.7bn versus +5.8bn | Q3 2026 / Q3 2025 | Excluding associates/JVs and comparability items | Volvo Cars | Interim Report, p. 2 — Oct 2026 |
| Revenue | SEK 66.9bn; −23% | Q3 2026 | Consolidated revenue | Volvo Cars | Interim Report, p. 10 — Oct 2026 |
| Retail deliveries | 141,300; −11% | Q3 2026 | Global retail sales; distinct from wholesale deliveries | Volvo Cars | Interim Report, p. 2 — Oct 2026 |
| Fully electric Volvo sales share | 32%, versus 22% | Q3 2026 / Q3 2025 | Global retail deliveries | Volvo Cars | Q3 Results — Oct 2026 |
| Volvo restructuring | Approximately 2,500 jobs; SEK 5bn additional savings target | Announced Oct 2026 | Planned workforce and cost adjustments, not completed savings | Volvo Cars | Q3 Results — Oct 2026 |
| EU battery-electric share | 22.7%; 1,931,465 cars | Jan–Sep 2026 | New passenger-car registrations, EU | ACEA | Registration Statistics — Oct 2026 |
| EU conventional hybrids | 36.3%; 3,090,530 cars | Jan–Sep 2026 | Hybrid-electric registrations, excluding PHEVs | ACEA | Registration Statistics — Oct 2026 |
| EU plug-in hybrids | 10.1%; 860,257 cars | Jan–Sep 2026 | Plug-in hybrid registrations | ACEA | Registration Statistics — Oct 2026 |
| EU petrol and diesel | 28.2% combined | Jan–Sep 2026 | New registrations; separate from hybrids | ACEA | Registration Statistics — Oct 2026 |
| EU new-car trade surplus | €28.715bn; −34.2% | H1 2026 versus H1 2025 | Extra-EU trade, HS 8703 coverage | ACEA / Eurostat | Economic and Market Report, p. 18 — Oct 2026 |
| EU new-car exports | €69.383bn; −12.0% | H1 2026 versus H1 2025 | Extra-EU export value | ACEA / Eurostat | Economic and Market Report, p. 18 — Oct 2026 |
| EU new-car imports | €40.669bn; +15.6% | H1 2026 versus H1 2025 | Extra-EU import value | ACEA / Eurostat | Economic and Market Report, p. 18 — Oct 2026 |
| China-origin finished-car imports | 708,908 vehicles; €10.541bn | H1 2026 | Imports from China into EU | ACEA / Eurostat | Economic and Market Report, p. 19 — Oct 2026 |
| China-produced vehicles’ EU sales share | 9% | H1 2026 | Production-origin share, not brand nationality | ACEA | Economic and Market Report — Oct 2026 |
| EU-produced vehicles’ EU sales share | 68% | H1 2026 | Production-origin share of EU car sales | ACEA | Economic and Market Report — Oct 2026 |
| Chinese battery-pack cost differential | Approximately 35% below Europe | 2025 | Average regional battery-pack prices across uses | IEA | Global EV Outlook, Batteries — 2026 |
| EU 2035 tailpipe target | 100% reduction under existing regulation | From 2035 | Fleet-wide new-car CO₂ standard | EU legislature | Regulation (EU) 2023/851 — Apr 2023 |
| Commission’s proposed 2035 revision | 90% reduction plus qualifying compensation | Proposal of Dec 2025 | Proposed amendment, not automatically enacted law | European Commission | Cars and Vans — European Commission |
Source control: Volvo reports global consolidated results; ACEA registration shares cover EU new-car demand; ACEA’s production-origin statistics cover H1 2026; the trade figures follow Eurostat’s HS 8703 product coverage. Amounts in SEK and EUR have not been converted or aggregated.
Decision-Useful Visualisation — The Market and Industrial Production Gap
The following two comparisons capture different but complementary dimensions of the transition. The first measures what EU consumers purchased by propulsion category during January–September 2026. The second measures where vehicles sold in the EU were manufactured during the first half of 2026. These distributions must not be interpreted as a cross-tabulation: they do not establish how many Chinese-produced cars were battery-electric or how many EU-produced cars were hybrids.
EU new passenger-car registrations by powertrain
January–September 2026 | Percentage of new registrations
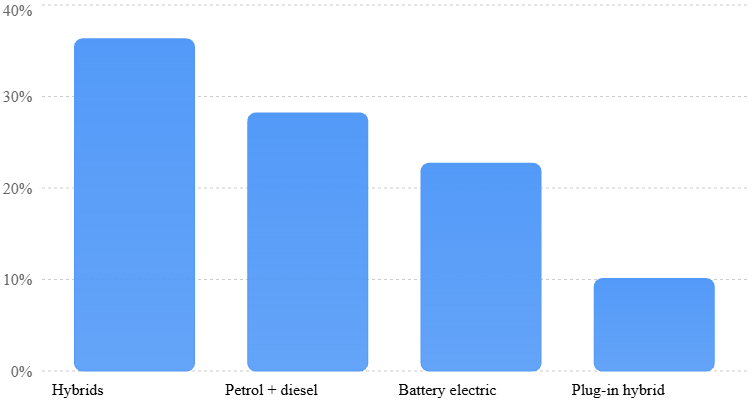
Source: ACEA, 22 October 2026. Figures are rounded and may not sum exactly to 100%.
The four displayed categories account for 97.3% using published rounded figures; the remainder includes other powertrains and classification differences.
Where cars sold in the EU were produced
First half 2026 | Share of EU car sales by manufacturing origin
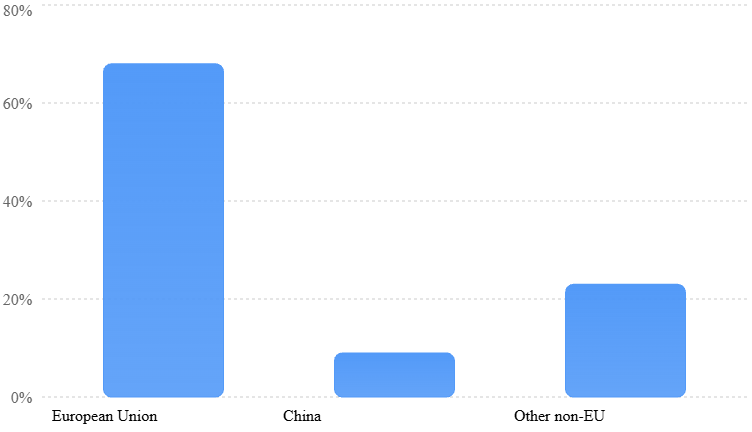
Source: ACEA, Economic and Market Report, October 2026. Other non-EU is the calculated residual (100 − 68 − 9), subject to rounding. Manufacturing origin is not brand ownership or battery-content origin.
The strategically significant feature is not the difference between the 22.7% BEV share and the 68% EU-production share, since those percentages describe different populations. It is that Europe is attempting a rapid powertrain transformation during a period when the domestic origin share of new vehicles is already weakening. Maintaining or increasing that origin share while significantly increasing the BEV share is the industrial achievement that policy should test.
For WordPress publication, the market comparison can be represented with the following self-contained HTML component, with the underlying percentages also available as an accessible table.
European Vehicle Transition — 2026
EU passenger-car registrations, January–September 2026. Scale: 0–100% of registrations.
| Powertrain | EU share |
|---|---|
| Conventional hybrids | 36.3% |
| Petrol and diesel | 28.2% |
| Battery electric | 22.7% |
| Plug-in hybrid | 10.1% |
Rounded shares do not sum to 100%. Other powertrains are not shown. These are registrations, not the composition of Europe’s total vehicle fleet.
Source: ACEA — 22 October 2026
Competing Explanations and Strategic Pathways
The current evidence supports three distinct, partially overlapping explanations of Europe’s automotive difficulties. They should not be treated as mutually exclusive. Regulatory requirements can influence investment decisions while external competition, international trade barriers and corporate execution simultaneously determine profitability.
| Hypothesis | Diagnostic support | Disconfirming evidence or limitation | Indicators | Current standing |
|---|---|---|---|---|
| H1 — Regulatory-commercial misalignment | BEVs account for 22.7% of EU registrations while hybrids retain the largest share; major manufacturers are adapting their product strategies | BEV registrations are growing rapidly, and current market share alone cannot establish that 2035 targets are unattainable | BEV affordability, fleet compliance costs, charging availability, future target revisions | Supported as a transition risk; causation not established |
| H2 — Structural competitive displacement | China-produced vehicles hold 9% of EU sales; EU car trade surplus falls 34.2%; Chinese battery manufacturing enjoys major scale and cost advantages | EU firms still retain substantial manufacturing capabilities; import growth does not establish permanent displacement | EU production-origin share, component trade, cell investment, supplier localisation | Strongly supported as an emerging industrial vulnerability |
| H3 — Corporate execution and external shocks | Volvo reports volume, pricing, currency, material-cost, tariff and associated-company effects; its electric share rises despite losses | One company’s results cannot establish conditions throughout Europe’s automotive sector | Product-launch performance, utilisation, EBIT by model, inventory and cash-flow recovery | Strongly supported for Volvo; broader applicability varies |
Assessment of the hypotheses
H1 provides a plausible explanation for why manufacturers face pressure to maintain combustion and hybrid product capabilities while financing electric platforms. The most important qualification is temporal: a 22.7% BEV share in September 2026 does not mathematically demonstrate failure in 2035. Market adoption is not linear, and future purchase prices, charging infrastructure, public incentives, energy prices and product availability can materially change the trajectory. Moreover, the Commission’s December 2025 revision proposal shows that regulatory flexibility is already part of the institutional discussion. European Automobile Manufacturers’ Association+1
H2 has the strongest direct support at the industry level. It is observable in production origin, imports, exports and battery-sector cost differentials. ACEA records a decline in the EU passenger-car trade surplus from €43.633 billion in H1 2025 to €28.715 billion in H1 2026, a contraction of €14.918 billion calculated from its published table. Imports from China reached €10.541 billion and 708,908 completed vehicles, but this does not capture the full dependence embedded in imported cells, battery materials or electronic components.
H3 is especially important in preventing a mistaken causal conclusion from Volvo’s financial results. The manufacturer attributes its earnings decline to several identifiable factors. Its report records a SEK 10.7 billion negative revenue effect from volume, SEK 3.5 billion from sales mix and pricing, and additional contributions from licensing, exchange rates and other items. The group’s earnings therefore cannot responsibly be represented as a direct financial measurement of the EU’s 2035 regulatory policy. attachment.news.eu.nasdaq.com
Net judgment: The evidence most strongly supports an interaction between structural competitive displacement and company-specific financial pressures, with regulatory-commercial misalignment acting as a material potential amplifier. The relative causal contribution of regulation remains insufficiently isolated.
Preliminary European Country Exposure
The industrial challenge will not be distributed evenly among European economies. ACEA’s H1 2026 production data identify important differences among Germany, France and Italy, while the United Kingdom must be assessed separately because it is outside the EU legislative and customs framework.
Selected EU manufacturing hubs — H1 2026
Passenger cars produced; year-on-year volume change
| Country | Production | Change | EU output share |
| Germany | 2,053,779 | −2.3% | 34.2% |
| France | 517,420 | +2.9% | 8.6% |
| Italy | 169,300 | +24.5% | 2.8% |
Source: ACEA, Economic and Market Report, Table 5, October 2026. Provisional production figures. Different national growth rates partly reflect different comparison bases.
Germany faces the largest absolute EU manufacturing exposure because it accounted for 34.2% of the Union’s passenger-car output in the first half of 2026. Its strategic question concerns the simultaneous preservation of high-value manufacturing, export competitiveness, suppliers and the engineering capacity required for the next generation of electric and software-defined vehicles.
France has an opportunity to expand its domestic electric manufacturing and battery ecosystem while protecting established vehicle-production centres. Its 2.9% first-half production increase offers a more positive short-term indicator than Germany’s contraction, although one semester cannot establish a sustained industrial recovery.
Italy presents a different vulnerability. Its 24.5% production increase in H1 2026 was measured against a particularly weak comparison period, while its share of EU passenger-car production remained only 2.8%. The strategic priority is therefore not simply to defend existing assembly volumes but to sustain supplier competencies, powertrain engineering, machinery, industrial automation and participation in future European production programmes. acea.auto
The United Kingdom is outside EU CO₂ legislation and operates its own automotive policy arrangements, but remains closely linked to European manufacturers and suppliers. ACEA identifies the UK as the leading third-country market for EU-manufactured passenger cars, with 663,063 vehicles sold there in H1 2026. The UK’s industrial choices and evolving market rules consequently influence EU manufacturers through exports, investment allocation and cross-border supply chains. acea.auto
These differences imply that a uniform European industrial intervention would be insufficient. Germany’s production concentration, France’s electrification investments, Italy’s component capabilities and the UK’s separate regulatory position require distinct national measures within a coherent European trade and industrial strategy.
Principal Gaps and Watch Indicators
The evidence is sufficient to establish present industrial pressure, but not to quantify future factory closures or employment displacement reliably. Numerical closure forecasts would require site-level production capacities, utilisation, model allocations, replacement-investment commitments, labour structures and cash-flow forecasts that the aggregate datasets do not provide.
The following indicators should determine whether the initial industrial-risk judgment strengthens or weakens.
| Indicator | Decision relevance | Material observation or threshold |
|---|---|---|
| EU-manufactured share of EU sales | Tests whether domestic production retains market participation | A sustained decline below the H1 2026 baseline of 68% would strengthen the displacement assessment |
| China-produced share of EU sales | Measures manufacturing-origin penetration | Continued growth above the H1 2026 baseline of 9%, particularly without equivalent EU-based investment |
| EU automotive trade surplus | Measures external trade deterioration | Further comparable declines from the €28.715bn H1 2026 surplus |
| BEV and hybrid registration shares | Tests regulatory-commercial convergence | BEV adoption, including affordable models, must accelerate without creating unsustainable manufacturer compliance costs |
| European battery-cell manufacturing | Distinguishes announced investment from competitive output | Operational production, manufacturing yield, cell costs and local material sourcing |
| Charging accessibility | Tests a central consumer adoption constraint | Reliable charger availability, utilisation, access for households without private parking and transparent charging prices |
| Vehicle profitability | Tests commercial sustainability of electrification | Model-level BEV margins, warranty costs, depreciation, capital intensity and plant utilisation |
| Employment and engineering capabilities | Tests irreversible industrial loss | Permanent site closures, supplier insolvencies, R&D relocation and loss of specialised personnel |
| Regulatory review outcome | Determines the future legal transition path | Enacted provisions, not merely proposals, particularly for 2030–2035 compliance and technology scope |
The five principal unresolved questions
The first is whether European BEV demand can expand sufficiently through lower purchase prices and charging improvements to reduce reliance on regulatory compliance incentives. The IEA’s 2026 outlook expects continued strong electrification, but projections remain conditional on policy, market conditions and technology costs. IEA
The second is whether increased European BEV sales will support European battery-cell production and upstream industrial value, or instead reinforce dependence on established Asian manufacturers. The IEA’s evidence that European battery production costs remain significantly above China’s makes this a commercial question as much as an investment-policy question. IEA
The third is whether future flexibility for plug-in hybrids and combustion technologies can be made compatible with verifiable emissions reductions. This requires distinguishing certified laboratory performance from actual vehicle usage and maintaining credible accounting for fuel-related emissions.
The fourth is whether European manufacturers can convert their existing supplier networks into competitive capabilities in power electronics, electrical systems, batteries and software without losing essential engineering capacity during the transition. This question is especially consequential for regional clusters whose specialised suppliers cannot finance a complete technological conversion independently.
The fifth is whether the EU can preserve an open, competitive vehicle market while countering distortive subsidies and reducing strategic concentration. The Commission’s anti-subsidy measures against Chinese battery-electric vehicle imports provide an existing trade-defence instrument, but tariffs on finished vehicles cannot by themselves establish European competitiveness throughout the battery supply chain. EU Imposes Duties on Unfairly Subsidised Electric Vehicles from China — European Commission — Oct 2024. Press release+1
Strategic Decision Framework
Three policy pathways emerge from the current evidence.
Regulatory continuity without sufficient industrial reinforcement would preserve the existing decarbonisation signal but place greater pressure on manufacturers and suppliers facing adverse economics. The principal risk would be increasing dependence on imported electric technologies and vehicles. This outcome is not inevitable: competitive European manufacturers could also benefit from clearer investment signals and faster electric adoption.
Broad regulatory relaxation without enforceable investment commitments would provide commercial breathing space to manufacturers with established combustion and hybrid portfolios. Its principal disadvantage would be the risk of delaying the creation of new electric manufacturing capabilities while Chinese competitors continue developing scale advantages. It could also weaken the predictability required for battery and charging investments.
Conditional regulatory flexibility combined with accelerated industrial investment offers the strongest potential balance. Under this pathway, EU institutions would preserve legally defined emissions outcomes while examining more flexible compliance sequencing, alongside measurable support for European battery production, affordable electric models, charging deployment and workforce conversion. The existing Commission proposal and Battery Booster provide foundations for such a programme, including a proposed €1.8 billion battery support envelope, of which €1.5 billion is designated for interest-free loans to European cell producers. The existence of announced funding, however, should not be equated with completed disbursements or demonstrated manufacturing competitiveness. European Commission+1
The decisive governance principle is that technology flexibility must be conditional on emissions integrity, while industrial support must be conditional on verifiable European productive capabilities. Neither policy instrument should function as an unconditional guarantee of corporate profitability.
The resulting strategic test is concrete: by 2031, Europe should be able to demonstrate not only a larger low-emission vehicle market, but also functioning battery and component supply chains, sustainable domestic vehicle production, competitively priced electric models and measurable retention or conversion of automotive engineering capabilities.
The current evidence establishes the urgency of that test. It does not yet establish which companies or plants will fail it, and no credible number of future closures can be derived solely from the figures presented here.
EUROPEAN AUTOMOTIVE SOVEREIGNTY
Regulatory transition, industrial competitiveness, Chinese manufacturing expansion and the Volvo Cars financial warning.
Strategic Intelligence Dashboard | Evidence cut-off: 28 October 2026 | EU focus with Germany, France, Italy and UK lenses
Europe may achieve a substantially more electric vehicle market while losing a growing proportion of the manufacturing, engineering, battery production and supply-chain value needed to produce those vehicles within Europe.
The evidence establishes a serious industrial risk, not proof that EU regulation alone caused current automotive losses.
01 — Strategic Indicators
Sources: ACEA, September 2026 registrations ; ACEA, Economic and Market Report, H1 2026 .
02 — The European Powertrain Divide
New passenger-car registrations | EU | January–September 2026
Scale: 0–40% of total new registrations. Bars use proportional widths and dimensional CSS shading; they are not perspective-distorted quantities. Published percentages are rounded. The displayed categories do not account for all registrations.
| Technology | Share | Implication |
|---|---|---|
| Conventional hybrid | 36.3% | Largest propulsion category |
| Petrol and diesel | 28.2% | Substantial continuing combustion demand |
| Battery electric | 22.7% | Growing but not dominant |
| Plug-in hybrid | 10.1% | Intermediate electric-combustion option |
03 — Who Manufactures the Cars Europe Buys?
Manufacturing-origin shares of cars sold in the EU | First half 2026
Scale: 0–80%. The 23% other non-EU category is calculated as 100 − 68 − 9 from rounded published figures. Origin refers to manufacturing location, not the nationality of the brand or the origin of battery cells and components.
04 — The Volvo Cars Profitability Paradox
Volvo’s fully electric sales share increased while group profitability deteriorated. The contrast identifies the difficulty of financing and operating the transition; it does not establish that electrification itself caused the loss.
Fully Electric Sales Share
Global retail deliveries, Q3
Scale: 0–40% share.
Consolidated Net Income
SEK billion; reported Q3 results
Column heights show absolute magnitudes on a 0–5.7bn SEK scale; colour and labels distinguish profit from loss. This is not a signed-axis chart.
| Indicator | Q3 2025 | Q3 2026 |
|---|---|---|
| Net result | +SEK 4.5bn | −SEK 5.7bn |
| Reported EBIT | +SEK 6.4bn | −SEK 5.6bn |
| Fully electric retail share | 22% | 32% |
| Revenue | Comparison base | SEK 66.9bn (−23%) |
| Global retail sales | Comparison base | 141,300 (−11%) |
Sources: Volvo Cars — Q3 2026 Interim Report ; Volvo Cars — Q3 2026 Results .
05 — Europe’s Automotive Trade-Surplus Erosion
Extra-EU passenger-car trade | First half 2026 versus first half 2025
H1 2025 Trade Surplus
Comparison-year surplus, calculated from the reported 2026 value and annual change.
H1 2026 Trade Surplus
A €14.918bn contraction, equivalent to approximately 34.2%.
Coverage: extra-EU passenger-car trade under HS 8703. Export and import values are monetary flows, not domestic value added or the complete automotive component trade balance.
Source: ACEA — Economic and Market Report, pp. 18–19, October 2026 .
06 — The Chinese Battery Cost and Capacity Advantage
Chinese battery-pack prices relative to European prices in 2025, according to the IEA’s regional comparison.
China’s share of global lithium-ion battery manufacturing capacity at the end of 2025.
High production volumes, manufacturing experience and capacity utilisation support competitive cost structures.
Cell production, materials, manufacturing processes and component integration shape the cost of electric vehicles.
Imported value may increase even where final vehicle assembly remains within European factories.
These relationships describe industrial mechanisms, not an independently quantified causal decomposition. The battery-price differential covers the IEA’s regional comparison and should not be treated as a universal cost difference for every cell chemistry or vehicle segment.
Source: IEA — Global EV Outlook 2026, Electric Vehicle Batteries .
07 — European Manufacturing Geography
Selected national passenger-car production | First half 2026
| Country | Vehicles | YoY change | EU share |
|---|---|---|---|
| Germany | 2,053,779 | −2.3% | 34.2% |
| France | 517,420 | +2.9% | 8.6% |
| Italy | 169,300 | +24.5% | 2.8% |
Protect major vehicle-production networks, high-value engineering and investment capacity during the electric transition.
Translate battery and electric-vehicle investment into sustained domestic output, competitive costs and employment.
Preserve component engineering, machinery, industrial automation and advanced manufacturing capabilities as vehicle architectures change.
Coordinate supply chains and investment across a separate national regulatory framework. UK production is intentionally excluded from the EU production comparison above.
Italy’s strong percentage increase should be interpreted against its lower comparison base. National production figures are not equivalent to national employment, profitability or domestic ownership of manufacturing facilities.
Source: ACEA — Economic and Market Report, Table 5, October 2026 .
08 — Regulatory Calendar Versus Industrial Reality
Regulation (EU) 2023/851 established a 100% fleet-wide tailpipe CO₂ reduction target for new cars from 2035.
The Commission proposed a revised 2035 framework involving a 90% reduction target and qualifying compensation arrangements.
BEV registrations represent 22.7% of EU demand through September, with hybrids remaining the largest category.
Sources: Regulation (EU) 2023/851 — EUR-Lex ; European Commission — Cars and Vans, Regulatory Framework .
09 — Industrial Strategy and Regulatory Choices
The following matrix is a qualitative policy assessment. It contains no invented probabilities, risk scores or numerical forecasts.
| Policy pathway | Potential benefit | Principal risk | Decision condition |
|---|---|---|---|
| Maintain regulatory rigidity | Preserves a strong emissions and investment signal | Industrial displacement if EU producers remain uncompetitive | Faster affordable BEV adoption and competitive EU supply |
| Broad regulatory relaxation | Short-term flexibility for established powertrains | Delayed investment and potential stranded combustion assets | Binding investment and emissions safeguards |
| Conditional technology flexibility | Aligns near-term demand with industrial conversion | Compliance complexity and dilution of emissions integrity | Verified emissions performance and defined review dates |
| Battery and charging investment | Addresses structural cost and adoption barriers | High capital requirements and execution risk | Operational capacity, competitive prices and reliable access |
| Targeted trade defence | Addresses demonstrable unfair competition | Retaliation, input-cost increases and supply-chain disruption | Evidence-based, proportionate measures |
| Industrial skills conversion | Retains engineering competencies and supplier networks | Mismatch between training and future production investment | Firm-level hiring, projects and measurable outcomes |
10 — The Industrial-Sovereignty Dependency Chain
The strategic outcome depends on the interaction of market demand, regulatory design, manufacturing economics and supply-chain location.
Fleet-emission requirements and market compliance incentives.
Affordability, charging, range and residual-value expectations.
Product margins, development expenditure, scale, financing and plant utilisation.
Cell manufacturing, materials, electronics and industrial sourcing.
Factories, supplier clusters, engineering employment and local production value.
Capacity to design, manufacture, service and export vehicles with manageable external dependencies.
These are connected policy and industrial dependencies, not a statistical causal model. Outcomes can improve or deteriorate at several points simultaneously.
11 — Strategic Monitoring: 2027–2031
| Indicator | 2026 reference | Warning observation |
|---|---|---|
| EU-manufactured share of EU sales | 68%, H1 2026 | Sustained decline from the baseline |
| China-produced share of EU sales | 9%, H1 2026 | Continued growth without corresponding EU investment |
| EU passenger-car trade surplus | €28.715bn, H1 2026 | Further comparable contraction |
| Battery-electric registration share | 22.7%, Jan–Sep 2026 | Weak uptake despite approaching compliance requirements |
| European battery industrial base | Material cost and capacity disadvantage | Delayed projects, low yields and continued import concentration |
| Supplier and plant continuity | No defensible aggregate closure forecast | Confirmed closures, divestments or engineering relocation |
| Volvo profitability | −SEK 5.7bn net result, Q3 2026 | Persistent losses despite higher EV penetration |
The observations above are decision signposts, not probability estimates or official policy thresholds. Future plant closures and job losses are intentionally not quantified without site-level evidence.
Decarbonisation Must Preserve Productive Capacity
The EU’s strategic objective should not be measured solely by the percentage of electric vehicles sold in its internal market.
A successful transition must also preserve the capacity to manufacture competitively priced vehicles, batteries, power electronics and advanced components within Europe.
The available 2026 evidence demonstrates that market electrification and industrial security are related but distinct outcomes. Volvo’s financial deterioration, China’s manufacturing expansion and the contraction of Europe’s automotive trade surplus expose the danger of treating higher EV registrations as sufficient evidence of industrial success.
The most defensible policy pathway combines credible emissions objectives, conditional technology flexibility, industrial investment, battery competitiveness, proportionate trade defence and measurable workforce conversion.
The essential test for 2031 is whether Europe is not only buying more low-emission vehicles, but remains capable of producing them.
PILLAR I — REGULATORY ARCHITECTURE, CONSUMER DEMAND AND THE VOLVO EVIDENCE
European Automotive Sovereignty: The Regulatory Calendar, the Economics of Electrification and the Industrial Cost of Transition
Academic Governance Edition V10-1 | Institutional Industrial-Strategy Assessment | Evidence cut-off: 28 October 2026
Chapter 1 — The European Regulatory Calendar: Binding Requirements, Revisions and the 2035 Transition
The European automotive transition has become a question of industrial sequencing, not merely environmental compliance
The European Union’s automotive regulatory framework was designed to establish a predictable reduction in transport emissions, accelerate investment in low-carbon technologies and direct an industrial sector with unusually long development cycles towards a progressively decarbonised product portfolio. Its underlying environmental rationale remains substantial: road transport consumes significant quantities of imported petroleum, internal-combustion vehicles generate operational greenhouse-gas emissions throughout their service lives, and new cars purchased during the next decade will continue operating long after the Union’s intermediate climate milestones. However, the practical functioning of the framework has exposed a fundamental tension between the legal calendar governing manufacturers’ future products and the commercial calendar determining when households, fleet operators and businesses are prepared to purchase those products at prices capable of sustaining profitable industrial production. The relevant political question is no longer whether electric propulsion can contribute materially to decarbonisation. It is whether the instruments selected to accelerate that contribution can maintain sufficient economic coherence across vehicle manufacturers, component suppliers, battery producers, charging operators, financial institutions and national manufacturing systems.
Regulation (EU) 2019/631 established the foundation of the EU’s modern manufacturer-level CO₂ performance regime for new passenger cars and light commercial vehicles. Regulation (EU) 2023/851 subsequently increased the required reductions, establishing a 55% reduction for new passenger cars and a 50% reduction for new light commercial vehicles for the 2030–2034 period, measured against the applicable 2021 fleet-wide reference targets, followed by a 100% reduction from 2035. These provisions constitute fleet-average tailpipe emissions requirements, rather than a prohibition on the ownership, circulation or resale of existing combustion-engine vehicles. Their economic influence nevertheless extends far beyond the vehicles registered in the years in which the standards apply, because manufacturers must determine platform investment, model replacement, production equipment and supplier contracts years before the relevant compliance deadlines. Regulation (EU) 2019/631 — European Parliament and Council — April 2019; Regulation (EU) 2023/851 — European Parliament and Council — April 2023.
This distinction between legal operation and industrial anticipation is central to understanding the present predicament. A regulation applying to the average emissions of vehicles registered in 2035 can influence the economic viability of combustion-engine investment in 2026 because an engine family, transmission platform or production facility requires substantial expenditure before generating revenue, and manufacturers must recover that expenditure across an expected volume of future production. A credible expectation that conventional combustion vehicles will become commercially constrained in the European new-car market after 2035 can therefore reduce the attractiveness of investing in new generations of engines and associated systems even before the legal endpoint is reached. Conversely, uncertainty about future amendments can discourage capital allocation to electric platforms and battery factories if investors believe that regulatory changes could reduce the future market demand on which their business cases depend. The resulting problem is one of investment coordination: the Union needs enough regulatory predictability to mobilise capital for electrification, but enough operational flexibility to prevent a temporary mismatch between consumer demand and regulatory requirements from destroying viable manufacturing capacity before replacement activities are fully established.
The legal architecture: what the European regulations require and what they do not
The starting point for rigorous assessment is to distinguish the three regulatory components that are often conflated in political debate: the fleet-emissions requirement, the compliance mechanism and the infrastructure obligations intended to make low-emission mobility commercially practical. Under the applicable framework, car manufacturers are assessed against specific average CO₂ emissions targets, subject to the governing calculation rules, adjustments and permissible pooling arrangements. The framework does not require each individual manufacturer’s vehicles to reproduce the Union-wide average in identical fashion. It establishes manufacturer-specific compliance obligations within a collective emissions-reduction trajectory. A manufacturer with significant electric sales can consequently achieve a different compliance result from one with a predominantly combustion-engine portfolio, even where both supply vehicles to the same national market.
The legal framework also attaches financial consequences to non-compliance. Article 8 of Regulation (EU) 2019/631 provides for an excess-emissions premium calculated at €95 for each gram of CO₂ per kilometre by which the applicable manufacturer average exceeds its target, multiplied by the number of newly registered vehicles included in the calculation. The important industrial consequence is not the abstract size of the statutory penalty but the effect of prospective compliance costs on pricing, product planning and manufacturing decisions. A producer expecting to exceed its average target may have incentives to discount zero-emission models, reduce deliveries of high-emission vehicles, change its product mix, enter a permissible emissions pool or alter the timing of registrations. These measures can improve legal compliance while simultaneously affecting profitability, particularly when incentives concentrate sales in lower-margin vehicles or when demand for electric models is insufficient to absorb the intended production volume. Regulation (EU) 2019/631, Article 8 — European Parliament and Council — April 2019.
The €95 formula illustrates the financial mechanism without requiring an unsupported estimate of actual sector-wide penalties. Under the original annual calculation logic, a hypothetical manufacturer registering 500,000 vehicles with an average excess of 5 g CO₂/km would face a theoretical premium of €237.5 million, before accounting for the specific period’s applicable compliance provisions. Doubling the excess to 10 g/km would double that illustrative amount to €475 million. Neither figure is a forecast of any actual manufacturer’s liability. The examples show why relatively small changes in measured fleet emissions can acquire material financial significance when multiplied across hundreds of thousands of registrations, and why regulatory flexibility can affect cash-flow management even when the underlying environmental target is retained.
Table 1.1 — The regulatory calendar and its distinct legal functions
| Instrument or milestone | Applicable period | Documented requirement or measure | Legal status at the analytical cut-off | Principal industrial consequence |
|---|---|---|---|---|
| Regulation (EU) 2019/631 | Continuing framework | Manufacturer-specific fleet-average CO₂ targets for new cars and vans | Binding regulation, as amended | Shapes product mix, emissions compliance and pricing |
| Regulation (EU) 2023/851 | 2030–2034 | 55% reduction for new passenger cars and 50% for new vans against applicable 2021 reference targets | Binding amendment | Creates an intermediate investment and compliance milestone |
| Regulation (EU) 2023/851 | From 1 January 2035 | 100% reduction in the applicable new-vehicle fleet-wide tailpipe CO₂ targets | Binding baseline, subject to any subsequent amendment | Strongly favours vehicles with zero regulated tailpipe emissions |
| Regulation (EU) 2025/1214 | 2025–2027 | Manufacturer compliance evaluated over a registration-weighted three-year period | Enacted and in force | Permits temporary variation in annual compliance outcomes |
| Regulation (EU) 2023/1804 | 2025 onward | Staged minimum deployment of alternative-fuels infrastructure | Binding regulation | Requires parallel charging infrastructure investment |
| Commission Automotive Package | Presented 16 December 2025 | Proposed 90% reduction framework from 2035 with qualifying compensation measures | Legislative proposal; not equivalent to enacted replacement | Offers potentially greater future product flexibility |
| Proposed 2030–2032 compliance flexibility | Subject to legislative adoption | Banking and borrowing provisions outlined in the Commission proposal | Proposed | Could improve intertemporal manufacturer compliance management |
| Proposed Battery Booster | Announced December 2025 | €1.8 billion support package, including €1.5 billion proposed for interest-free cell-production loans | Announced policy and financing initiative | Seeks to address European battery-production competitiveness |
Sources: Regulation (EU) 2023/851 — European Parliament and Council — April 2023; Regulation (EU) 2025/1214 — European Parliament and Council — June 2025; Regulation (EU) 2023/1804 — European Parliament and Council — September 2023; Automotive Package — European Commission — December 2025.
The most consequential legislative development prior to the 2026 assessment is Regulation (EU) 2025/1214, adopted on 17 June 2025 and entering into force on 9 July 2025. It introduced an important modification to the compliance architecture for the calendar years 2025–2027. Rather than assessing the relevant obligation independently for each year under the previous annual approach, the amendment permits compliance to be determined over the three-year period using registration-weighted emissions and target calculations. The change matters because it allows manufacturers with a relatively difficult initial year to compensate through better performance later in the period, provided that their aggregate result satisfies the applicable formula. It therefore creates a temporal adjustment mechanism without cancelling the emissions obligation itself. Regulation (EU) 2025/1214 — European Parliament and Council — June 2025.
The economic value of this flexibility is particularly evident for manufacturers introducing electric models during a period of uneven customer adoption. A new electric platform may require substantial initial investment, encounter supply limitations during early production and reach its commercial volume only after successive manufacturing improvements. Under strict annual compliance, that temporary progression can create penalties or expensive pricing adjustments even if the manufacturer’s portfolio is on a credible path towards its medium-term emissions target. A multi-year calculation reduces the importance of a single annual shortfall and can preserve financial resources for subsequent electric production. The qualification is that flexibility cannot repair a structural failure of market demand or product competitiveness. If a manufacturer’s electric models remain persistently unattractive to customers, averaging compliance over several years postpones the financial consequences rather than eliminating the underlying problem.
The December 2025 Automotive Package: revision, flexibility and the distinction between proposal and law
The European Commission’s Automotive Package, presented on 16 December 2025, marked an institutional recognition that the original regulatory architecture required adjustment to the industry’s economic and technological circumstances. The Commission proposed a revised framework under which manufacturers would face a 90% tailpipe-emissions reduction target from 2035, with the remaining emissions addressed through specified compensation mechanisms involving qualifying low-carbon steel produced within the Union or eligible renewable fuels, including e-fuels and biofuels. The proposal also envisaged the continued role of plug-in hybrids, range-extender vehicles, certain hybrid architectures and combustion-engine vehicles alongside battery-electric and hydrogen vehicles. Additional proposals included super-credits for small affordable electric vehicles manufactured in Europe and banking-and-borrowing flexibility for the 2030–2032 compliance period. Automotive Package — European Commission — December 2025; Cars and Vans: Proposed Revision of CO₂ Standards — European Commission — December 2025.
This adjustment does not amount to an abandonment of European electrification. A 90% fleet-wide reduction, even with the proposed compensation architecture, would still require a transformation of the new-car market far beyond its 2026 composition. It would nevertheless alter the investment incentives facing manufacturers by creating a potential role for specific technologies that could otherwise have limited commercial prospects in the post-2035 European market. The fundamental governance issue concerns whether the retained flexibility is designed as a narrowly defined instrument for managing technological and commercial exceptions or as a mechanism that effectively weakens the environmental requirement. The distinction matters for climate integrity, competition and legal certainty. A hybrid or combustion vehicle’s continued eligibility should be assessed through the exact applicable accounting mechanism rather than an assumption that every such vehicle is equivalent to a zero-emission alternative.
The proposed compensation involving European low-carbon steel deserves separate examination because it links vehicle regulation to another industrial sector facing decarbonisation costs and international competition. As an industrial-policy instrument, it could create demand for lower-emission European materials and potentially encourage vehicle manufacturers to strengthen regional procurement. As an emissions-accounting instrument, however, the substitution requires particular scrutiny. A reduction in the embodied emissions of a vehicle’s steel inputs and a reduction in emissions generated by the vehicle during operation are different environmental quantities. Their equivalence cannot simply be assumed. A credible framework therefore requires transparent boundaries, defensible emissions factors, prevention of double counting, independent verification and a clear explanation of how compensating reductions contribute to the Union’s broader climate objectives.
Equally important is the proposal’s treatment of renewable fuels. Synthetic fuels and qualifying biofuels may have applications in vehicles and industrial systems where direct electrification is difficult, but their climate value depends on production pathways, energy inputs, feedstocks, sustainability criteria and actual lifecycle emissions. A technology-neutral framework that counts every alternative fuel as equally beneficial would not constitute robust neutrality; it would conceal substantive differences in environmental performance. Conversely, a framework that excludes alternative technologies without examining their verifiable emissions effects risks unnecessarily narrowing industrial options. The correct analytical distinction is between neutrality in permitted engineering solutions and rigour in the measurement of environmental outcomes.
The infrastructure obligation: an essential condition of credible vehicle regulation
Vehicle regulation cannot be assessed independently of the physical infrastructure required to support mass adoption. Regulation (EU) 2023/1804 on the deployment of alternative-fuels infrastructure establishes binding obligations intended to address this problem. For light-duty electric vehicles along the core trans-European transport network, the regulation requires publicly accessible charging pools at maximum intervals of 60 kilometres in each travel direction, subject to specified conditions and derogations. Its staged requirements include a minimum pool output of 400 kW with at least one 150 kW charging point by 31 December 2025, increasing to 600 kW with at least two 150 kW points by 31 December 2027. The comprehensive TEN-T network is subject to a separate phased deployment schedule, including defined coverage and capacity requirements. Regulation (EU) 2023/1804, Article 3 — European Parliament and Council — September 2023.
These numerical requirements demonstrate that the Union has not imposed emissions targets without recognising infrastructure as a complementary obligation. They do not, however, prove that national charging systems already provide equivalent consumer convenience across the Union. A corridor-based minimum can improve long-distance travel without solving the absence of accessible overnight charging in densely populated residential districts. Likewise, installed nominal charging capacity does not necessarily measure real-world availability, charging speed under simultaneous use, reliability, queueing times or electricity prices. For households with private parking, battery-electric operation can be materially more convenient than for households relying on public kerbside charging; the same nominal national density of charging points can therefore produce very different consumer experiences depending on residential structure, distribution-network capacity and geographical location.
The commercial effect is consequential because the vehicle purchaser does not evaluate regulatory milestones but expected ownership costs and practical inconvenience. A manufacturer may produce a technically competitive electric vehicle while facing inadequate demand in territories where reliable charging is scarce or costly. The corresponding financial risk then returns to the manufacturer’s product margins and plant utilisation, even though the infrastructure shortfall lies partly outside its direct control. Regulatory design must therefore avoid assigning the entire financial burden of delayed infrastructure deployment to vehicle producers while leaving other responsible institutions insufficiently accountable for the complementary investments.
Table 1.2 — Charging obligations and industrial transmission mechanisms
| Infrastructure requirement | Regulatory milestone | Consumer or operating problem addressed | Remaining implementation challenge |
|---|---|---|---|
| TEN-T core charging-pool spacing | Maximum 60 km, subject to regulatory conditions | Long-distance charging availability | Actual uptime, location and motorway accessibility |
| Core-network charging capacity | At least 400 kW per pool by end-2025 | Minimum rapid-charging provision | Shared capacity and congestion |
| Core-network expanded capacity | At least 600 kW per pool by end-2027 | Higher utilisation as BEV fleets expand | Grid connection and multi-vehicle demand |
| High-power individual charging points | At least one 150 kW point initially; at least two by end-2027 | Faster charging during long trips | Vehicle charging curves and real-world delivered power |
| Comprehensive-network deployment | Progressive requirements through 2027–2035 | Wider territorial connectivity | Uneven regional execution |
| Ad-hoc payment arrangements | Requirements under Article 5 | Consumer access without restrictive subscriptions | Payment reliability and transparent tariffs |
Source: Regulation (EU) 2023/1804, Articles 3 and 5 — European Parliament and Council — September 2023.
The economic-security implications of regulatory uncertainty
From an industrial-governance perspective, the interaction between regulatory rigidity and repeated political revision produces two opposite forms of risk. An inflexible timetable can place manufacturers under financial pressure when market adoption does not advance at the expected rate. This pressure can be transmitted through discounts, reduced margins, accelerated depreciation of combustion-related investments and restructuring of supplier contracts. Yet repeated weakening of the timetable can also damage the credibility of the regulatory signal supporting investment in battery plants, charging networks, vehicle platforms and industrial conversion. Capital invested in an electric production facility cannot necessarily be transferred economically into unrelated manufacturing merely because the expected market has been postponed. The challenge is therefore to preserve a stable direction of travel while creating adjustment mechanisms that respond to measurable circumstances rather than short-term political bargaining.
The relevant test is whether a proposed amendment reduces overall system costs without transferring additional costs to another part of the system. Greater flexibility for combustion and hybrid vehicles may protect certain plants and suppliers temporarily, but it can also reduce the utilisation of new battery factories if electric demand weakens. Conversely, strict electric requirements can support cell investment and scale economies but place pressure on manufacturers importing expensive batteries while competing with lower-cost producers. The aggregate effect cannot be inferred from the regulatory text alone. It requires examining investment, employment, productivity, vehicle prices, emissions performance and the origin of industrial value added.
The Commission’s proposed Battery Booster, with €1.8 billion in support and €1.5 billion designated for interest-free loans to European battery-cell producers, reflects the recognition that electrification cannot be treated exclusively as a vehicle-demand problem. The framework seeks to intervene in the industrial supply chain that determines whether increased electric sales translate into competitive European production. Yet the announced amount must be interpreted as a proposed support envelope rather than evidence of realised production capacity. Financial assistance improves the conditions for investment only if projects achieve commercially viable production yields, competitive manufacturing costs, reliable orders and sustainable financing beyond the initial public intervention. Automotive Package — European Commission — December 2025.
Chapter 1 — Key judgments
The European regulatory framework contains binding long-term emissions obligations, an enacted 2025–2027 compliance flexibility mechanism and a broader revision proposal designed to accommodate industrial realities. Its most serious vulnerability does not arise solely from the ambition of its climate objective, but from the possibility that the required vehicle transformation proceeds on a timetable inconsistent with charging availability, consumer affordability, manufacturing economics and European battery competitiveness. The Commission’s proposed revision acknowledges the problem, but its effectiveness will depend on legislative design, administrative predictability and verification of emissions outcomes.
What would change the assessment: Evidence of sustained affordable BEV uptake, improving European manufacturer margins, operational battery-cell investments and reliable charging infrastructure would weaken the case for further regulatory adjustment. Conversely, repeated manufacturer compliance difficulties accompanied by permanent industrial capacity reductions and weak charging deployment would strengthen the case for more substantial sequencing changes.
Open official record: The decisive instruments are the final adopted legal text of any revision to Regulation (EU) 2019/631, subsequent Commission compliance determinations, the implementation record of Regulation (EU) 2023/1804 and actual Battery Booster commitments and disbursements. A legislative proposal must not be treated as enacted law.
Chapter 2 — Market Adoption and Consumer Economics: Battery Electric, Hybrid and Combustion Technologies
Consumer demand reveals a transition governed by affordability, infrastructure and the economics of vehicle ownership
The principal finding of the second chapter is that the European consumer market is not resisting electrification as a technological category; rather, it is differentiating between propulsion systems according to purchase price, practical convenience, expected operating costs and financial exposure. This differentiation explains why battery-electric vehicles can experience rapid registration growth while conventional hybrids retain a larger share of the market, and why the progressive decline of petrol and diesel registrations does not automatically translate into an equivalent expansion of pure-electric demand. For manufacturers, the distinction is fundamental because compliance with emissions regulation depends on changing the composition of new-vehicle deliveries, whereas commercial profitability depends on selling that composition at prices that recover production, development, financing and distribution costs.
The European Automobile Manufacturers’ Association reported on 22 October 2026 that EU passenger-car registrations increased by 5.7% over the first nine months of the year. Within that expanding market, battery-electric registrations reached 1,931,465 vehicles, representing 22.7% of new registrations compared with 16.1% during the corresponding period of 2025. The increase of 6.6 percentage points is substantial, equivalent to approximately 41% growth in market share relative to the previous share level, although that latter calculation must not be confused with registration-volume growth. Over the same period, conventional hybrid registrations reached 3,090,530 vehicles, giving that category a 36.3% share, while plug-in hybrids accounted for 860,257 vehicles and 10.1% of registrations. Petrol vehicles represented 21.2% and diesel vehicles approximately 7.1%, compared with 27.7% and 9.3% respectively one year earlier. These movements establish that the internal-combustion market is contracting, that electrified alternatives are expanding and that the largest category of demand nevertheless remains conventional hybrid technology rather than exclusively battery-electric propulsion. New Car Registrations: September 2026 Year-to-Date — ACEA — October 2026.
The significance of the figures lies not simply in the ranking of propulsion types but in the industrial characteristics of the technologies involved. A conventional hybrid retains an internal-combustion engine, fuel-delivery system, exhaust after-treatment equipment and substantial mechanical engineering content, while adding an electric propulsion component and associated control systems. A plug-in hybrid requires a larger electrical system, external charging capability and a battery whose size and operating characteristics differ materially from those of a conventional hybrid. A battery-electric vehicle eliminates the combustion engine and many associated systems while introducing a larger traction battery, electric powertrain, charging architecture and different thermal-management requirements. These distinctions mean that market movements between propulsion categories alter demand across the entire manufacturing supply chain. A shift from petrol to conventional hybrids can preserve a significant proportion of traditional engine-related production while increasing electric-component demand; a shift from conventional hybrids to BEVs can reduce demand for multiple mechanical subsystems while increasing demand for battery cells and power electronics. The effects on employment and investment consequently depend not only on whether vehicles are classified as electrified but on which technologies they actually contain and where those technologies are manufactured.
The importance of preserving separate statistical definitions
The term electrified vehicle is frequently used in commercial disclosures to combine battery-electric vehicles, plug-in hybrids and, depending on the issuer, certain conventional hybrid vehicles. That terminology can be legitimate for describing a manufacturer’s product range, but it creates considerable analytical ambiguity when used interchangeably with battery-electric market share. A vehicle with a small traction battery and no external charging capability has different emissions, energy consumption, battery demand and manufacturing characteristics from a vehicle that relies exclusively on electricity stored in a large rechargeable battery. Similarly, a plug-in hybrid’s actual emissions depend partly on the frequency with which it is charged and operated electrically, rather than exclusively on its certified laboratory performance.
The statistical categories must therefore remain separate when evaluating the regulatory trajectory. The Union’s future tailpipe CO₂ targets are not satisfied merely because a vehicle incorporates an electric motor. Equally, the presence of a combustion engine does not automatically imply identical emissions among conventional petrol cars, efficient hybrids and plug-in hybrids. Manufacturer compliance is determined through the applicable regulated emissions calculations, while real-world climate performance requires a broader assessment of energy use and operating behaviour. Confusing those questions can exaggerate either the speed of decarbonisation or the apparent commercial resistance to it.
Table 2.1 — The detailed structure of EU new-car demand
| Propulsion category | January–September 2026 registrations | 2026 market share | Comparable 2025 share | Market-share movement | Principal interpretation |
|---|---|---|---|---|---|
| Battery electric | 1,931,465 | 22.7% | 16.1% | +6.6 percentage points | Strong increase in pure-electric demand |
| Conventional hybrid | 3,090,530 | 36.3% | Not stated in the cited summary | Not calculated | Largest propulsion category |
| Plug-in hybrid | 860,257 | 10.1% | 9.0% | +1.1 percentage points | Growing intermediate category |
| Petrol | 1,802,078 | 21.2% | 27.7% | −6.5 percentage points | Rapid decline in conventional petrol demand |
| Diesel | Approximately 7.1% of registrations | 7.1% | 9.3% | −2.2 percentage points | Continuing contraction |
| Petrol and diesel combined | Approximately 28.2% | 28.2% | 36.9% | −8.7 percentage points | Lower conventional-combustion penetration |
Source: New Car Registrations: September 2026 Year-to-Date — ACEA — October 2026.
The table preserves ACEA’s published rounded values. The petrol and diesel combined share should be taken from the association’s directly reported 28.2% figure rather than mechanically summing 21.2% and 7.1% to produce 28.3%, because individually rounded percentages need not reproduce a separately calculated aggregate. The table also does not invent the previous year’s conventional-hybrid share merely to complete a comparison. This treatment is important for a report intended to inform institutional decisions: apparently minor rounding and classification differences can become material when they are used as inputs into industrial investment or regulatory-compliance models.
The geography of adoption: a common regulatory framework does not create a homogeneous market
The EU’s largest national vehicle markets show markedly different rates of change, despite operating under the same overarching manufacturer-emissions regime. ACEA’s January–September 2026 figures identify battery-electric registration growth of 79.1% in France and 58.1% in Germany, while Denmark recorded growth of 40.3% and Belgium 15.7%. By contrast, the strongest reported increases in conventional hybrid registrations among the highlighted markets occurred in Italy, at 20.8%, and Spain, at 20.5%, while Germany recorded 4.9% and France only 0.6%. Plug-in hybrids exhibited a different pattern again, expanding by 72.4% in Italy, 34.7% in Spain and 13.7% in Germany. These are year-on-year changes in registrations for particular propulsion categories, not the corresponding national market shares, and they should not be interpreted as showing that one country has necessarily achieved a higher absolute electrification level than another. New Car Registrations: September 2026 Year-to-Date — ACEA — October 2026.
What the figures establish is that European households and businesses are responding to different national combinations of product availability, taxation, purchase incentives, purchasing power, charging conditions and vehicle-use patterns. France’s strong battery-electric growth suggests that pure-electric demand can accelerate substantially within the existing regulatory environment, while Italy’s stronger increases in conventional and plug-in hybrids demonstrate that the transition is not following an identical technological pathway everywhere. Germany’s simultaneous increases in battery-electric and conventional hybrid registrations likewise indicate that rising BEV demand does not immediately eliminate demand for technologies that retain combustion engines. A uniform EU-wide market-share figure therefore conceals important national differences in the financial and operational conditions under which vehicle purchasers make decisions.
Table 2.2 — Selected national propulsion trends, January–September 2026
| Country | Battery-electric registrations, year-on-year | Conventional hybrids, year-on-year | Plug-in hybrids, year-on-year | Relevant demand signal |
|---|---|---|---|---|
| Germany | +58.1% | +4.9% | +13.7% | Strong BEV acceleration alongside continuing hybrid demand |
| France | +79.1% | +0.6% | Not specified in the cited summary | Particularly rapid BEV expansion |
| Italy | Not specified in the cited summary | +20.8% | +72.4% | Strong growth in hybrid and plug-in hybrid categories |
| Spain | Not specified in the cited summary | +20.5% | +34.7% | Broad growth in intermediate electrified technologies |
| Denmark | +40.3% | Not specified in the cited summary | Not specified in the cited summary | Sustained BEV expansion |
| Belgium | +15.7% | Not specified in the cited summary | Not specified in the cited summary | More moderate BEV growth among the highlighted markets |
Source: New Car Registrations: September 2026 Year-to-Date — ACEA — October 2026.
These national movements have direct regulatory implications because manufacturer strategies must respond to an EU compliance framework while operating across markets with different adoption rates. A producer capable of selling large numbers of BEVs in one country may still depend on hybrids or conventional vehicles in another. The geographic allocation of inventory, pricing and product introductions therefore becomes an element of emissions-compliance management as well as ordinary commercial strategy. Manufacturers with broad geographical distribution may use stronger electric markets to support their overall compliance position, while manufacturers concentrated in markets with slower BEV adoption face a different operational challenge. This mechanism can influence the competitive balance among manufacturers even where their underlying vehicle technologies are similar.
Purchase-price affordability and the limits of operating-cost arguments
The most immediate obstacle to mass-market battery-electric adoption is not necessarily the theoretical lifetime cost of the vehicle, but the relationship between its initial purchase price, available financing, expected depreciation and household liquidity. An electric vehicle can offer lower energy expenditure per kilometre and fewer routine mechanical servicing requirements while remaining commercially unattractive to a purchaser who cannot finance the initial price difference or who expects to replace the vehicle before the operating-cost advantage is recovered. The relevant economic variable is therefore total cost of ownership, but the consumer’s willingness and capacity to pay depend on the distribution of costs through time, not only their eventual sum.
This distinction helps explain why government purchase incentives can substantially influence short-term registrations without establishing that the underlying market has become independently self-sustaining. A subsidy reduces the apparent acquisition cost to the buyer, but it does not necessarily reduce the manufacturing cost of the vehicle or improve the manufacturer’s structural profitability. Depending on market competition, part of the benefit can be transmitted into demand, pricing, dealer margins or manufacturer revenue. If incentives are withdrawn before battery costs and production economies have improved sufficiently, the consumer may again face a material purchase-price premium. The effectiveness of subsidy policy should consequently be assessed by whether it creates durable economies of scale and lower prices, rather than exclusively by registrations during the incentive period.
The International Energy Agency’s Global EV Outlook 2026 provides important context. It reports that 70% of battery-electric cars sold in China in 2025 were priced below the average conventional car in that market, reflecting the extent to which Chinese electric-vehicle economics have improved in particular segments. The IEA also notes that European manufacturers introduced more affordable electric models and adjusted pricing strategies in response to tightening emissions requirements. These observations demonstrate that affordability is neither an immutable characteristic of battery-electric technology nor a problem that can be resolved exclusively through regulation. It depends on product design, battery chemistry, manufacturing scale, supply chains and competitive conditions. Global EV Outlook 2026, Executive Summary — International Energy Agency — 2026.
The policy question for Europe is whether affordable BEVs can increasingly be supplied by competitive European manufacturing operations. If lower consumer prices are achieved predominantly through imports, the environmental objective may advance while domestic industrial value added remains under pressure. If prices fall because European producers improve cell procurement, component integration, platform efficiency and manufacturing productivity, electrification can reinforce both consumer welfare and industrial capacity. The distinction cannot be identified from registration statistics alone. It requires linking sales by model and price segment to manufacturing origin, supply-chain content and producer economics.
Battery capacity, vehicle range and the economics of charging convenience
Range anxiety is often described as a psychological obstacle, but for many purchasers it represents a rational evaluation of operating flexibility under uncertain conditions. A household purchasing one vehicle for commuting, occasional long-distance journeys and unpredictable family needs evaluates the ability to complete journeys without substantial delay or dependence on a charging network whose coverage and reliability vary geographically. The relevant measure is not merely certified maximum driving range, but expected usable range under different temperatures, speeds, loads and charging conditions, together with the probability of finding a functioning charger when required.
Larger batteries can reduce concerns about driving range but increase vehicle mass, material demand and manufacturing costs. Smaller batteries can support lower purchase prices and reduced resource use but require greater confidence in the charging system. This creates an important relationship between infrastructure policy and vehicle industrial economics: a reliable and accessible charging network can make smaller-battery vehicles commercially viable, potentially lowering the amount of battery capacity required per vehicle and improving affordability. Conversely, inadequate charging infrastructure can encourage consumers to demand larger batteries, increasing the capital cost of electric vehicles and potentially worsening the cost disadvantage of manufacturers that procure expensive cells.
The economic-security consequences extend into electricity infrastructure. A vehicle manufacturer’s investment horizon may be measured in model generations, whereas grid reinforcement, new high-power connections and residential charging deployment depend on utilities, regulators, municipalities and property owners. Delays in these systems can reduce demand for electric vehicles even when factories are prepared to supply them. The resulting problem is not purely one of charging-point counts; it concerns the coordination of electricity-network investment, reliable service provision, land access and transparent retail charging prices.
Residual value, leasing and the transmission of technological uncertainty into finance
Vehicle residual values are particularly important because a significant part of the European new-car market is financed through leasing, company-car arrangements and products that incorporate an assumed resale value. Where future used-electric-vehicle prices are uncertain, lessors and financing institutions may require more conservative residual-value assumptions. This can increase monthly payments even if the manufacturer’s advertised list price is unchanged, reducing consumer demand and creating pressure for manufacturer incentives. Conversely, stronger confidence in used-BEV demand and battery durability can improve lease economics without requiring an equivalent reduction in manufacturing costs.
Residual-value uncertainty is linked to the pace of technological development. Improvements in charging capability, battery cost, efficiency and vehicle software can enhance the attractiveness of new electric models while potentially reducing the relative desirability of older ones. This effect does not mean that electric vehicles necessarily depreciate faster in every market or period; it means that a rapidly changing technology can complicate the estimation of future resale value. Effective battery-health information, transparent warranty conditions, repairability and predictable software support can reduce that uncertainty.
The resulting financial exposure is frequently underestimated in discussions that focus exclusively on purchase subsidies. For a manufacturer selling through lease and fleet channels, electric-vehicle profitability may depend not only on the margin realised at initial delivery but also on financing support, guaranteed residual values and the distribution of depreciation risk between the manufacturer and its commercial partners. An increase in BEV registrations accompanied by weak residual values and aggressive financing incentives can therefore create a less favourable profitability outcome than registration growth alone would suggest.
Why hybrid technology remains economically relevant
Conventional and plug-in hybrids perform different functions in the consumer market and should not be treated as one transitional category. Conventional hybrids can reduce fuel consumption in suitable operating conditions without requiring the buyer to install charging equipment or change refuelling habits. They are particularly attractive where purchase-price sensitivity is high and charging access is uncertain. Plug-in hybrids offer the possibility of electric operation for shorter journeys while retaining combustion propulsion for longer travel, but their environmental and economic performance depends heavily on actual charging behaviour.
For manufacturers, hybrids can provide intermediate demand while electric production capacity expands. They can also sustain revenues from existing manufacturing assets, permitting part of the cash flow to support development of new electric platforms. That argument has financial merit only where the resulting hybrid programmes generate sufficient returns and do not absorb excessive development capital that would otherwise support future competitiveness. A strategy based on repeated investment in new combustion architectures without a credible transition to low-emission manufacturing can produce stranded assets rather than genuine resilience.
Plug-in hybrids create an additional regulatory question because certified emissions can differ materially from actual use when vehicles are rarely charged or operated electrically. A policy granting substantial compliance advantages to plug-in hybrids must therefore account for real-world emissions performance, rather than assuming that laboratory efficiency is representative of every ownership pattern. More accurate monitoring and accounting would allow governments to preserve legitimate technological flexibility without overstating environmental benefits.
The distinction between a market trend and a forecast
The first nine months of 2026 demonstrate that EU battery-electric adoption is accelerating, but they do not establish a definitive trajectory for 2030 or 2035. The IEA’s 2026 outlook provides a forward-looking counterweight to interpretations based exclusively on present market share. Its published scenarios suggest that electric cars could exceed 90% of European sales by 2035 even under the Commission’s proposed revised framework, although the precise outcome depends on policy implementation, future prices and market development. This is a model-based outlook rather than an observed result. The IEA’s broader European electric-vehicle statistics also include plug-in hybrids in important comparisons and use geographical definitions that may differ from ACEA’s EU-only BEV series. Global EV Outlook 2026, Executive Summary — International Energy Agency — 2026.
The proper analytical conclusion is therefore neither that the Union’s 2035 objectives have already become impossible nor that current growth guarantees their achievement. The decisive question is whether the growth required between 2026 and 2035 can be achieved through commercially sustainable sales and production rather than progressively more expensive compliance interventions.
A transparent arithmetic illustration demonstrates the magnitude of the challenge without pretending to forecast it. If battery-electric vehicles were required to reach 90% of new registrations by 2035, starting from the 22.7% share observed in January–September 2026, the required increase would be 67.3 percentage points. Spread evenly over nine annual intervals, this corresponds to approximately 7.5 percentage points per year. Reaching 100% would require a 77.3-point increase, equivalent to approximately 8.6 points per year under the same linear assumption. Neither calculation represents an official regulatory forecast or a realistic market-adoption model; it merely identifies the scale of the transformation implied by the selected endpoints. Actual adoption is likely to vary through time and may accelerate as lower-priced models, charging access and manufacturing scale improve.
Table 2.3 — Illustrative battery-electric adoption arithmetic
| Endpoint assumption | Starting BEV share | Assumed endpoint | Required increase | Linear annual average, nine intervals | Analytical limitation |
|---|---|---|---|---|---|
| High-electrification scenario | 22.7% | 90% | 67.3 percentage points | Approximately 7.5 points | Illustrative, not a legal BEV quota |
| Complete BEV adoption scenario | 22.7% | 100% | 77.3 percentage points | Approximately 8.6 points | Excludes other qualifying zero-tailpipe technologies |
| Current-year observed change | 16.1% in 2025 | 22.7% in 2026 | 6.6 percentage points | Not applicable | Comparable nine-month periods, not full calendar years |
Inputs: New Car Registrations: September 2026 Year-to-Date — ACEA — October 2026. The first two rows are arithmetic scenarios constructed from the observed 2026 share; they are not Commission forecasts.
Chapter 2 — Key judgments
The European market demonstrates substantial progress towards electrification, but its technological composition remains diverse because consumers face materially different economic and practical conditions. Conventional hybrids are not merely an indication of resistance to electric technology; they also reflect the continuing relevance of affordability, charging access and vehicle-use flexibility. Plug-in hybrids occupy a distinct intermediate position whose environmental value depends on actual charging behaviour. The industrial challenge is to convert the expanding demand for electric propulsion into sustainable investment and production within Europe, rather than interpreting registrations alone as evidence of a successful manufacturing transition.
What would change the assessment: Sustained reductions in transaction prices and financing costs for European-produced BEVs, stronger used-electric residual values, reliable public and residential charging and declining dependence on purchase subsidies would support faster market convergence. Persistent differences in affordability and charging access, combined with hybrid demand remaining structurally strong, would strengthen the case for carefully designed transitional flexibility.
Open official record: The next required evidence consists of comparable national transaction-price data, public-charging reliability and tariff statistics, model-level residual-value information, real-world plug-in-hybrid usage measurements and manufacturing-origin data reconciled with propulsion categories.
Chapter 3 — Volvo Cars Q3 2026: Financial Deterioration, Electrification and Industrial Restructuring
Volvo’s third-quarter results expose the difference between technological progress and financially sustainable transformation
The central judgment of this chapter is that Volvo Cars’ third-quarter 2026 deterioration demonstrates a breakdown in the assumption that higher battery-electric penetration necessarily produces stronger corporate economics, but does not demonstrate that electrification itself is the principal cause of the deterioration. The company’s performance is more accurately understood as the interaction of weaker vehicle volumes, adverse product pricing and sales mix, difficult international markets, external cost pressures and the financial commitments associated with a major industrial transformation. Its relevance to European policy lies in the mechanism through which those pressures can undermine the capacity of manufacturers to finance the investments required by the regulatory transition.
On 23 October 2026, Volvo Cars reported consolidated third-quarter revenue of SEK 66.9 billion, compared with SEK 86.4 billion in the corresponding period of 2025, a contraction of approximately 23%. Reported operating income deteriorated from a positive SEK 6.4 billion to a negative SEK 5.6 billion, while the reported operating margin moved from 7.4% to −8.4%. On the company’s adjusted measure excluding the share of income in joint ventures and associates and items affecting comparability, operating income declined from SEK 5.8 billion to a loss of SEK 3.7 billion, and the corresponding margin shifted from 6.7% to −5.6%. The consolidated net result moved from a SEK 4.5 billion profit to a SEK 5.7 billion loss. These are financially material movements that cannot be adequately described simply as a temporary reduction in sales growth or a short-term fluctuation in the proportion of electric vehicles sold. They represent simultaneous deterioration in revenue generation, operating profitability and the group’s final earnings outcome. Volvo Cars Q3 2026: Taking Decisive Action to Navigate a Very Tough Environment — Volvo Cars — October 2026.
The deterioration occurred while Volvo increased its electric-vehicle penetration. Fully electric vehicles represented 32% of global retail sales during the third quarter, compared with 22% one year earlier, an increase of ten percentage points. The company’s broader electrified share reached 53%, compared with 46% in the corresponding period of 2025. The apparent contradiction is analytically important because it undermines a simplified narrative in which electric-vehicle adoption, industrial modernisation and profitability advance automatically together. Electrification can progress at the level of sales composition while consolidated financial performance deteriorates if total volumes decline, average revenue weakens, product costs remain high or external market conditions become less favourable. Volvo Cars Q3 2026 Results — Volvo Cars — October 2026.
The opposite inference would be equally inappropriate. Volvo’s loss does not establish that electric vehicles are structurally unprofitable or that a return to combustion-engine products would restore the group’s previous earnings. The company’s official disclosure identifies multiple contributing factors, including developments in China and the United States, changes in sales mix, raw-material prices, accounting effects and external policy developments. A rigorous assessment must therefore distinguish between the financial consequences of the broader automotive market and those directly attributable to electric-vehicle development and production. Without audited model-level contribution margins, powertrain-specific manufacturing costs and comparable pricing information, the proportion of the loss caused by electrification cannot be isolated with sufficient confidence.
Reconstructing the financial deterioration: three different measures of profitability
A central methodological problem in interpreting automotive earnings arises from the tendency to treat operating profit, adjusted operating profit and consolidated net income as interchangeable measures. They are not. Volvo’s reported EBIT captures operating performance under the company’s reporting framework, while its adjusted measure excludes defined items relating to joint ventures, associates and comparability adjustments. Net income incorporates further effects below operating profit. Each measure answers a different financial question, and the difference between them is particularly important during restructuring and industrial transformation because accounting adjustments can materially change the apparent magnitude of the deterioration.
Using the company’s published figures, the decline in reported operating income from SEK 6.4 billion to −SEK 5.6 billion corresponds to a deterioration of approximately SEK 12.0 billion. The equivalent movement in adjusted operating income, from SEK 5.8 billion to −SEK 3.7 billion, represents approximately SEK 9.5 billion. Net income declined by approximately SEK 10.2 billion. These changes are calculated directly from Volvo’s disclosed rounded figures and should not be confused with separate cash-flow measures.
Table 3.1 — Volvo Cars financial performance, Q3 2025 versus Q3 2026
| Financial indicator | Q3 2025 | Q3 2026 | Change | Analytical significance |
|---|---|---|---|---|
| Revenue | SEK 86.4bn | SEK 66.9bn | −SEK 19.5bn | Sharp contraction in consolidated business activity |
| Revenue growth | — | Approximately −23% | — | Combines volume, pricing, mix, exchange-rate and other effects |
| Reported EBIT | +SEK 6.4bn | −SEK 5.6bn | −SEK 12.0bn | Major deterioration in operating performance |
| Reported EBIT margin | +7.4% | −8.4% | −15.8 percentage points | Transition from positive to negative operating profitability |
| Adjusted EBIT | +SEK 5.8bn | −SEK 3.7bn | −SEK 9.5bn | Deterioration persists after defined adjustments |
| Adjusted EBIT margin | +6.7% | −5.6% | −12.3 percentage points | Weak underlying operating performance |
| Consolidated net result | +SEK 4.5bn | −SEK 5.7bn | −SEK 10.2bn | Severe decline in final earnings |
| Basic earnings per share | SEK 1.75 | −SEK 1.63 | −SEK 3.38 | Deterioration in per-share earnings |
| Fully electric sales share | 22% | 32% | +10 percentage points | Electric penetration increased despite losses |
| Electrified sales share | 46% | 53% | +7 percentage points | Broader technological transition continued |
The movement from positive to negative adjusted EBIT is especially consequential because it indicates that the financial deterioration cannot be dismissed merely by excluding identified exceptional items. At the same time, reported and adjusted results should not be used to manufacture an unsupported account of battery-electric profitability. The negative adjusted margin identifies pressure on the consolidated business, not a separately measured negative margin on the electric portfolio. The difference is decisive for government officials evaluating whether regulatory flexibility would relieve the underlying problem. If losses principally result from weak international demand or high fixed costs, permitting additional combustion vehicles in Europe may provide some commercial flexibility but will not necessarily eliminate the financial shortfall. If, alternatively, manufacturers are incurring significant losses through compliance-driven discounting of electric models, regulatory sequencing could have a more direct effect. The public figures presented here do not quantify these two mechanisms separately.
The volume problem: the significance of a shrinking revenue base
Volvo reported 141,609 global retail sales during the third quarter of 2026, a 10.7% reduction compared with the corresponding period one year earlier. The company attributed the weaker sales environment partly to continued pressure in China and a slower-than-expected recovery in the United States premium segment, while describing its European business as relatively resilient, supported by demand and order intake for fully electric cars. Volvo Cars Reports Q3 2026 Sales — Volvo Cars — October 2026.
These geographical differences are important because Volvo operates within several vehicle markets whose competitive dynamics and regulatory frameworks differ substantially. China is both a major automotive market and a centre of electric-vehicle manufacturing competitiveness, creating pressure on foreign brands through domestic competition, pricing and customer preferences. The United States presents a different combination of premium-market demand, trade policy and regulatory uncertainty. Europe, meanwhile, remains central to Volvo’s electrification strategy and its broader manufacturing identity. A consolidated fall in sales can therefore occur even where European electric demand is comparatively strong, because weakness elsewhere reduces the revenue available to support global product development, manufacturing investments and corporate operations.
The interaction between sales volume and fixed costs deserves particular attention. Automotive manufacturers must sustain engineering organisations, manufacturing plants, equipment depreciation, product validation, software development, procurement systems, logistics and corporate infrastructure. A decline in sales reduces the number of units over which these costs are absorbed. If the manufacturer cannot lower costs proportionately, profitability deteriorates faster than revenue. This operating-leverage effect can become particularly severe during technological transformation because manufacturers may be supporting existing combustion and hybrid platforms while simultaneously investing in electric architectures, battery integration and software-defined vehicle capabilities.
A company can consequently face rising electric sales penetration without receiving the full scale benefits expected from electrification. Electric models may constitute a larger share of a smaller total sales base, while manufacturing operations still carry costs associated with a broader range of products and production systems. The percentage increase in electric penetration is therefore insufficient to determine whether electric production has reached an economically optimal scale.
A qualified examination of the Volvo electric-volume paradox
Volvo’s Q3 2026 retail figures permit a useful calculation that illustrates the distinction between electric share and electric volume. Applying the company’s reported 32% fully electric share to its 141,609 quarterly retail deliveries gives approximately 45,315 fully electric vehicles. The corresponding 2025 electric volume can be estimated by reversing the reported 10.7% overall sales decline and applying the previous 22% electric share. The resulting illustrative 2025 electric volume is approximately 34,886 vehicles, implying electric-volume growth of around 30%.
These calculations use rounded percentage shares and the reported retail-delivery total; they are therefore estimates, not official model-level delivery figures. Their analytical value is that they demonstrate how absolute electric deliveries can increase substantially while total company sales decline. They also show why the term electric growth requires precise definition. A company can improve its electric share because electric deliveries expand, because combustion and hybrid deliveries contract, or through a combination of both effects.
Table 3.2 — Illustrative electric-volume reconstruction
| Variable | Q3 2025 estimate | Q3 2026 estimate | Calculation basis |
|---|---|---|---|
| Global retail deliveries | Approximately 158,577 | 141,609 | 2025 inferred from reported 10.7% decline |
| Fully electric share | 22% | 32% | Volvo’s rounded published percentages |
| Implied fully electric deliveries | Approximately 34,886 | Approximately 45,315 | Retail deliveries multiplied by electric share |
| Implied fully electric volume change | — | Approximately +30% | Calculated from rounded estimates |
| Non-fully-electric deliveries | Approximately 123,691 | Approximately 96,294 | Residual after implied BEV deliveries |
Source inputs: Volvo Cars Reports Q3 2026 Sales — Volvo Cars — October 2026; Volvo Cars Q3 2026 Results — Volvo Cars — October 2026.
The calculation suggests that Volvo’s fully electric deliveries rose materially while its non-fully-electric sales contracted much more sharply. That combination is consistent with a significant transition in the company’s portfolio, but it does not demonstrate whether the shift improved or weakened total profitability. The answer would require information on transaction prices, product costs, manufacturing utilisation and contribution margins for each propulsion category.
China, the United States and the limits of single-cause explanations
Volvo’s official communication identifies China and the United States as particularly difficult markets during the quarter. The significance of this attribution is that these pressures operate through different mechanisms. In China, stronger domestic competition, changes in demand and price pressure can reduce sales volumes and weaken the position of established premium brands. In the United States, trade measures and regulatory changes can influence import costs, credit values, model profitability and the relative attractiveness of local production.
The company disclosed a negative revaluation of approximately SEK 1.1 billion in CAFE-related credits following changes in United States legislation. It also reported approximately SEK 0.9 billion associated with the recognition of Polestar’s losses relating to the second quarter of 2026. Together, these two identified effects total SEK 2.0 billion, but they represent different accounting and economic phenomena and must not be combined into a single estimate of the costs of electrification. Nor should they automatically be deducted from the consolidated loss to create an alternative profit measure, because their accounting placement and interaction with the company’s adjusted reporting definitions must be respected. Volvo Cars Q3 2026 Results — Volvo Cars — October 2026.
The United States CAFE-credit revaluation illustrates the risk of relying on regulatory-credit economics as part of a manufacturer’s financial expectations. Such credits may possess value under one regulatory regime and lose part of that value when the rules change. A manufacturer’s earnings exposure therefore includes not only the cost of physical vehicles but also the value assigned to compliance instruments and related financial arrangements. This reinforces the importance of international regulatory divergence for globally operating manufacturers.
Volvo’s exposure to Polestar raises a different issue: the financial risks associated with participation in a broader electric-vehicle industrial ecosystem. Investment in related companies, technology platforms and manufacturing partnerships may provide access to intellectual property, purchasing economies and shared architectures, but can also create financial exposure when associated operations incur losses. That exposure should not be confused with the operating economics of Volvo-branded electric models. A loss recognised through an associate is not equivalent to an identified manufacturing loss on each battery-electric car sold by the parent company.
From the 2021 all-electric commitment to the 2024 strategic adjustment
Volvo’s current position cannot be understood without examining its earlier strategy. On 2 March 2021, the manufacturer announced its ambition to become fully electric globally by 2030, with the intention of phasing out combustion-engine vehicles, including hybrids, from its portfolio. The announcement formed part of a broader corporate transformation centred on electric vehicles, digital commerce and growth. Its strategic logic depended on expectations of progressively stronger environmental regulation, improving battery technologies, expanding charging infrastructure and increasing consumer demand for pure-electric vehicles. Volvo Cars to Be Fully Electric by 2030 — Volvo Cars — March 2021; All Pure Electric Volvo Models to Be Available Online Only — Volvo Cars — March 2021.
On 4 September 2024, Volvo revised that ambition, announcing that 90–100% of its global sales by 2030 should consist of electrified vehicles, defined as a combination of fully electric and plug-in hybrid models, while retaining the possibility that up to 10% of sales could consist of mild hybrids. The company attributed the adjustment to changing market conditions and customer demand. This constituted a substantive change in its intended product composition, not an abandonment of electrification as a long-term direction. It also demonstrated that a manufacturer which had previously adopted a more ambitious electric-only target than the EU’s 2035 framework considered it necessary to preserve transitional combustion-related technology. Volvo Cars Adjusts Electrification Ambitions, Remains Committed to Fully Electric Future — Volvo Cars — September 2024.
Table 3.3 — Volvo’s electrification strategy: announced commitments and revisions
| Date | Corporate position | Target or strategy | Industrial implication |
|---|---|---|---|
| March 2021 | Ambition to become fully electric globally | Fully electric portfolio by 2030 | Planned exit from combustion-engine and hybrid vehicles |
| September 2024 | Revised electrification ambition | 90–100% fully electric and plug-in hybrid sales by 2030 | Continued role for plug-in hybrids |
| September 2024 | Limited mild-hybrid flexibility | Up to 10% of global sales if required | Retention of selected combustion-related capabilities |
| October 2026 | Continued product expansion | 13 new cars planned by end-2030 | Major capital, engineering and industrial execution commitment |
| October 2026 | Structural cost-reduction programme | Approximately 2,500 positions affected | Workforce and operating-cost restructuring |
| End-2027 target | Completion of financial effects from announced measures | Additional SEK 5bn savings programme | Intended improvement in cost structure, not yet realised |
Sources: Volvo Cars to Be Fully Electric by 2030 — Volvo Cars — March 2021; Volvo Cars Adjusts Electrification Ambitions — Volvo Cars — September 2024; Volvo Cars Q3 2026 Results — Volvo Cars — October 2026.
The chronological sequence is important because it demonstrates that corporate strategy has already moved towards greater technological flexibility independently of the final legislative outcome of the European Commission’s proposed 2035 revision. This suggests that part of the demand for regulatory adjustment reflects decisions manufacturers have already made in response to their assessment of commercial conditions. Yet Volvo’s continued investment in electric vehicles also indicates that flexibility and electrification are not inherently incompatible. The company is attempting to preserve product optionality while continuing to develop and commercialise electric technology.
The 2026 restructuring: cost reduction as an industrial adjustment mechanism
In response to its third-quarter deterioration, Volvo announced an additional SEK 5 billion reduction in indirect expenditure and variable costs, supplementing previously completed programmes. The company stated that its actions would result in a structural reduction of approximately 2,500 positions globally, including approximately 2,000 in Sweden, through consultant-contract termination, natural attrition and targeted employee-exit arrangements. It expected the full financial effects by the end of 2027 and indicated that overall indirect spending would then be almost 25% below its 2024 level. These figures refer to announced intentions and expected effects; they do not establish that every job reduction or saving had already been realised at the October 2026 reporting date. Volvo Cars Q3 2026 Results — Volvo Cars — October 2026.
The restructuring is relevant to European economic security because cost-reduction programmes can have different industrial consequences depending on where and how they are implemented. Reducing administrative duplication, procurement inefficiencies or unproductive expenditure can improve competitiveness without materially weakening strategic manufacturing capabilities. Cutting specialised engineering teams, terminating critical supplier relationships or reducing investment in emerging technologies may improve short-term financial indicators while damaging long-term productive capacity. The public announcement identifies aggregate workforce and expenditure objectives but does not provide sufficient information to determine the precise distribution of reductions across every engineering function, plant or supplier network.
Volvo’s announced objective of reducing indirect expenditure by almost one quarter relative to 2024 also demonstrates that the company’s management regards structural operating costs as a major area for adjustment. However, it would be inappropriate to assume that the full SEK 5 billion target represents an improvement in quarterly earnings. The announced savings are a programme objective, and their timing, gross-versus-net character, implementation expenditure and interaction with revenue require careful interpretation.
Table 3.4 — Restructuring programme and verification requirements
| Announced measure | Disclosed magnitude | Intended timing | What the announcement establishes | What remains unresolved |
|---|---|---|---|---|
| Additional indirect and variable cost reduction | SEK 5bn | Financial effects expected by end-2027 | Formal corporate savings objective | Realised net savings and implementation costs |
| Structural workforce reduction | Approximately 2,500 positions | Programme implementation | Planned permanent reduction | Final number and distribution of completed exits |
| Sweden-related reductions | Approximately 2,000 positions | Programme implementation | Largest disclosed national allocation | Functional and site-level distribution |
| Overall indirect expenditure | Almost 25% below FY2024 | By end-2027 | Management cost-base objective | Final audited comparison |
| New vehicle introduction programme | 13 new vehicles | Through end-2030 | Announced product-development ambition | Model-level profitability and manufacturing allocation |
The role of product complexity and manufacturing scale
Volvo’s decision to pursue 13 new vehicle introductions by the end of 2030 presents an industrial challenge distinct from the immediate restructuring. A broad new-product programme can support revenue recovery by expanding customer choice, replacing ageing models and improving technological competitiveness. It also requires substantial engineering, testing, tooling, software, procurement and launch-management resources. The economic success of the programme will depend on whether the company can increase platform commonality, achieve adequate model volumes and manage manufacturing complexity while serving markets with different technological and regulatory requirements.
This is particularly important for a manufacturer operating across Europe, China and the United States. Product requirements, tariffs, consumer preferences and cost structures can make a globally uniform production strategy commercially inefficient. Greater regional localisation may reduce exposure to trade barriers and improve responsiveness to local demand, but can also fragment scale economies if too many regional variants require separate manufacturing or engineering arrangements. The balance between common global platforms and market-specific products is therefore an important determinant of future profitability.
At the European industrial level, the same issue applies to the wider transition away from established combustion platforms. Manufacturers must avoid excessive duplication of engineering investment while preserving the ability to adapt product offerings to different customer requirements. A technologically flexible strategy can reduce commercial risk, but only if it is implemented through efficient platform management rather than indefinite maintenance of several costly and insufficiently scaled architectures.
Geely cooperation and the changing meaning of European automotive sovereignty
Volvo’s strategic position also raises the question of how industrial sovereignty should be evaluated in an internationally integrated corporate structure. The company’s cooperation with Geely can potentially provide access to shared technology, purchasing scale, engineering resources and manufacturing efficiencies. Such arrangements can improve competitiveness and reduce the development costs associated with advanced vehicle platforms. They may also create dependencies on decisions, technologies or supply chains outside European institutional control.
Industrial sovereignty should not be confused with the exclusive national ownership of every company or production asset. A European factory can contribute substantial local value added, skilled employment and technical capability under international ownership. Conversely, a European-owned manufacturer can generate limited domestic industrial value if a large proportion of its manufacturing and technology sourcing occurs outside Europe. The relevant analytical questions concern where engineering decisions are made, where intellectual property and technical expertise are developed, where critical components are manufactured, how investment is allocated and whether essential capabilities can be sustained under adverse international conditions.
For Volvo, the precise balance between cooperation benefits and strategic dependency cannot be quantified using the third-quarter financial data alone. The company’s performance nevertheless illustrates why European industrial strategy must distinguish corporate competitiveness from the geographical location of productive capabilities. A manufacturer may become more financially competitive through international technology integration while the European share of its industrial value added changes in either direction. Public policy should monitor those outcomes rather than treating foreign collaboration automatically as either an industrial success or a sovereignty failure.
What Volvo’s results establish about the EU regulatory debate
The company’s financial performance provides evidence relevant to the European regulatory discussion, but its implications must be carefully bounded. Volvo’s rising electric share and worsening profitability show that electric adoption alone is not a sufficient indicator of successful industrial transformation. Its revised 2030 strategy demonstrates that manufacturers may require a longer period of technological coexistence than their earlier ambitions assumed. Its restructuring identifies the possibility that financial pressure during transition can translate into employment reductions and changes in organisational capability. Its international market exposure also demonstrates that European climate policy operates within a global competitive environment shaped by Chinese industrial scale, American trade and regulatory decisions, and manufacturer-specific commercial performance.
None of these observations proves that the EU’s 2035 framework caused Volvo’s losses. The original Volvo all-electric ambition applied globally and preceded the EU’s 2023 regulation. The company’s 2026 performance was materially influenced by market developments outside the Union. Its earnings also incorporate factors that cannot be directly attributed to powertrain regulation. Using Volvo as a direct estimate of the economic cost of European emissions legislation would therefore exceed what the disclosed evidence supports.
The more useful conclusion concerns the conditions under which an accelerated technology transition can become financially destabilising. If manufacturers must maintain large investment programmes while suffering weaker vehicle demand, lower prices, insufficient scale and rising import competition, their capacity to finance new technology and preserve skilled employment can deteriorate. Regulatory flexibility may alleviate some of those pressures, particularly where it permits profitable transitional products to remain in the portfolio. It will not, however, repair inadequate product competitiveness, weak demand in China or the United States, poor manufacturing utilisation or noncompetitive battery costs. The principal policy instrument must therefore be selected according to the actual economic mechanism rather than a simplified attribution of every manufacturer loss to electrification.
The consequences for European engineering employment
The announced reduction of approximately 2,500 positions is important not simply as an employment statistic but because of the potential effects of restructuring on long-term technological capability. Automotive companies employ specialists in materials science, mechanical engineering, electronics, software, safety, testing, industrial automation, manufacturing processes and complex supply-chain management. Some of these capabilities transfer relatively easily between propulsion technologies, while others require substantial retraining or new capital equipment. The economic risk increases when temporary financial weakness produces permanent disinvestment in capabilities that cannot subsequently be recreated at reasonable cost.
A further distinction is required between the reduction of combustion-specific competencies and the loss of broader engineering capability. Certain activities directly associated with engine production, fuel systems and exhaust treatment will experience reduced demand as BEV penetration rises. Other capabilities, including precision manufacturing, thermal management, materials engineering, control systems and production automation, can remain relevant to electric vehicles. Treating the entire traditional automotive workforce as technologically obsolete would therefore be economically wasteful. Equally, assuming that all existing jobs can be preserved through simple retraining would understate the differences between established production systems and battery-electric manufacturing.
The implications are particularly significant for suppliers and regional industrial clusters. Vehicle manufacturers possess greater capacity to reorganise internationally than many smaller specialised suppliers, whose customer base may be concentrated in a limited number of engine programmes or manufacturing plants. When an established platform is discontinued, a supplier can face the loss of several years of expected production, even if the broader European automotive market continues growing. The consequences may include reduced research expenditure, supplier insolvency, consolidation or relocation of technical activities. These effects require supplier-level evidence and cannot be extrapolated numerically from Volvo’s announced workforce reduction.
The industrial conditions for a sustainable recovery
Volvo’s future profitability will depend on a combination of revenue recovery, more efficient operating expenditure, successful product introductions, improved manufacturing economics and competitive positioning across its major geographical markets. The announced restructuring addresses part of the expenditure problem, while the new-model programme seeks to improve the company’s product portfolio. Neither measure guarantees an improvement in margins. A successful recovery would require stronger unit economics, adequate manufacturing utilisation and the ability to sell a changing mix of vehicles without excessive discounts or unsustainable financing support.
The European policy implication is that incentives should be designed to improve underlying productive capacity rather than merely offset immediate financial losses. Support for battery manufacturing, advanced components, skills conversion and charging infrastructure can address structural barriers to electric competitiveness. Compliance flexibility can reduce transition-period financial pressure. Trade-defence instruments can respond to legally established unfair competition. Yet public support should remain accountable for measurable results, including actual investment, commercially usable production capacity, productivity improvement and domestic industrial activity.
Volvo illustrates why this conditionality is necessary. A manufacturer experiencing substantial financial losses may have a legitimate case for adjustment assistance or regulatory flexibility, but its losses alone do not demonstrate which public intervention would produce the greatest economic return. A subsidy that simply compensates for weak margins can preserve an inefficient production structure. Conversely, a narrowly targeted investment in a bottleneck technology or manufacturing process can improve the economics of future production and reduce the need for recurring assistance. The distinction must be central to European industrial governance.
Chapter 3 — Key judgments
Volvo Cars’ third-quarter 2026 results establish a significant deterioration in profitability alongside continued progress in electric-vehicle penetration. The reported net loss of SEK 5.7 billion, the SEK 12.0 billion year-on-year decline in reported operating income, the 23% revenue contraction and the announced structural reduction of approximately 2,500 positions demonstrate substantial pressure on the company’s financial and organisational capacity. Its fully electric share nevertheless increased from 22% to 32%, and the combination of lower total volumes and a higher electric share is consistent with meaningful growth in electric deliveries.
The company’s experience supports the strategic case for evaluating electrification through profitability, production capability and investment sustainability rather than registration shares alone. Its revised product strategy demonstrates the commercial value of technological flexibility, but the financial evidence does not establish that retaining hybrids would independently restore profitability or that European emissions rules caused the reported losses.
What would change the assessment: A sustained recovery in adjusted operating margins accompanied by continued growth in electric deliveries would demonstrate that profitability and electrification can converge within Volvo’s operating model. Conversely, persistent losses despite successful new electric launches and improved international demand would increase concern about structural vehicle economics and manufacturing costs. Stronger disclosure of model-level margins, manufacturing utilisation and regional profitability would permit a more precise causal assessment.
Open official record: The most consequential missing information is a verified product- and powertrain-level profitability bridge, together with detailed restructuring charges, realised savings, regional manufacturing investment and the distribution of engineering reductions across organisational functions. Those records would help determine whether the principal difficulty is electric-product profitability, global market weakness, excessive fixed costs or a combination of these factors.
Pillar I — Consolidated analytical judgment
The three chapters establish a coherent but qualified account of Europe’s automotive transition. The Union’s emissions framework creates a powerful long-term investment signal, but its effectiveness depends on commercial demand and complementary infrastructure progressing sufficiently to support financially sustainable manufacturing. The consumer market is electrifying rapidly, yet significant demand remains for conventional and plug-in hybrids because buyers face different affordability, charging, financing and operational conditions. Volvo’s financial deterioration demonstrates that increasing electric penetration does not automatically produce profitable industrial transformation, particularly when international competition, weaker total sales and high operating costs coincide.
The resulting governance problem is not resolved by choosing between unconditional preservation of combustion technology and an inflexible requirement for immediate electrification. It requires an evidence-based separation of climate performance, manufacturer economics and industrial location. Climate objectives determine the environmental outcome; regulatory mechanisms influence the timing and product choices through which it is pursued; industrial instruments determine whether European firms and workers retain the capability to produce the next generation of vehicles.
The principal conclusion of Pillar I is that Europe must assess the success of its automotive transition through three simultaneous tests: verified emissions reduction, commercially sustainable vehicle adoption and preservation of competitive productive capacity. Progress on one test cannot be presumed to satisfy the other two.
THE WORLD AUTOMOTIVE MARKET
An interactive examination of global vehicle production, powertrain transformation, manufacturer deliveries, electrification, operating margins, profitability and industrial competitiveness.
This dashboard distinguishes passenger-car sales, all-vehicle manufacturing, automaker deliveries, BEVs, plug-in hybrids and conventional hybrids. Manufacturer fiscal years, group boundaries, wholesale shipments and retail deliveries are not always directly comparable. Missing indicators are shown as unavailable rather than estimated. The dashboard is a curated verified dataset, not an exhaustive global census of manufacturer financial accounts.
01 — World Vehicle Manufacturing, 2023–2025
OICA total motor vehicle production includes passenger cars and commercial vehicles. Values below are absolute manufacturing output, not retail sales.
02 — Global Manufacturing Geography
A comparative study of major manufacturing countries, showing the geographical concentration of global industrial capacity.
All-vehicle production. Country records may contain national reporting qualifications. Missing values are never treated as zero.
Source: OICA — Production by Country .
03 — Electrification of the World Car Market
Electric cars comprise battery-electric vehicles (BEVs) and plug-in hybrid electric vehicles (PHEVs) in the IEA series. Conventional hybrids (HEVs) are not included in these EV totals.
Global EV Sales
EV Share of New-Car Sales
Global electric-car sales increased from approximately 14 million in 2023 to more than 17 million in 2024 and around 21 million in 2025. These are rounded IEA reference values, not exact registration counts. Conventional hybrids are tracked separately because the available global classifications do not support a complete, directly comparable manufacturer- level HEV series.
Sources: IEA Global EV Outlook 2026; IEA Global EV Outlook 2025.
04 — Regional Electrification and Market Divergence
The following comparison uses approximate 2025 regional EV sales shares reported by the IEA. Regions are separate markets, not segments of one global percentage.
| Market | 2025 electric share | Definition | Strategic reading |
|---|---|---|---|
| China | Nearly 55% | BEV + PHEV | Leading large market in adoption |
| Europe | 28% | BEV + PHEV | Strong growth, regulation-sensitive |
| United States | Just under 10% | BEV + PHEV | Lower penetration and policy uncertainty |
| Southeast Asia | Nearly 20% | BEV + PHEV | Rapid emerging-market adoption |
| Global | Approximately 25% | BEV + PHEV | One in four new cars electric |
05 — Global Automaker Delivery Comparison
Manufacturer-defined worldwide deliveries, retail sales or shipments. These observations are not a perfectly harmonised ranking. The reporting basis is shown for every entry.
Automaker size alone does not measure profitability or electric-vehicle leadership. Toyota’s retail network, Volkswagen’s customer deliveries, Stellantis’ shipments, BYD’s new-energy vehicle sales and Tesla’s deliveries have different published perimeters. Do not sum the displayed firms to estimate global market volume: corporate groups and reporting methods may overlap.
06 — BEV and Plug-in Hybrid Competition
A propulsion-specific view of selected major manufacturers with documented 2025 deliveries. Values refer to the issuer’s reported scope.
BYD’s figures are new-energy passenger cars; Volkswagen’s electric figure includes its published group reporting scope, including heavy commercial vehicles. Tesla’s deliveries are battery electric. Missing conventional hybrid information is not inferred from other powertrain categories.
07 — Corporate Profitability: Group Results
Comparable observations within each company are shown over time. Cross-company margins are indicative because financial reporting, segment scope, restructuring charges and accounting policies differ.
Volkswagen results use IFRS group operating profit. Stellantis is presented on its reported adjusted operating income basis; this is not equivalent to unadjusted IFRS operating income. 2025 Stellantis also reported a substantial consolidated net loss. Currencies are retained in their original units, and operating results are not ranked together as if they were converted into one currency.
08 — Volkswagen: Profitability and Volume
A three-year financial series highlights how an automaker may retain considerable sales scale while experiencing a substantial margin contraction.
Operating Return on Sales
Worldwide Group Deliveries
| Year | Operating margin | Deliveries | Operating profit |
|---|---|---|---|
| 2023 | 7.0% | Not displayed | €22.5bn |
| 2024 | 5.9% | 9,026,681 | €19.1bn |
| 2025 | 2.8% | 8,983,900 | €8.9bn |
Sources: Volkswagen Financial KPIs; Volkswagen Deliveries.
09 — Financial Stress and Corporate Losses
The scale of reported corporate losses must be interpreted alongside the accounting basis and the specific reasons disclosed by management.
| Financial item | 2024 | 2025 | Reporting basis |
|---|---|---|---|
| Volkswagen revenue | €324.7bn | €321.9bn | Consolidated IFRS |
| Volkswagen operating profit | €19.1bn | €8.9bn | Consolidated IFRS |
| Stellantis revenue | €156.88bn | €153.51bn | Consolidated IFRS |
| Stellantis net result | +€5.52bn | −€22.33bn | Consolidated net income/loss |
| Stellantis adjusted operating income | +€8.65bn | −€0.84bn | Non-GAAP adjusted measure |
| Stellantis industrial free cash flow | −€6.05bn | −€4.53bn | Company-defined industrial measure |
Sources: Stellantis FY2025 Results; Volkswagen FY2025 Results.
10 — Electric Battery Industrial Concentration
The battery industrial structure determines where a substantial part of the electric vehicle’s cost and manufacturing value is created.
Battery Manufacturing Capacity, 2025
Battery Price Disadvantage
Battery production concentration affects vehicle economics, manufacturing location, materials processing and the resilience of European and North American supply chains.
Source: IEA — Electric Vehicle Batteries, 2026 .
11 — Selected 2026 Market Observations
These observations are reported separately from full-year 2023–2025 series. Interim results must not be compared directly with complete financial years.
| Indicator | Period | Value | Meaning |
|---|---|---|---|
| Global EV sales share | H1 2026 | ~24% | BEV + PHEV global new-car market |
| Global EV sales, outlook | 2026 estimate | ~29% share | IEA projection, not reported annual result |
| EU BEV registrations | Jan–Sep 2026 | 22.7% | BEVs only |
| EU conventional hybrids | Jan–Sep 2026 | 36.3% | HEVs excluding PHEVs |
| EU plug-in hybrids | Jan–Sep 2026 | 10.1% | Externally rechargeable hybrids |
| EU passenger-car trade surplus | H1 2026 | €28.7bn | Down 34.2% year on year |
Sources: IEA — Electric Car Markets in a Time of Uncertainty ; ACEA — 2026 Registrations.
12 — Market Intelligence: Interpretation
World vehicle production expanded from 93.54 million in 2023 to 96.38 million in 2025. The expansion was geographically uneven, with significant growth in Asia.
Electric vehicles reached approximately one-quarter of global new-car sales in 2025, while conventional hybrids remained important outside the IEA plug-in EV category.
Chinese manufacturers and battery suppliers have strengthened their positions through production scale, lower costs and growing international exports.
Automaker profitability varies substantially. High vehicle volumes or rising BEV deliveries do not necessarily produce stronger operating margins or positive consolidated earnings.
13 — Source Register and Reporting Boundaries
| Source | Dataset | Coverage | Important limitation |
|---|---|---|---|
| OICA | Production statistics | 2023–2025 | All motor vehicles; producer-country basis |
| IEA | Global EV Outlook | 2023–2026 outlook | BEV + PHEV, includes estimates and projections |
| Volkswagen Group | Annual report | 2023–2025 KPIs | Consolidated group including financial services |
| Stellantis | FY2025 disclosure | 2024–2025 comparatives | Adjusted versus reported measures differ |
| Tesla | Production and deliveries | 2023–2025 | Vehicle deliveries, not registrations |
| BYD | Production and sales announcement | 2024–2025 | NEVs include BEV and PHEV; passenger and commercial totals differ |
| ACEA | EU registration statistics | 2026 interim | EU market rather than worldwide coverage |
Financial information is not automatically comparable across IFRS, US GAAP and issuer- defined adjusted reporting. Historical figures are not replaced with forecast values.
PILLAR II — INDUSTRIAL COMPETITIVENESS, CHINESE EXPANSION AND EUROPEAN PRODUCTION SOVEREIGNTY
Chapter 4 — The Erosion of Europe’s Automotive Trade Surplus and Production Base
Europe’s automotive trade deterioration is revealing a structural vulnerability that aggregate sales growth can no longer conceal
The central industrial development of 2026 is the widening separation between the European Union’s ability to sustain vehicle consumption and its ability to retain the production, export earnings and technological value associated with that consumption. For several decades, Europe’s automotive strength has depended not simply on a large internal market but on the capacity of manufacturers located within its territory to serve foreign markets, maintain substantial supplier networks, develop sophisticated production equipment and generate export revenues capable of supporting high-value employment. This structure allowed the automobile industry to function as a transmission mechanism between advanced engineering, regional manufacturing investment and Europe’s external economic position. The deterioration recorded in the first half of 2026 is significant because pressure is emerging simultaneously on several components of that model: exports are declining, imports are increasing, the proportion of vehicles sold in the Union that were manufactured within the Union has fallen, and Chinese production is gaining a larger position in European demand.
The European Automobile Manufacturers’ Association reported on 12 October 2026 that the EU passenger-car trade surplus had contracted by 34.2% in the first half of the year, to approximately €28.7 billion. The decline occurred because the value of extra-EU passenger-car exports fell by 12%, while the value of imports increased by 15.6%. Import volumes rose by 16.1%, whereas export volumes declined by 5.9%. At the same time, manufacturing output in the Union decreased by 0.4%, notwithstanding a 5.7% increase in domestic new-car registrations. These movements establish that stronger European vehicle demand was not accompanied by an equivalent improvement in European production performance. The association also reported that only 68% of cars sold in the Union were manufactured within its territory, while China-produced vehicles accounted for 9%, and that the proportion of EU-produced cars sold outside the Union declined to 32.4%. Economic and Market Report: Global and EU Auto Industry — ACEA — October 2026.
These observations need to be interpreted with precision. A declining trade surplus is not in itself proof that an industry has become technologically uncompetitive, and an increase in vehicle imports does not automatically represent a loss of welfare: imports may improve consumer choice, reduce prices or provide vehicles that domestic producers cannot manufacture at comparable cost. The strategic concern arises when import growth combines with weakening domestic production, deteriorating export performance and concentrated foreign control over increasingly important technologies. Under those circumstances, the Union may retain the consumption benefits of a large automotive market while surrendering an increasing share of its manufacturing income, investment opportunities and technological leverage. The risk is particularly serious when capacity reductions become permanent, because rebuilding an automotive production ecosystem requires far more than reopening an assembly plant. It requires reconstituting supplier relationships, specialist labour, validated manufacturing processes, engineering teams and access to internationally competitive technologies.
The anatomy of the trade-surplus contraction: exports and imports are moving in opposite directions
The decline in the trade balance is best understood through its two underlying movements rather than through the percentage contraction alone. In the first half of 2026, the value of EU passenger-car exports to non-EU markets reached approximately €69.4 billion, while imports reached €40.7 billion. The resulting positive balance remained substantial, demonstrating that the European Union continued to be a major net exporter of finished passenger cars. Yet the direction of change was unfavourable: exports weakened while imports expanded, reducing the net surplus by almost €15 billion compared with the equivalent period of 2025. The import increase was not merely the result of purchasing a greater number of vehicles at sharply higher average prices, since import volumes also grew substantially. Conversely, export value declined faster than export volume, indicating that changes in prices, product mix, destination markets or other compositional factors contributed to the deterioration, although the aggregate statistics do not isolate their individual effects.
The distinction between changes in value and volume is essential for industrial interpretation. An increase in imported vehicle volumes can displace domestically manufactured products if buyers substitute foreign-built cars for European-built alternatives. A reduction in export prices or a shift towards lower-value models can weaken revenue even where the number of exported vehicles remains relatively stable. Exchange rates, market-specific tariffs, pricing strategies and differences in product composition can all affect reported monetary values without producing identical movements in physical output. A credible assessment must therefore examine export values, export volumes, import values and import volumes separately before attributing the trade deterioration to any single cause. Economic and Market Report: Global and EU Auto Industry — ACEA — October 2026.
Table 4.1 — European passenger-car trade: the underlying deterioration
| Indicator | H1 2026 | Year-on-year change | Industrial interpretation | Statistical limitation |
|---|---|---|---|---|
| Extra-EU passenger-car exports | Approximately €69.4bn | −12.0% in value | Weakening revenue from foreign vehicle markets | Monetary value affected by vehicle mix and prices |
| Extra-EU passenger-car imports | Approximately €40.7bn | +15.6% in value | Increasing foreign-manufactured vehicle penetration | Imports are not equivalent to net value-added displacement |
| EU passenger-car trade surplus | Approximately €28.7bn | −34.2% | Narrowing positive external trade balance | Covers finished passenger cars, not the entire automotive ecosystem |
| Exported passenger-car volume | Not reproduced as an absolute total here | −5.9% | Lower physical deliveries outside the EU | Does not identify the relative contribution of each destination |
| Imported passenger-car volume | Not reproduced as an absolute total here | +16.1% | Rising physical import penetration | Cannot by itself determine imported propulsion mix |
| China-origin import value | Approximately €10.5bn | +70.5% | Major contribution to import growth | Includes qualifying finished vehicles from China, irrespective of brand nationality |
| China-origin imported vehicles | More than 700,000 | Increased | Growing Chinese manufacturing presence | Import flows differ from retail-registration shares |
| EU vehicle production | Approximately 6.0m passenger cars | −0.4% | Domestic production failed to match domestic demand growth | Production includes vehicles destined for export |
Source: Economic and Market Report: Global and EU Auto Industry — ACEA — October 2026. Trade figures concern extra-EU passenger-car commerce, rather than all motor vehicles, components and associated services.
The industrial significance of the contraction becomes clearer when the data are placed within the wider international environment. ACEA reported that global passenger-car registrations declined by 4.9% during the first half of 2026, to approximately 35.7 million vehicles, while global car production fell by 1%, to approximately 37.6 million units. The deterioration was unevenly distributed: Chinese domestic demand weakened sharply, North American production also declined, and European registrations increased. European exporters were therefore operating in an international environment in which some traditional destination markets were contracting while the EU market itself remained comparatively more favourable. This asymmetry encouraged the redistribution of international production towards export markets capable of absorbing additional supply.
China’s domestic registrations fell by 23.2% in the first half of 2026, according to ACEA, while Chinese car production declined by 5.8%, its first comparable decline since 2020. Those figures are critical because they demonstrate that China’s growing international competitive pressure did not arise simply from uninterrupted domestic expansion. The decline in domestic demand created stronger incentives for manufacturers to seek external sales, particularly where existing production capacity, supplier networks and distribution investment could support higher export volumes. The mechanism can intensify European import competition even when China’s own automotive industry is experiencing difficult domestic market conditions. Economic and Market Report: Global and EU Auto Industry — ACEA — October 2026.
Trade deterioration is not the same as manufacturing displacement, but their interaction matters
An important distinction must be preserved between the EU’s extra-European trade balance and the percentage of European vehicle demand supplied by factories located within the Union. The trade balance measures the difference between the value of completed passenger cars exported beyond EU borders and those imported from outside the Union. The manufacturing-origin share measures the proportion of cars sold in the European market according to where they were produced. The two indicators are related but not interchangeable. A European manufacturer can export large numbers of premium vehicles while importing less expensive cars from its own foreign factories, maintaining a substantial trade surplus even as the domestic market becomes more import-dependent. Conversely, strong domestic production for European consumers can coexist with a weakening trade surplus if exports decline because of adverse foreign demand.
The first-half 2026 combination is nevertheless concerning because both measures moved in directions that suggest pressure on European productive capacity. The Union’s manufacturing-origin share fell to 68%, while the share of EU-produced cars sold outside the Union declined to 32.4%. This implies a simultaneous weakening in the domestic and external positions of European manufacturing, although the underlying causes may differ by company and market. Domestic competition reflects vehicle price, quality, availability, design and consumer preference. Export weakness also reflects foreign tariffs, exchange rates, regulation and local production policies. A comprehensive industrial response cannot therefore rely on domestic trade protection alone: restoring external competitiveness and securing access to major export markets remain essential components of the European manufacturing model.
The relevant economic-security question is whether Europe can preserve the ability to serve both its internal market and international markets with technologically competitive vehicles. A strategy that protects domestic production by restricting imports but does not improve vehicle costs, technologies or export attractiveness may preserve certain facilities temporarily while leaving the underlying competitive weakness unresolved. An exclusively consumer-oriented strategy that permits unrestricted import substitution without developing competitive domestic capabilities may produce lower vehicle prices but gradually undermine the supplier and engineering ecosystem required for future production. The policy challenge is to preserve openness and competition while correcting demonstrable distortions and addressing the underlying determinants of European manufacturing costs.
Production-origin statistics reveal the changing geography of automotive manufacturing
The fall in the EU-produced share of European registrations to 68% represents a significant industrial benchmark because vehicle assembly generates demand across a broader set of activities than the final production operation alone. Assembly facilities require logistics, tooling, quality assurance, industrial maintenance, specialised manufacturing equipment and extensive networks of component suppliers. The geographical location of final assembly does not determine where every component originates, but it often influences the location of associated production services and supplier investment. A durable change in assembly geography can therefore affect the wider distribution of industrial capabilities.
The 9% share attained by China-produced vehicles in the first half of 2026 must be interpreted using the correct denominator. It refers to the share of vehicles sold in the EU that were manufactured in China, not the market share of Chinese-owned brands. A vehicle bearing a European or American brand may be included in the China-origin category if it was assembled there. Likewise, a vehicle sold by a Chinese-owned manufacturer may count as EU-produced if its final manufacturing took place within the Union. This distinction is particularly important when evaluating industrial sovereignty because brand identity and manufacturing location can produce very different conclusions about employment, investment and the origin of industrial value.
China’s 9% production-origin share also does not establish that all those vehicles were battery electric. Chinese manufacturers export both electric and combustion-related vehicle technologies, while multinational manufacturers use Chinese plants for several product categories. The effect of Chinese imports on European BEV competitiveness must therefore be assessed using propulsion-specific production and trade data, rather than assuming that the entire increase in China-origin vehicles represents pure-electric displacement.
Table 4.2 — Three distinct measures of European automotive industrial performance
| Analytical dimension | What it measures | Observed H1 2026 signal | What it establishes | What it cannot establish |
|---|---|---|---|---|
| Trade balance | Export value minus import value | Surplus down 34.2% | External trade performance weakened | Exact number of jobs displaced |
| Manufacturing origin | Location of production of cars sold in the EU | EU-produced share at 68% | Domestic market increasingly supplied by non-EU production | Local component content or ownership |
| China-origin market penetration | Share of EU sales manufactured in China | 9% | Growing Chinese manufacturing presence | Market share of Chinese brands alone |
| EU factory output | Cars physically produced within the Union | Down 0.4% | Modest aggregate production contraction | Long-term capacity loss without plant-level evidence |
| EU export dependence | Share of EU-made vehicles sold outside the EU | 32.4% | Foreign markets remain important to domestic factories | Profitability of exported vehicles |
| Global passenger-car demand | Worldwide registrations | Down 4.9% | External commercial conditions weakened | Independent effect of EU regulation |
Source: Economic and Market Report: Global and EU Auto Industry — ACEA — October 2026.
The United States, Türkiye and the vulnerability of Europe’s external markets
ACEA identified weakening exports to several important markets, particularly the United States and Türkiye, while noting that the United States and the United Kingdom together still accounted for approximately 48% of the total value of EU passenger-car exports. That concentration is strategically important because it demonstrates that Europe’s automotive export performance depends heavily on the commercial and regulatory conditions of a relatively limited number of large international markets. A substantial change in market access, consumer demand, tariffs or local production incentives in one of those destinations can influence the economics of factories across several European countries.
The United States presents a particularly complex exposure. European manufacturers compete in a market influenced by consumer preference for larger vehicles, local manufacturing investment, international supply chains and evolving trade measures. Changes in US import costs can encourage manufacturers to shift production towards North American facilities, particularly for models whose commercial viability depends on sustained access to the American market. This relocation can preserve the competitiveness of European-owned manufacturers while reducing the share of their global production taking place in Europe. Such an outcome is commercially rational for individual companies but may weaken the industrial base of the Union.
Türkiye represents a different form of competitive interdependence. It is an important automotive manufacturing and commercial partner closely integrated into European production and distribution networks. Changes in Turkish domestic demand or regional trading conditions can therefore affect European exports, while Turkish production also competes for manufacturing allocations. From an industrial-policy perspective, the distinction between cooperative supply-chain integration and competitive production substitution is not always straightforward: a partner country can simultaneously provide important intermediate components, receive European vehicles and offer an alternative location for future manufacturing investment.
The strategic consequence is that European automotive competitiveness cannot be assessed solely through the relationship between the Union and China. American trade policy, British market access, Turkish manufacturing integration, energy prices, exchange rates and demand conditions elsewhere also influence where manufacturers locate new production. A policy focused exclusively on Chinese vehicle imports would therefore address only one component of the wider challenge.
The risk of interpreting a temporary downturn as irreversible deindustrialisation
Although the first-half 2026 figures are concerning, they do not establish that Europe’s entire automotive industry is undergoing irreversible contraction. Aggregate EU production declined only modestly, by 0.4%, while some individual national manufacturing systems recorded positive growth. Vehicle production is influenced by model replacement cycles, plant maintenance, temporary supply-chain disruptions and changes in the allocation of production between factories. A decline measured over six months can therefore reflect temporary factors rather than permanent capacity closure.
A more demanding test of deindustrialisation requires evidence of persistent reductions in productive assets or capability. Relevant observations include the permanent closure of assembly or component plants, cancellation of future model allocations, liquidation of specialised suppliers, withdrawal of manufacturing investment, closure of research centres and migration of critical industrial expertise. Factory output can recover rapidly when unused capacity remains operational and demand improves. Rebuilding capacity after physical equipment has been dismantled, supplier relationships have disappeared and specialised personnel have relocated is considerably more difficult.
The distinction has important implications for public intervention. Temporary declines in utilisation may justify short-term measures designed to prevent unnecessary destruction of viable productive capacity, particularly where firms face a demonstrably transitory market shock. Persistent cost disadvantages require structural intervention in energy, productivity, technology and supply chains. Public support becomes economically questionable when it sustains production that cannot plausibly compete even after reasonable adjustment. The relevant objective is not to preserve every existing facility regardless of future demand, but to preserve the capabilities capable of supporting competitive manufacturing in the next technological cycle.
Chapter 4 — Key judgments
Europe’s first-half 2026 automotive performance reveals a deterioration extending beyond an isolated company or national market. The simultaneous contraction of export revenues, increase in import values, decline in domestic manufacturing-origin share and expansion of China-produced vehicle penetration establishes a credible risk of industrial displacement. Nevertheless, the EU retains a substantial positive passenger-car trade balance and a significant manufacturing base, and the available evidence does not justify an unsupported forecast of widespread irreversible plant closures.
The most consequential question is whether the deterioration remains cyclical or develops into a lasting shift in production allocation. The answer depends on the ability of European factories to compete in future vehicle technologies, preserve export markets and maintain the supplier relationships that support economically viable production.
What would change the assessment: A recovery in export volumes accompanied by rising EU-origin market share and sustained new-model investment would weaken the case for structural displacement. Further import penetration combined with permanent plant closures, falling export-market access and sustained losses among suppliers would strengthen it.
Open official record: The decisive additional evidence consists of harmonised Eurostat component-trade statistics, plant-level production and capacity data, destination-specific export values and volumes, and verified investment or closure decisions by manufacturers and major suppliers.
Chapter 5 — China’s Competitive Architecture: Batteries, Manufacturing Costs, Finished Vehicles and Supply Chains
China’s competitive advantage is systemic: its strength is distributed across the entire electric-vehicle production chain
The most consequential characteristic of China’s automotive expansion is not the ability of Chinese manufacturers to export competitively priced finished vehicles, but their position within an integrated industrial ecosystem that connects raw-material processing, battery chemistry, cell manufacturing, power electronics, vehicle assembly and increasingly sophisticated product-development capabilities. This structure gives Chinese manufacturers advantages that cannot be fully neutralised through tariffs on completed vehicles, because a European factory importing Chinese cells, cathode materials or specialised machinery may remain dependent on the very industrial system against which trade measures seek to defend it. China’s competitive influence consequently operates simultaneously through direct competition in the European vehicle market and through the supply chains supporting European manufacturers themselves.
The International Energy Agency’s Global EV Outlook 2026 provides particularly strong evidence of this structural concentration. Approximately 22 million electric cars were produced worldwide in 2025, an increase of more than 25% compared with 2024. China manufactured approximately 16 million, representing nearly three-quarters of global electric-car production under the IEA’s relevant definition, and exported more than 2.5 million electric cars. The agency reported that China’s electric-car production exceeded domestic demand by approximately 20%, providing a substantial production base from which manufacturers could expand sales abroad. Electric vehicles accounted for more than 35% of China’s total car exports in 2025, compared with approximately 20% in the previous year. Global EV Outlook 2026: Manufacturing and Trade — International Energy Agency — 2026.
The difference between production capacity and domestic demand is strategically important because it creates pressure to find external markets, but it should not automatically be interpreted as economically unusable overcapacity. Manufacturing capacity is necessary to accommodate future growth, exports, model launches and variations in demand. The concern arises when sustained excess capacity combines with weak domestic demand, intense price competition and financing conditions that permit producers to continue expanding despite low profitability. Under those circumstances, foreign markets can become an increasingly important channel for absorbing production, while exporters may accept margins that established European manufacturers struggle to match.
China’s domestic automotive contraction during the first half of 2026 adds a second layer to this assessment. ACEA recorded a 23.2% decline in Chinese domestic registrations and a 5.8% contraction in Chinese vehicle production, even as China-origin imports into the European Union expanded substantially. This indicates that China’s international expansion is occurring under conditions of domestic market stress, not solely because Chinese demand remains unusually strong. A manufacturer facing weaker domestic sales may have a stronger commercial incentive to pursue European distribution, improve international marketing, establish local dealerships or consider production facilities outside China. Economic and Market Report: Global and EU Auto Industry — ACEA — October 2026.
Battery manufacturing is the central industrial asymmetry
The most decisive difference between the European and Chinese electric-vehicle ecosystems lies in battery production. By the end of 2025, global lithium-ion battery nameplate manufacturing capacity had exceeded 4 TWh, approximately 30% above the previous year’s level. China accounted for more than 80% of this capacity, while the European Union and the United States each accounted for approximately 6–7%. The disparity is not simply geographical. Chinese-headquartered producers supplied approximately three-quarters of the batteries deployed in electric cars globally in 2025, and their share of the EU market exceeded one-half, almost doubling relative to 2023. Their European presence included both imported cells and batteries manufactured at local facilities. Global EV Outlook 2026: Electric Vehicle Batteries — International Energy Agency — 2026.
These figures reveal a structural weakness that conventional automotive production statistics cannot adequately capture. Europe may retain the final assembly of electric vehicles while depending on foreign manufacturers for one of the most valuable, technically demanding and strategically sensitive components. A battery pack determines much of the vehicle’s energy-storage capability, influences range, charging performance and thermal management, and represents a major cost component. Its production requires complex materials processing, highly controlled manufacturing environments, quality assurance and extensive process optimisation. The location and ownership of battery manufacturing consequently influence not only the distribution of industrial value but also the accumulation of expertise relevant to future technologies.
Europe’s capacity expansion has not been negligible. The IEA reported that battery nameplate capacity in the EU and United States grew by approximately 50% during 2025, faster in percentage terms than China’s increase of just over 25%. Nevertheless, rapid percentage growth from a much smaller starting base does not eliminate the underlying scale difference. A region accounting for approximately 6–7% of worldwide capacity remains heavily exposed to the decisions of manufacturers operating in a region holding more than 80%, even when its own capacity expands at a faster annual rate. The distinction between relative growth and absolute industrial position is therefore central to evaluating claims of battery-sector recovery.
Table 5.1 — The global battery manufacturing hierarchy
| Indicator | Documented value | Reference period | Industrial significance |
|---|---|---|---|
| Global lithium-ion battery nameplate capacity | More than 4 TWh | End-2025 | Scale of installed worldwide manufacturing capability |
| Global capacity growth | Approximately +30% | 2025 versus 2024 | Rapid continued investment |
| Chinese share of global capacity | More than 80% | End-2025 | Exceptional geographic concentration |
| EU share of global capacity | Approximately 6–7% | End-2025 | Limited European manufacturing scale |
| US share of global capacity | Approximately 6–7% | End-2025 | Similar capacity share to the EU |
| EU battery-capacity growth | Approximately +50% | 2025 | Rapid expansion from a smaller base |
| Chinese battery-capacity growth | Slightly above +25% | 2025 | Continued absolute expansion of the dominant production base |
| Chinese producers’ share of global electric-car battery deployment | Almost 75% | 2025 | Manufacturer-level competitive concentration |
| Chinese producers’ share of EU electric-car battery supply | More than 50% | 2025 | European dependence includes imports and local production |
| Global EV battery deployment | Approximately 1.2 TWh | 2025 | Actual deployed battery demand, distinct from nameplate capacity |
Source: Global EV Outlook 2026: Electric Vehicle Batteries — International Energy Agency — 2026.
The distinction between installed capacity and actual output is especially significant for industrial-policy decisions. A newly constructed battery factory may possess a substantial nominal annual production capacity while producing far fewer saleable cells during its initial years. Achieving the required standards of quality, yield, manufacturing throughput and cost efficiency can require prolonged process development. The IEA notes that some battery facilities may take more than five years from the start of operations to approach nominal output, and that competitive production generally requires saleable yields exceeding 90%. This means that public announcements of gigawatt-hour capacity cannot be treated as evidence that Europe has already acquired equivalent competitive supply. A factory approaching mechanical completion, a facility beginning trial production and a plant operating profitably at industrial scale represent different levels of capability. Global EV Outlook 2026: Electric Vehicle Batteries — International Energy Agency — 2026.
The resulting investment problem is unusually difficult. European battery producers must finance the construction of facilities while simultaneously developing manufacturing expertise in a market where established competitors already possess large-scale production experience and extensive supplier relationships. During ramp-up, elevated scrap rates, lower equipment utilisation and quality-control expenditure can increase unit costs. If manufacturers must sell cells at prices determined by highly efficient Asian competitors, the financial period preceding commercial maturity may become prohibitively expensive. Public financing can bridge part of that period, but sustainable competitiveness ultimately requires operational performance rather than indefinite subsidies.
The battery-price differential: scale, chemistry and manufacturing efficiency
The IEA reported that average battery-pack prices in China were approximately 35% below European prices in 2025, compared with a difference of approximately 25% in 2022. The divergence therefore widened despite falling battery prices internationally. The agency also found that battery production costs in Europe and the United States remained as much as 50% above Chinese production costs when public support measures were excluded. These are different comparisons: the first concerns observed average regional pack prices, while the second concerns manufacturing costs under the agency’s relevant production analysis. They should not be combined into a single measure or applied indiscriminately to every battery chemistry and production facility. Global EV Outlook 2026: Electric Vehicle Batteries — International Energy Agency — 2026.
The industrial importance of the price gap is that battery economics influence the competitiveness of an entire electric vehicle. A lower pack cost can permit a manufacturer to offer a more affordable car while maintaining a similar gross margin, or to retain a higher margin at the same selling price. The advantage becomes especially powerful in the lower-priced market segments where consumers are highly sensitive to the initial acquisition cost. Manufacturers purchasing batteries at materially higher prices must compensate through superior vehicle pricing, manufacturing efficiency, reduced costs elsewhere or lower margins. These options may be available to premium brands with strong customer loyalty, but are substantially more difficult for manufacturers competing in the mass market.
Battery chemistry further differentiates competitors. Lithium iron phosphate batteries, generally referred to as LFP, use a different cathode chemistry from nickel manganese cobalt batteries and can offer lower material costs, although energy-density, thermal and performance characteristics depend on cell design and application. The IEA reported that LFP battery packs were more than 40% cheaper on average than NMC alternatives per kilowatt-hour in 2025, while noting that the difference partly reflected the composition of the market, including energy-storage applications where energy density is less constraining. It would therefore be incorrect to interpret the observed price differential as a universal manufacturing saving available to any vehicle producer that substitutes LFP for NMC.
The strategic relevance of LFP is nevertheless substantial. Lower-cost chemistry can support affordable electric vehicles, reduce dependence on nickel and cobalt and potentially simplify parts of the procurement system. China dominates the relevant manufacturing ecosystem, however, including the cathode materials and precursor supply chains. The IEA reported that LFP batteries represented more than 10% of EU electric-vehicle battery demand in 2025 and that nearly all of that demand depended on Chinese production, either through batteries imported directly or batteries incorporated into vehicles imported from China. Approximately 30% of this LFP supply arrived directly as batteries, while nearly 70% was embedded in imported vehicles. Global EV Outlook 2026: Electric Vehicle Batteries — International Energy Agency — 2026.
Table 5.2 — Battery economics and European industrial exposure
| Competitive variable | Documented finding | Economic mechanism | European vulnerability |
|---|---|---|---|
| Regional pack prices | China approximately 35% below Europe in 2025 | Lower input cost for vehicle manufacturers | Higher production cost for European BEVs |
| Regional battery manufacturing costs | Up to 50% higher in Europe and US than China, excluding support | Efficiency, automation and material-cost differences | Difficult ramp-up economics |
| LFP versus NMC pack prices | LFP more than 40% cheaper on average in 2025 | Chemistry and application mix | Dependence on competitive LFP access |
| EU LFP sourcing | Nearly entirely Chinese-origin | Imported cells or vehicles containing LFP batteries | Limited European upstream autonomy |
| Competitive production yields | Generally above 90% | Lower manufacturing scrap and better throughput | High initial costs at new plants |
| Cell-factory ramp-up | Potentially more than five years to approach nominal output | Process learning and manufacturing validation | Time lag between investment and competitive supply |
| Chinese global battery-cell position | More than 80% of manufacturing capacity | Scale and technical expertise | Concentrated external supply |
| Chinese share of battery deployment in EU electric cars | More than half in 2025 | Established producer position | Supplier and technology dependence |
Source: Global EV Outlook 2026: Electric Vehicle Batteries — International Energy Agency — 2026.
These differences help explain why tariff protection alone cannot resolve Europe’s electric-vehicle competitiveness problem. A tariff on a Chinese-manufactured finished car can increase the relative attractiveness of a European-assembled vehicle, but if that European vehicle uses expensive batteries or components imported from China, its underlying manufacturing disadvantage remains. Alternatively, foreign battery producers can establish production facilities in Europe, improving local employment and vehicle supply while retaining ownership of essential technology and purchasing relationships. Both outcomes may be economically beneficial in particular circumstances, but neither automatically establishes a fully autonomous European battery industry.
The midstream supply chain: Europe’s most serious industrial dependency
The international battery supply chain consists of several distinct stages: extraction of critical minerals, refining and chemical processing, production of precursor materials, manufacturing of cathode and anode active materials, cell production, pack assembly, vehicle integration and recycling. Each stage requires different capital equipment, expertise, environmental management and market conditions. Strategic vulnerability arises when a large share of the global capacity for one or more indispensable stages is concentrated in a limited number of jurisdictions.
According to the IEA, China accounted in 2025 for approximately 85% of global cathode active material production and more than 90% of anode active material production for electric-car batteries. Cathode precursors, LFP components and graphite-based anode supply chains are particularly concentrated. These activities are less visible than final vehicle assembly, but they can determine whether a battery factory has access to essential inputs at commercially viable prices and within reliable delivery schedules. A European cell manufacturer may therefore establish an advanced factory while still depending on imported materials whose availability and price are influenced by Chinese producers and policy decisions. Global EV Outlook 2026: Manufacturing and Trade — International Energy Agency — 2026.
The manufacturing implications are substantial. A battery plant cannot compensate for an interruption in a critical cathode or anode material simply by increasing labour productivity. Its operation depends on continuous access to precisely specified materials whose chemical characteristics, consistency and quality are compatible with validated cell designs. Changing suppliers may require technical qualification, testing and modification of production processes. Industrial resilience therefore depends not merely on obtaining alternative materials from another country but on having alternative suppliers capable of meeting the same technical standards at sufficient scale.
China’s position also extends into the equipment and technical knowledge required to establish new manufacturing facilities. Restrictions affecting production machinery, specialised processes or technical assistance can slow the development of alternative supply chains even if raw materials remain available. The IEA identified the implications of Chinese export-control measures announced in October 2025, subsequently paused for one year, as a material source of potential risk for cathode materials, anodes, LFP technologies and associated equipment. The significance lies in the possibility that supply-chain concentration affects Europe’s ability to build substitute capacity, not only its ability to operate existing factories. Global EV Outlook 2026: Electric Vehicle Batteries — International Energy Agency — 2026.
European battery sovereignty requires more than domestic cell assembly
The European Union’s Critical Raw Materials Act establishes strategic benchmarks for 2030 intended to improve the security of supply. These include EU extraction capacity equivalent to at least 10% of annual consumption of strategic raw materials, processing capacity of at least 40%, recycling capacity of at least 25%, and a diversification objective under which no more than 65% of the Union’s annual consumption of an individual strategic raw material should depend on a single third country at a relevant processing stage. These are policy benchmarks, not verified statements that the EU had achieved the corresponding capabilities by October 2026. Critical Raw Materials Act — European Commission.
The act provides a framework for reducing strategic dependencies, but the industrial economics of implementation remain demanding. Extracting a mineral within Europe does not eliminate the need for refining capacity, and processing capacity does not automatically establish competitive cathode or anode manufacturing. Each stage requires customers, adequate scale, reliable energy and environmental compliance. A European strategy that develops extraction while leaving the commercially essential intermediate processes dependent on imported materials may improve one indicator of sovereignty without materially reducing the system’s vulnerability.
Recycling introduces a further temporal problem. The IEA estimates that the availability of end-of-life batteries suitable for recycling will lag the deployment of batteries by roughly fifteen years, reflecting their operating lives in vehicles and energy-storage applications. Consequently, the rapid expansion of Europe’s electric fleet does not immediately create an equivalent volume of recycling feedstock. The agency also reports that China possesses more than 85% of global battery recycling capacity. This concentration demonstrates that the recycling stage, often presented as a future source of strategic independence, is itself internationally uneven and requires sustained industrial development. Global EV Outlook 2026: Electric Vehicle Batteries — International Energy Agency — 2026.
A credible European recycling strategy must therefore distinguish capacity from available feedstock and planned recovery from actual recovery. A recycling facility constructed today may depend initially on battery manufacturing scrap, imported materials or other sources because large volumes of European vehicle batteries have not yet reached the end of their operating lives. The economics of the facility can be fragile if it was designed on the assumption that substantial end-of-life volumes would arrive earlier. Conversely, delaying recycling investment until those volumes become available could leave Europe dependent on established foreign processors. The appropriate strategy requires staged investments, realistic feedstock forecasts and commercially viable intermediate recovery activities.
Chinese finished vehicles: competitive pressure beyond the battery market
China’s expansion in finished vehicles reflects more than its battery advantage. Manufacturers benefit from a large domestic supplier ecosystem, extensive production experience and the ability to integrate design, electronics, battery systems and assembly. These advantages can shorten product-development cycles and reduce coordination costs where suppliers, engineering teams and production facilities operate within closely connected industrial clusters. They can also support the introduction of vehicles designed around electric propulsion rather than architectures originally developed for combustion engines.
The IEA reports that China’s electric-car exports exceeded 2.5 million vehicles in 2025, roughly doubling compared with the previous year. As China’s domestic market weakened in 2026, the incentive to increase overseas sales became stronger. Europe represents an attractive destination because its regulatory framework supports electric demand and its consumers include both premium and mass-market segments. Yet the competitive pressure is not limited to low-priced electric vehicles. Chinese manufacturers can compete through technology, vehicle equipment, digital functions, financing and distribution strategies, while multinational manufacturers operating in China can use their local production capacity to serve European markets. Global EV Outlook 2026: Manufacturing and Trade — International Energy Agency — 2026.
The distinction between Chinese-owned brands and China-origin production is again essential. European manufacturers have developed manufacturing operations in China, and some of their vehicles exported to Europe contribute to the China-origin import statistics. In such cases, the competitive issue is not simply the arrival of a foreign brand but the international allocation of manufacturing activity within multinational corporate groups. A manufacturer may decide that a Chinese plant provides the most economical location for producing a vehicle intended for European consumers. That decision can enhance company-level profitability while reducing European assembly activity. Industrial policy must therefore consider the production choices of European companies as well as the exports of Chinese competitors.
Trade defence: necessary legal distinctions and industrial limits
The European Commission concluded an anti-subsidy investigation into battery-electric vehicles originating in China in October 2024, imposing definitive countervailing duties for five years. The investigation established, under the applicable EU trade-defence framework, that the relevant Chinese BEV value chain benefited from countervailable subsidisation that threatened injury to EU producers. The resulting duties were additional to the ordinary customs framework and differentiated by producer according to the investigation’s findings. EU Imposes Duties on Unfairly Subsidised Electric Vehicles from China — European Commission — October 2024; Commission Implementing Regulation (EU) 2024/2754 — European Commission — October 2024.
The legal basis matters because the duties were not simply a discretionary industrial preference for European manufacturers. They followed an investigation applying the rules governing subsidised imports and the threat of injury. Nor do the measures cover every vehicle imported from China. Their product scope is defined by the regulation and focuses on qualifying new battery-electric vehicles, including specified vehicles with range-extender configurations. Conventional combustion vehicles and other products cannot automatically be assumed to face the same measures.
The trade-defence system can reduce the price advantage arising from investigated subsidies, but it does not remove legitimate manufacturing advantages generated by productivity, efficient industrial organisation or superior products. A manufacturer capable of producing a vehicle at lower cost through better engineering or scale may remain competitive after tariffs. Moreover, duties can create incentives for exporters to establish local production facilities, modify supply chains or alter product offerings. Such adjustments may support European employment, but their contribution to industrial sovereignty depends on the depth of local manufacturing and technological activity.
The central economic distinction is between correcting unfair competition and protecting inefficient production. Trade defence can be justified where the legal evidence establishes subsidisation and injury; it cannot substitute for investment in technology, skills and productivity. An EU industry that remains structurally dependent on imported batteries and components may face persistent cost disadvantages even after imports of finished vehicles become more expensive.
China’s international production strategy and the limits of European localisation
Foreign investment by Chinese manufacturers in European automotive production can improve the Union’s industrial position under certain conditions. A factory established in Europe generates demand for construction, logistics, energy, maintenance and specialised employment. It may also create opportunities for local suppliers and training institutions. However, its contribution to technological autonomy depends on whether engineering capabilities, software development, battery technology and procurement decisions are also located within Europe.
A plant that primarily assembles imported high-value components can increase domestic vehicle-production statistics while leaving a substantial share of its value chain abroad. A more deeply integrated facility, incorporating local cell production, component sourcing, manufacturing engineering and technical development, can deliver greater industrial benefits. The difference should be measured through verifiable local value added rather than the nationality of the investor.
The IEA’s 2026 manufacturing outlook suggests that Europe possesses considerable potential electric-vehicle manufacturing capacity. Its Stated Policies Scenario indicates that EU electric-vehicle manufacturing capacity, including dedicated and mixed-powertrain facilities, could reach approximately 15 million units annually by 2030, compared with modelled domestic electric-vehicle demand of roughly 7 million units. These are forward-looking capacity and demand estimates, not operating results. Their significance is that Europe may face a problem of insufficient competitive utilisation rather than simply insufficient physical assembly capacity. The construction or conversion of factories does not guarantee that they will receive enough commercially viable orders to operate efficiently. Global EV Outlook 2026: Manufacturing and Trade — International Energy Agency — 2026.
This distinction materially changes the industrial-policy debate. If projected European assembly capacity exceeds expected domestic demand, simply announcing additional factories cannot demonstrate that the Union is resolving its competitiveness problem. The relevant variables become plant utilisation, manufacturing costs, export performance, supplier content and access to profitable market segments. An industrial strategy that expands nominal capacity without solving those factors can create a new generation of stranded assets.
Chapter 5 — Key judgments
China’s automotive competitive position is rooted in an integrated industrial system extending from materials processing and battery chemistry to finished-vehicle production. The documented scale of Chinese battery manufacturing, its cost advantage and its control over substantial portions of the cathode, anode and recycling supply chains establish dependencies that cannot be corrected through measures targeting finished vehicles alone.
The European Union’s principal industrial challenge is to transform its existing engineering and manufacturing strengths into competitive battery-electric production while developing sufficient domestic or diversified supply chains for essential components. The risk is not merely that Chinese vehicles become more common in European showrooms, but that European factories increasingly depend on foreign-controlled technologies and intermediate goods.
What would change the assessment: Competitive European battery production with commercially viable yields, diversified cathode and anode supplies, stronger local value added in electric vehicles and sustained export competitiveness would reduce the present vulnerability. Continued concentration of component production, unsuccessful European battery-factory ramp-ups and growing dependence on imported powertrain systems would strengthen it.
Open official record: The most consequential evidence consists of audited European battery-cell output and costs, material-specific supply-chain concentration data, verified local-content information for imported and European-assembled vehicles, and updated outcomes of the EU’s trade-defence measures.
Chapter 6 — Industrial Competences, Employment and Regional Clusters: Germany, France, Italy and the United Kingdom
The industrial consequences of automotive transformation cannot be measured through assembly employment alone
Europe’s most consequential automotive vulnerability is the potential erosion of accumulated manufacturing and engineering capabilities that cannot be rapidly reproduced once factories, specialist suppliers and industrial research organisations cease operating as integrated systems. The automotive industry supports a network of productive activities extending well beyond the final assembly of cars: advanced metallurgy, precision engineering, industrial machinery, electronic control systems, mechanical transmissions, materials development, specialised chemicals, robotics, testing, software, logistics and technical services. The transition from combustion-related powertrains to battery-electric architectures changes the demand for these capabilities unevenly. Certain activities face substantial long-term contraction, others remain essential, and new activities require additional skills and manufacturing investment. The central industrial-policy question is whether the adjustment can be managed while maintaining a viable European network of production and technological development.
The European Automobile Manufacturers’ Association’s employment statistics illustrate the scale of the exposure. Its 2026 industry information identifies more than 13 million direct and indirect jobs associated with the European automotive sector across manufacturing, services and transport. Earlier detailed country-level reporting recorded approximately 2.4 million direct automotive manufacturing jobs in the EU, including 872,446 in Germany, 214,904 in France and 165,218 in Italy. These figures refer to their published statistical vintages and should not be treated as verified October 2026 employment counts. The distinction matters because employment in a manufacturing sector is a stock measured at a particular date, while restructuring announcements, production changes and investment decisions are flows or events occurring over time. Employment in the Automotive Industry — ACEA — September 2026; Direct Automotive Manufacturing Jobs in the EU, by Country — ACEA — September 2024.
The significance of automotive employment extends beyond its aggregate size. Manufacturing jobs are often concentrated within particular regional clusters, where employment opportunities, supplier relationships and technical education have developed around a limited number of major factories and industrial customers. A reduction in activity at a large assembly operation can affect surrounding suppliers, industrial services, transport companies and local public revenues. Conversely, an investment in battery manufacturing or electric platforms can generate new jobs without necessarily replacing the lost positions in the same geographical area, occupational category or income bracket. Employment gains and losses therefore need to be assessed through their locations and technical characteristics rather than simply netted against one another at the European level.
The distinction between preserving jobs and preserving industrial capabilities
The preservation of employment is a legitimate objective of industrial policy, but it must be distinguished from the preservation of productive capability. A factory can continue employing workers while producing declining volumes at an unsustainable cost, in which case employment protection may be temporary. Conversely, manufacturing productivity improvements can reduce labour requirements per vehicle while strengthening a plant’s commercial competitiveness and supporting long-term investment. The relevant public objective is therefore to preserve viable industrial ecosystems capable of generating sustained employment, innovation and value added, not to maintain every existing production process indefinitely.
The transition affects different categories of automotive work in different ways. Internal-combustion engine manufacturing relies on complex machining, casting, forging, precision measurement, lubrication, fuel-injection systems, exhaust treatment and mechanical assembly. Battery-electric vehicle production replaces some of those components with electrical machines, inverters, battery systems, power electronics and alternative thermal-management architectures. However, it also retains substantial requirements for vehicle structures, brakes, suspension, safety systems, body manufacturing, electronics, industrial automation and quality assurance. The transformation is therefore neither a complete disappearance of existing automotive expertise nor a simple one-for-one substitution of workers from mechanical engineering to battery manufacturing.
Some engineering competencies are transferable with additional training. Precision manufacturing, industrial metrology, thermal engineering, systems integration, power electronics and advanced production automation can remain valuable across multiple propulsion technologies. Other competencies are more specialised and require substantial retraining or investment in new equipment. A public programme claiming that every combustion-engine worker can be redeployed directly into battery manufacturing would therefore underestimate the differences in skills, location and production processes. Equally, a programme that treats traditional automotive engineering as obsolete would risk discarding competencies that remain commercially valuable in other industrial activities.
The technical content of the transition also varies by company. Manufacturers producing premium vehicles with complex powertrains, software systems and advanced electronics may preserve substantial engineering employment while changing the distribution of specialist skills. Suppliers concentrated in conventional engine components may face more severe adjustment pressures. Companies already producing industrial electronics, precision equipment or thermal-management systems may be comparatively well positioned to enter new electric-vehicle markets. National industrial strategies should consequently identify the actual technological capabilities of firms and regions rather than relying exclusively on broad employment categories.
Germany: the challenge of transforming Europe’s largest automotive manufacturing system
Germany’s exposure is exceptional because of the scale of its vehicle manufacturing, the density of its supplier network and the central role automotive exports play in its industrial economy. ACEA’s first-half 2026 production statistics identify Germany as the Union’s largest passenger-car manufacturing location, accounting for approximately one-third of EU output. Its importance extends beyond vehicle assembly: Germany hosts major engineering organisations, automotive suppliers, machinery manufacturers and research institutions that contribute to the development and production of vehicles across Europe and internationally. The sector’s international integration means that decisions concerning German manufacturing allocation can influence suppliers and employment in neighbouring countries.
The German industrial challenge is therefore not simply to replace domestic combustion-engine sales with battery-electric vehicles. It is to preserve the economic foundations of a manufacturing system historically successful in producing high-value vehicles, advanced mechanical systems and capital-intensive production equipment. Germany’s established strengths in engineering, manufacturing automation and premium automotive products provide substantial assets for the transition. Yet the same industrial structure creates exposure because a large proportion of its supplier capabilities and fixed investment has been developed around complex combustion-engine and transmission systems.
Germany’s position is also shaped by its dependence on export markets. A manufacturing system designed to serve international demand cannot sustain its existing scale solely through domestic consumption. Changes in American trade policy, Chinese vehicle demand and international competition therefore affect the utilisation of German factories even if the domestic transition proceeds relatively successfully. In this respect, the challenge facing Germany is more extensive than the compliance cost of European emissions regulation. It concerns the competitiveness of German-produced vehicles in global markets where competing manufacturers may enjoy lower battery costs, different energy prices or stronger local supply-chain integration.
The employment implications are substantial. ACEA’s detailed published country data identified 872,446 direct automotive manufacturing positions in Germany, placing it far ahead of other EU member states. The figure is not a forecast of jobs at risk, but it establishes the scale of the workforce potentially affected by technological change and manufacturing relocation. Direct Automotive Manufacturing Jobs in the EU, by Country — ACEA — September 2024.
Germany’s industrial strategy must therefore address at least three interconnected needs: maintaining competitive vehicle assembly, converting specialised suppliers towards future products and preserving the engineering capabilities that support both activities. Investment in battery-cell manufacturing can reduce one category of dependency, but it will not by itself protect the broader supplier network. Equally, preserving combustion-related production without sufficient investment in electric platforms and software would expose German firms to declining long-term demand. The most resilient industrial pathway is one in which existing manufacturing competencies are redirected towards technologically relevant products while the transition is managed at a pace compatible with commercially viable investment.
France: the relationship between industrial localisation, battery investment and domestic production
France faces a different strategic problem. Its automotive industry retains important manufacturing and engineering capabilities, but its domestic production scale is considerably smaller than Germany’s. This difference makes the allocation of new vehicle programmes and battery investments especially important. A major electric-vehicle production programme can influence the utilisation of an existing plant and its regional supplier network, while a decision to manufacture the same vehicle abroad can produce a materially different industrial outcome even when the brand and engineering identity remain French.
France has pursued industrial localisation as an important element of its economic strategy, linking vehicle electrification to domestic manufacturing, battery investment and regional development. The strategic logic is that electric-vehicle demand should help rebuild or sustain production capacity rather than simply replace one category of imported vehicles with another. Battery investment can contribute to this objective by attracting component suppliers, specialist engineering firms, industrial services and technical training programmes.
However, domestic manufacturing localisation is only economically sustainable if the resulting production can compete on cost, quality and technological performance. Public support can assist initial investment and reduce financing risk, but it cannot permanently compensate for large productivity disadvantages. A battery factory that operates at low yield or depends on expensive imported intermediate materials may generate domestic production and employment while remaining commercially fragile. A vehicle manufacturer sourcing from such a facility may then face higher costs than a competitor using established foreign suppliers.
The French policy challenge is consequently to align environmental regulation, industrial financing and manufacturing competitiveness. The objective should not be assessed solely through the number of announced factories or nominal battery capacity. Relevant evidence includes the achievement of commercial production, operational yields, domestic supplier contracts, sustained employment and the proportion of vehicle value added created within France. These measures distinguish an industrial ecosystem capable of reproducing itself economically from one dependent on repeated public intervention.
France’s comparatively smaller production scale also places importance on the distribution of manufacturing activity among European countries. European manufacturers operate integrated production networks in which vehicle models and components can be allocated across several jurisdictions. French industrial policy must therefore compete for investment within Europe as well as against external manufacturing locations. The result is a tension between the Union’s collective objective of strengthening European production and individual member states’ incentives to attract factories and associated employment to their own territories.
Italy: the vulnerability of specialised suppliers and the opportunity in advanced industrial equipment
Italy’s automotive exposure differs significantly from that of Germany and France because the country’s industrial strength is distributed across a large number of specialised manufacturing activities, including precision engineering, industrial automation, components, tooling, mechanical systems and advanced manufacturing equipment. This structure creates substantial opportunities to participate in future electric-vehicle supply chains, but it also exposes individual suppliers to the decline of established combustion-engine programmes.
The principal Italian risk is not merely the possibility of losing final vehicle assembly. It is that smaller and medium-sized suppliers possessing sophisticated technical capabilities may lack the capital required to redesign products, acquire new equipment, qualify for different automotive platforms or enter international battery and electronics supply chains. A supplier producing precision components for combustion engines may possess valuable manufacturing expertise while facing the disappearance of its principal market. Converting that expertise into new applications can require substantial engineering expenditure before new contracts generate revenue.
The transition therefore presents a financing problem as well as a technological one. Smaller suppliers may have limited access to long-term capital, and the uncertainty surrounding future powertrain demand can discourage investment. If a firm does not know whether its principal automotive customers will continue ordering hybrid components or move rapidly to battery-electric architectures, it may postpone investment in both technologies. Such delays can weaken its competitive position precisely when international suppliers are expanding their capabilities.
Italy also has an opportunity to use its expertise in manufacturing machinery and automation to supply equipment required for the broader European battery and electric-vehicle transition. Battery production, electric-motor assembly, power electronics and vehicle manufacturing all require sophisticated equipment, process control and quality assurance. Italian firms capable of developing and supplying those systems may benefit from the transition even where domestic passenger-car assembly remains limited. The strategic objective is therefore to preserve and expand technically sophisticated industrial activities rather than defining automotive sovereignty exclusively by the number of vehicles assembled within national borders.
The policy implications are clear. Italy requires instruments that help specialised suppliers finance product conversion, establish relationships with new manufacturers and participate in European research and procurement programmes. Training and industrial-investment support should be connected to verifiable customer demand and commercially relevant technologies. Programmes that simply subsidise declining combustion-related production without creating alternative markets risk postponing adjustment until firms have exhausted the capital needed to undertake it.
The United Kingdom: a separate regulatory system within an integrated European manufacturing economy
The United Kingdom occupies a distinct position because it is no longer part of the European Union but remains deeply integrated into European automotive supply chains and vehicle trade. Its regulatory framework, international trade arrangements and industrial policies differ from those of the Union, yet decisions taken in Brussels continue to affect British manufacturers through market access, product requirements and the sourcing of components.
The Society of Motor Manufacturers and Traders reported that UK vehicle production declined by 7.5% during the first half of 2026, to 385,979 passenger cars and commercial vehicles combined. Passenger-car production reached 371,756 units, representing a 3.6% decline compared with the corresponding period in 2025. Approximately 76.9% of passenger cars produced in the United Kingdom during the period were exported. These figures establish the country’s continuing dependence on foreign markets, notwithstanding its separate regulatory framework. Vehicle Output Stabilises but Investment at Risk Without Urgent Action — SMMT — July 2026.
The export orientation of UK manufacturing is especially important because a large proportion of British-produced vehicles are sold to European customers. A manufacturer considering investment in a UK battery or assembly facility must therefore assess not only domestic vehicle regulation but also the commercial conditions governing exports to the European Union. Changes in rules of origin, tariffs, local-content requirements or the relative treatment of different powertrains can materially affect the economic viability of production. A vehicle assembled in Britain using imported battery cells may face different supply-chain considerations from one produced with locally manufactured cells, and the resulting decisions can influence whether future investment is allocated to the UK, the EU or another jurisdiction.
The SMMT reported in September 2026 that UK passenger-car production had reached 472,851 units during the first eight months of the year, down 3.9% compared with the equivalent period in 2025, while exports remained the destination for 76.7% of production. The association also reported that electrified vehicles, including battery-electric and hybrid models, accounted for 43.6% of August passenger-car output. These figures indicate that British manufacturing is already participating substantially in electrified production, even as aggregate output remains under pressure. They do not establish the profitability of those vehicles or the extent of domestic battery content. Vehicle Manufacturing Grows Alongside £1bn Investment Boost but EU Trade Threats Loom — SMMT — September 2026.
The UK’s strategic industrial choices consequently involve balancing domestic regulatory objectives with access to the European market. Regulatory divergence can provide flexibility in certain circumstances, but it can also increase compliance costs if manufacturers must adapt vehicles to different regimes. Greater alignment can reduce market friction but may constrain national policy discretion. The appropriate balance depends on the economic value of integrated production, the scale of domestic demand and the importance of exports for individual manufacturers.
Comparing national industrial exposures requires different measures from those used to compare vehicle sales
The four national cases demonstrate why automotive industrial strategy cannot be reduced to a uniform European policy. Germany faces the transformation of a very large manufacturing system with substantial export exposure. France must consolidate domestic production and battery investment while competing for future vehicle programmes. Italy must protect specialised suppliers and manufacturing expertise while expanding participation in new technologies. The United Kingdom must preserve access to European markets while operating under a separate regulatory framework.
These differences require different policy instruments. Germany’s priorities include large-scale manufacturing conversion, supplier resilience and international competitiveness. France requires successful localisation and commercially viable battery production. Italy needs financing and technological assistance for supplier transformation. The United Kingdom must address trade access, energy costs and the competitiveness of export-oriented manufacturing.
Table 6.1 — National industrial exposure and strategic priorities
| Country | Principal industrial structure | Main transition vulnerability | Highest-leverage industrial response | Strategic limitation |
|---|---|---|---|---|
| Germany | Large vehicle assembly and engineering system; extensive supplier networks | Global export competition and declining demand for combustion-related components | Manufacturing productivity, supplier conversion, battery integration and export competitiveness | High exposure to international market conditions |
| France | Vehicle manufacturing, engineering and battery-localisation programmes | Insufficient scale or profitability in new production investments | Operational battery competitiveness and domestic vehicle-platform allocation | Public investment does not guarantee sustainable production |
| Italy | Specialised components, precision machinery, automation and industrial suppliers | Supplier financial fragility and loss of established engine-related contracts | Technology conversion, access to capital and entry into new European supply chains | Limited control over final vehicle-platform allocation |
| United Kingdom | Export-oriented vehicle production and engineering | Market-access uncertainty, trade costs and manufacturing investment allocation | EU market coordination, competitive energy costs and local battery investment | Separate regulatory and customs framework |
Sources: Economic and Market Report: Global and EU Auto Industry — ACEA — October 2026; Direct Automotive Manufacturing Jobs in the EU, by Country — ACEA — September 2024; Vehicle Manufacturing Grows Alongside £1bn Investment Boost but EU Trade Threats Loom — SMMT — September 2026.
Regional clusters: why the loss of one production programme can propagate through an industrial system
Automotive manufacturing is characterised by strong relationships between vehicle producers and specialised suppliers. Component manufacturers frequently invest in equipment, engineering and quality systems tailored to specific vehicle platforms or customer requirements. These investments are justified by expectations of future production volumes. When a manufacturer cancels a programme, relocates assembly or changes its powertrain architecture, suppliers can lose expected orders even where their existing facilities remain technically operational.
The resulting financial effect can be more severe for smaller suppliers than for the manufacturer initiating the change. A multinational carmaker may reallocate production across countries or platforms, while a specialised supplier with a concentrated customer base may have few alternative contracts. Production equipment developed for a particular component cannot always be economically converted to a different product. Engineering personnel may possess highly valuable expertise but require substantial retraining before applying it to new markets.
This creates a risk of cumulative industrial weakening. Lower orders reduce supplier revenues, which limit investment and research expenditure. Reduced investment weakens competitiveness for future contracts, increasing the probability of further order losses. If several firms within the same cluster encounter similar difficulties, the region may gradually lose specialised subcontractors and technical services. Even surviving manufacturers can then face higher costs because previously localised supply chains must be reconstructed elsewhere.
The preservation of regional clusters therefore requires more than direct support for major assembly plants. Industrial policy must consider component suppliers, production equipment manufacturers, specialist testing facilities, training institutions and research organisations. An assembly plant can remain operational while the surrounding supply chain becomes increasingly dependent on imported components. Such a development may preserve visible manufacturing employment but reduce the region’s contribution to total vehicle value added.
Employment statistics must not be converted into unsupported forecasts of job losses
The size of Europe’s automotive workforce demonstrates the importance of the transition, but it does not provide a reliable numerical forecast of future displacement. A calculation that applies an assumed percentage loss to the entire sector would ignore the fact that many automotive jobs are not directly dependent on combustion engines. Vehicle structures, tyres, brakes, electronics, software, maintenance, logistics and numerous other activities remain relevant under different propulsion technologies.
Similarly, growth in battery manufacturing does not necessarily create an equivalent number of jobs to those lost in engine production. Employment intensity differs between manufacturing processes, and automation can substantially reduce labour requirements per unit of output. The geographical location of new jobs can also differ from that of displaced workers. An increase in battery employment in one region cannot automatically compensate for the closure of a component factory elsewhere.
The appropriate analytical framework distinguishes employment exposure from employment loss. Exposure identifies positions associated with activities that may be affected by changing technology or production geography. Loss requires evidence of actual workforce reductions. Forecasts require assumptions about future production volumes, labour productivity, investment and supplier conversion. Without these inputs, an apparently precise estimate of European automotive employment losses would be misleading.
The possibility of industrial conversion beyond the automotive sector
Preserving industrial capabilities does not necessarily require every supplier to remain within the automotive industry. Precision machining, materials engineering, electronics, control systems, industrial automation and specialised manufacturing equipment have applications in several other advanced sectors. A supplier facing declining demand for combustion-engine components may be capable of developing products for industrial machinery, energy systems, transport equipment or other technically demanding markets.
The feasibility of conversion depends on the similarity between existing and future production requirements. Some processes can be adapted with relatively limited investment, while others require new facilities, testing, certification and customer relationships. The availability of engineering expertise is an advantage, but not a guarantee of commercial success. A credible conversion policy must therefore connect technical capabilities with realistic market demand and provide financing suited to the time required for qualification and product development.
The European Commission’s automotive action plan of March 2025 explicitly recognised the importance of innovation, supply-chain resilience, skills and competitiveness alongside the transition to clean mobility. The plan emerged from a strategic dialogue involving manufacturers, suppliers and other stakeholders, reflecting the recognition that vehicle regulation alone is insufficient to manage the industrial transformation. Its policy areas include technological innovation, competitiveness, cleaner mobility and the social consequences of restructuring. Action Plan on the Future of the Automotive Sector — European Commission — March 2025.
The practical challenge is implementation. Training programmes should be connected to actual investment projects and employers capable of creating sustainable positions. Supplier-conversion financing should be linked to commercially credible products rather than abstract technological categories. Research collaboration should support the development of capabilities that European firms can manufacture competitively. Public resources should therefore be directed towards closing identifiable gaps in industrial capability rather than simply compensating firms for declining traditional markets.
Industrial sovereignty requires a hierarchy of capabilities
The concept of automotive sovereignty can become analytically imprecise when it is interpreted as the requirement to manufacture every component within the European Union. Modern vehicle production relies on international trade, and complete regional self-sufficiency would frequently be economically inefficient. A more defensible objective is to preserve sufficient control over strategically important capabilities while maintaining diversified and reliable access to international supply.
The degree of strategic importance differs among components. A widely available standardised part may be sourced internationally without creating a major vulnerability. A specialised battery material, semiconductor, manufacturing process or software system controlled by a small number of producers can generate much greater exposure, particularly where substitution is technically difficult or requires prolonged qualification. The strategic value of domestic production therefore depends on the consequences of supply interruption, the availability of alternatives and the time required to develop substitute capabilities.
This approach implies that European policy should distinguish between final assembly, essential component production, technological intellectual property, engineering expertise and production equipment. Each contributes to sovereignty in a different way. A factory assembling imported vehicle kits generates local employment but may possess limited control over key technologies. A European engineering company developing advanced manufacturing equipment can contribute substantially to industrial autonomy even if the final vehicles are assembled in another country. A domestic battery plant dependent on a single external source of cathode material may increase local value added while retaining a critical vulnerability.
The objective should therefore be to maintain an industrial system capable of adapting when international conditions change. This requires competitive firms, skilled workers, functioning supplier networks, reliable infrastructure and the ability to develop or acquire alternative technologies without unacceptable delay.
Chapter 6 — Key judgments
Europe’s automotive transition presents different industrial risks across Germany, France, Italy and the United Kingdom. Germany must transform a very large manufacturing and engineering system while preserving export competitiveness. France must ensure that electric-vehicle and battery investments develop into sustainable domestic production. Italy must protect specialised manufacturing capabilities and support suppliers facing technological displacement. The United Kingdom must maintain the competitiveness of an export-oriented automotive sector operating outside the Union’s regulatory framework.
The most important common vulnerability is the possible disappearance of specialised industrial capabilities before commercially viable replacement activities become established. Employment statistics demonstrate the scale of the exposure, but they do not justify precise forecasts of future job losses without detailed evidence on manufacturing programmes, supplier structures and investment decisions.
What would change the assessment: Sustained investment in new technologies, successful supplier conversion, competitive battery production, strong export orders and the preservation of engineering employment would support a more favourable industrial outlook. Permanent factory closures, supplier insolvencies, relocation of technical development and growing dependence on imported critical components would strengthen the assessment of structural weakening.
Open official record: Decision-makers require harmonised employment statistics by technological activity, plant-level manufacturing allocations, verified supplier-conversion programmes, actual investment expenditures and comparable national data on the location of automotive research and engineering functions.
Pillar II — Consolidated Strategic Assessment
The industrial evidence establishes that Europe’s automotive challenge is not confined to the speed of battery-electric adoption. The Union faces pressure on its external trade position, increasing penetration of vehicles manufactured in China, substantial concentration of battery technologies and materials processing outside Europe, and the risk that changes in production architecture will weaken established engineering and supplier networks. These pressures are interconnected but must not be treated as a single phenomenon. Import competition, battery costs, export-market weakness, technological change and employment restructuring operate through different mechanisms and require different policy responses.
China’s competitive position is particularly consequential because it extends across multiple stages of the electric-vehicle value chain. Its scale in battery manufacturing, materials processing and finished-vehicle production creates advantages that European manufacturers cannot necessarily overcome through final assembly or import duties alone. Yet Europe retains substantial industrial assets, including advanced engineering, manufacturing equipment, established brands, specialised suppliers and extensive vehicle-production capabilities. The central strategic question is whether these assets can be converted into a competitive industrial architecture for the next generation of vehicles.
The principal conclusion of Pillar II is that European automotive sovereignty must be measured through the capacity to design, manufacture and commercially sustain critical vehicle technologies, rather than through vehicle registrations, brand ownership or nominal factory announcements alone. A more electric European vehicle market can coexist with a weakening European manufacturing base unless industrial investment, productivity, supply-chain diversification and workforce conversion advance alongside the regulatory transition.
PILLAR III — STRATEGIC POLICY CHOICES, TRANSITION SCENARIOS AND INDUSTRIAL-SECURITY OUTCOMES
Chapter 7 — Technological Neutrality, Emissions Integrity and the Political Economy of Transition
Technological neutrality must be assessed as a problem of regulatory effectiveness, industrial efficiency and environmental accountability
The central judgment is that technological neutrality can improve Europe’s automotive transition only when it preserves genuine competition between technically viable solutions without weakening the credibility of emissions reductions or delaying investment in technologies likely to dominate future markets. The choice confronting European institutions is therefore more complex than the conventional opposition between binding electrification targets and unrestricted manufacturer discretion. The Union must determine which aspects of automotive decarbonisation should remain technologically prescriptive, which should be governed by measurable environmental performance, and which require specific industrial interventions because market competition alone cannot adequately address supply-chain concentration, infrastructure coordination or the loss of strategically important manufacturing capabilities. These questions must be distinguished because they involve different market failures, different institutional authorities and different consequences for investment.
The European Commission’s Automotive Package of 16 December 2025 provides an institutional foundation for reconsidering the balance. Its proposed revision of passenger-car and light-commercial-vehicle CO₂ standards envisages a 90% tailpipe-emissions reduction requirement from 2035, with compensation for the remaining emissions through qualifying low-carbon steel produced within the Union or eligible renewable fuels. The Commission presented this approach as a means of increasing technological flexibility while maintaining a long-term market signal towards electrification. The same package introduced the Battery Booster, with an announced €1.8 billion envelope, including €1.5 billion intended to support European battery-cell manufacturers through interest-free loans. These two elements address different dimensions of the transition: the proposed emissions amendment concerns the technologies manufacturers may use to meet regulatory obligations, while the Battery Booster concerns Europe’s ability to produce critical technologies competitively. Automotive Package — European Commission — December 2025. European Commission+1
The distinction is consequential because greater technological freedom does not automatically improve European industrial competitiveness. Manufacturers could respond to a broader range of permissible powertrains by retaining production of profitable hybrid vehicles within Europe, thereby preserving skilled employment and financing additional electric investment. They could equally respond by extending the commercial life of combustion-related products while postponing investment in batteries and electric platforms, leaving the underlying dependence on external technologies unchanged. The effects depend on manufacturers’ investment incentives, market expectations and financial constraints, rather than solely on the legal availability of different propulsion options. Any credible neutrality policy must therefore be accompanied by a framework that measures whether additional flexibility is producing productive investment, measurable emissions reductions and sustainable manufacturing activity.
Neutrality in emissions outcomes is not neutrality in industrial instruments
The concept of technological neutrality requires at least three distinct interpretations. The first is regulatory neutrality, under which manufacturers are permitted to select among technologies provided that their vehicles meet objectively defined environmental requirements. The second is fiscal neutrality, under which governments avoid providing materially different financial support to particular technologies. The third is industrial neutrality, under which public authorities refrain from privileging particular production capabilities or supply chains. These interpretations do not necessarily produce compatible outcomes. A government may adopt an emissions-performance standard that treats different technological solutions according to their measured environmental impact while simultaneously investing in battery production because excessive dependence on a concentrated foreign supplier constitutes an economic-security vulnerability.
The legitimacy of such differentiation depends on the public objective and the instrument selected. Where the objective is reducing greenhouse-gas emissions, differences in treatment should be justified through relevant emissions performance and credible accounting methods. Where the objective is industrial resilience, preferential support can be justified by strategically important supply-chain gaps, coordination failures or demonstrable barriers to the development of competitive manufacturing. Where the objective is correcting unfair competition, intervention should follow the applicable trade-defence rules and the findings of competent authorities. Combining these objectives without distinguishing their legal and economic foundations risks creating an opaque system of subsidies and exemptions that neither reduces emissions efficiently nor strengthens productive capacity.
This distinction has direct implications for the interpretation of the Commission’s proposed flexibility. Allowing a continuing role for hybrids and certain combustion vehicles can be compatible with stringent decarbonisation only if the calculation of residual emissions and the associated compensation mechanisms preserve environmental integrity. Conversely, promoting European battery production can be justified as industrial policy even if regulators retain some flexibility in the permissible vehicle mix. It is not necessary to claim that every battery-electric vehicle is environmentally superior under every conceivable production and electricity scenario to justify investment in battery technology; nor is it necessary to classify every hybrid as environmentally equivalent to a BEV to justify limited transitional flexibility. The governing requirement is to employ environmental accounting and industrial policy instruments appropriate to the specific objectives.
The environmental-accounting problem: tailpipe emissions, lifecycle emissions and industrial compensation
The European vehicle CO₂ regime is fundamentally constructed around regulated emissions performance for new vehicles, with manufacturer obligations determined through the applicable fleet-average framework. Lifecycle emissions are a broader concept. They include emissions associated with the extraction and processing of materials, manufacturing operations, electricity generation, fuel production, vehicle use and eventual treatment or recycling. The distinction matters because a vehicle with zero regulated tailpipe CO₂ emissions may have non-zero lifecycle emissions, while a hybrid or combustion vehicle may incorporate lower-emission materials or fuels without eliminating CO₂ emissions at the exhaust.
A technologically neutral framework cannot responsibly compare these outcomes without defining the measurement boundary. If the regulatory objective is fleet-wide tailpipe reduction, a reduction in steel-production emissions is not physically identical to a reduction in vehicle exhaust emissions. If the objective is economy-wide greenhouse-gas reduction, both may contribute, but they require consistent accounting, verified additionality and protection against double counting. In particular, manufacturers should not be allowed to claim reductions already counted elsewhere in the Union’s emissions framework without a demonstrable accounting basis. Otherwise, flexibility may create a nominal compliance outcome that differs from the actual reduction in total greenhouse-gas emissions.
The same issue applies to renewable fuels. A fuel’s climate performance depends on its complete production pathway, energy requirements, feedstocks and actual use. Synthetic fuels produced using low-carbon electricity and appropriately sourced carbon can have different lifecycle characteristics from fuels produced with carbon-intensive energy. Biofuels vary according to feedstock, land-use effects, processing requirements and sustainability conditions. The relevant policy question is therefore not whether e-fuels or biofuels should receive unconditional recognition, but whether a particular fuel pathway can produce verified emissions reductions at a cost and scale appropriate to the vehicles and applications in which it is used.
The Commission’s December 2025 proposal should be understood as a proposed mechanism for accommodating such technologies, not as conclusive evidence that all associated environmental-accounting difficulties have already been resolved. The precise treatment of eligible compensation, verification, certification, use and compliance must be evaluated against the operative legislative provisions. Proposal COM(2025) 995 on CO₂ Emission Performance Standards for New Light-Duty Vehicles — European Commission — December 2025; Automotive Package — European Commission — December 2025. EUR-Lex+1
Table 7.1 — Environmental integrity requirements by technology and compliance mechanism
| Technology or instrument | Principal emissions characteristic | Relevant verification requirement | Industrial implication | Risk if accounting is inadequate |
|---|---|---|---|---|
| Battery-electric vehicle | Zero operational tailpipe CO₂ | Electricity and manufacturing emissions assessed separately from tailpipe compliance | Increases demand for cells, electronics and charging infrastructure | Mistaking zero tailpipe emissions for zero lifecycle emissions |
| Conventional hybrid | Retains combustion-related tailpipe emissions | Certified emissions and monitoring of actual consumption | Preserves engine-related capabilities during transition | Overestimating emissions savings |
| Plug-in hybrid | Combines electric operation with combustion capability | Real-world electric-driving share, charging behaviour and actual fuel use | Supports transitional product demand | Certified emissions diverging from actual operation |
| Range-extender vehicle | Electric propulsion with combustion-supported energy generation | Fuel use, operating modes and applicable emissions classification | Offers additional product flexibility | Uncertain actual emissions benefits |
| E-fuel combustion | Tailpipe CO₂ remains; lifecycle performance depends on fuel pathway | Carbon sourcing, production electricity, certification and eligible use | Preserves selected combustion technologies | Double counting or unsupported carbon-neutrality claims |
| Sustainable biofuel combustion | Lifecycle benefit depends on feedstock and production | Sustainability criteria, lifecycle accounting and traceability | Potential applications across existing vehicle systems | Unsustainable feedstocks or exaggerated emissions savings |
| Low-carbon steel compensation | Reduces material-production emissions | Verified production emissions, additionality and certificate integrity | Creates demand for European lower-emission steel | Treating embodied and tailpipe reductions as automatically interchangeable |
| Manufacturer averaging | Changes timing of compliance assessment | Registration-weighted emissions and target calculations | Reduces exposure to isolated annual compliance shortfalls | Persistent underperformance concealed by temporary flexibility |
Legal and institutional sources: Regulation (EU) 2019/631 — European Parliament and Council — April 2019; Regulation (EU) 2025/1214 — European Parliament and Council — June 2025; Automotive Package — European Commission — December 2025. The industrial implications are analytical assessments, not legal classifications established by these instruments.
The political economy of a transition with overlapping technologies
The economic difficulty confronting manufacturers is not limited to the future market share of battery-electric vehicles. It also concerns the financing of overlapping industrial systems during the years when combustion, conventional hybrid, plug-in hybrid and battery-electric products coexist. Existing combustion platforms carry manufacturing assets, specialised suppliers and engineering programmes whose costs must be recovered over their commercial lives. Electric platforms require additional development expenditure, battery procurement, dedicated electronics, software capabilities and sometimes new manufacturing infrastructure. Operating both systems simultaneously can preserve consumer choice and reduce immediate market risk, but may also increase complexity and weaken economies of scale.
For manufacturers with strong balance sheets, technological coexistence can be a means of reducing uncertainty. Profitable hybrid models may generate cash flow that supports electric investment, while electric products gradually achieve sufficient volumes to benefit from lower unit costs. For financially weaker manufacturers, maintaining multiple architectures can create a different outcome: scarce development resources are distributed across too many platforms, product launches become more expensive and plants operate below optimal utilisation. In such circumstances, broader technological neutrality may increase costs rather than reduce them.
This is why the case for neutrality must be assessed at the level of industrial sequencing rather than broad permission. A temporary extension of an existing hybrid architecture can be economically different from the development of an entirely new combustion-engine family intended to remain in production for decades. The former may protect manufacturing continuity at limited incremental investment; the latter may require substantial capital commitments that become difficult to recover if demand declines. Public authorities should not assume that all spending on existing technologies has the same consequences for employment, emissions or long-term competitiveness.
The distinction is equally important for battery investment. Manufacturers choosing to delay the transition to electric architectures can reduce near-term financial pressure, but they may also forgo manufacturing learning, supplier development and economies of scale. The International Energy Agency reports that average battery-pack prices in China were approximately 35% below European prices in 2025, while European and American battery manufacturing costs remained as much as 50% higher than in China, excluding public support. These differences reflect industrial capabilities that require cumulative investment and production experience to narrow. A prolonged postponement of electric manufacturing can therefore increase the competitiveness gap that policymakers seek to address. Global EV Outlook 2026: Electric Vehicle Batteries — International Energy Agency — 2026. IEA
The conditions under which technological neutrality improves economic welfare
A more flexible regulatory regime is likely to improve industrial outcomes when several conditions hold simultaneously. First, the flexibility must respond to a genuine market or industrial constraint rather than merely protecting an incumbent product from competition. Second, the retained technology must provide measurable environmental benefits or fit within a credible pathway to the overall emissions objective. Third, the commercial life of the retained product must be compatible with continued investment in future technologies. Fourth, the flexibility must not undermine the financing assumptions of industrial projects that governments have already supported. Finally, the system must remain administratively manageable, with compliance rules clear enough to be incorporated into investment planning.
These conditions are demanding because they require policymakers to evaluate second-order consequences. A measure allowing additional plug-in hybrid sales may support a manufacturer’s profitability and preserve employment in combustion-related production. Yet if it significantly reduces expected BEV volumes, it may weaken the economics of a recently constructed battery factory. Conversely, a strict BEV requirement can support battery demand but increase manufacturers’ dependence on imported cells when domestic supply is not yet competitive. Neither effect can be evaluated adequately through the emissions target alone.
The appropriate governance mechanism is therefore a conditional adjustment system, in which any permitted flexibility has a defined duration, measurable environmental requirements and an accompanying industrial investment framework. Such a system could allow limited bridging technologies while placing continued emphasis on electric productivity, battery supply-chain development and charging infrastructure. The objective would be to preserve technological options during a period of uncertainty without allowing the adjustment mechanism to become an indefinite substitute for industrial transformation.
Table 7.2 — Conditions determining whether technological flexibility strengthens or weakens European industry
| Industrial condition | Flexibility may strengthen capacity when | Flexibility may weaken capacity when | Observable evidence required |
|---|---|---|---|
| Hybrid profitability | Existing profitable products finance electric development | Revenue is used to postpone new-platform investment | Cash flow, capital expenditure and product allocation |
| Combustion-related employment | Transitional demand supports retraining and supplier conversion | Temporary protection delays restructuring until closures become unavoidable | Supplier orders, training results and future contracts |
| Battery manufacturing | More predictable sequencing prevents destructive underutilisation | Lower electric demand undermines cell-factory investment | Cell orders, output, yields and capacity utilisation |
| Vehicle affordability | Intermediate technologies meet real household constraints | Consumers remain locked into inefficient products through distorted incentives | Transaction prices and total ownership costs |
| Charging deployment | Adoption progresses alongside reliable infrastructure | Flexible rules reduce pressure to complete charging investment | Network deployment, uptime and pricing |
| Emissions outcomes | Verified reductions are maintained across technologies | Compliance relies on nominal credits with weak additionality | Audited emissions and certificate records |
| Public financing | Support closes identifiable productivity gaps | Subsidies preserve structurally uncompetitive activities | Unit costs, private co-investment and commercial orders |
| Strategic autonomy | European engineering and production capabilities remain economically viable | Europe delays electric investment while foreign suppliers advance | Local value added, patents, equipment and sourcing |
Europe cannot preserve every established powertrain capability indefinitely
A central difficulty in the political debate is the tendency to equate technological neutrality with the preservation of all existing manufacturing activities. Such a policy would be economically unsustainable and could conflict with the environmental objective. The transition towards electric propulsion changes the architecture of vehicles and the associated demand for components. Some combustion-specific capabilities will decline in commercial importance, regardless of whether the final regulatory endpoint remains unchanged. Public support should therefore distinguish between preserving technical knowledge that has future applications and maintaining production processes whose market is structurally contracting.
This distinction is especially important for regional manufacturing clusters. A supplier specialising in conventional engine components may require a period of transitional demand to finance its conversion. Yet a policy that guarantees continued demand without requiring technological adaptation can leave the supplier more vulnerable when support eventually ends. The relevant objective is to finance industrial conversion while existing operations still generate revenue, not to postpone every difficult decision until the firm’s balance sheet has weakened.
The same reasoning applies to engineering organisations. Skills in precision manufacturing, thermal systems, industrial automation, materials engineering and electronic controls can remain valuable in new vehicle technologies and other advanced industries. Preserving these capabilities requires targeted training, investment and access to new commercial projects. Maintaining every legacy product is neither necessary nor sufficient to preserve them.
The institutional trade-off: predictability versus adaptability
The European Union must also manage the institutional consequences of changing regulation. Automotive investments have long development cycles and require confidence that future market rules will not change unpredictably. Revisions introduced in response to demonstrated problems can improve policy effectiveness, but repeated politically motivated changes may undermine investor confidence. The risk is not merely that manufacturers choose the wrong powertrain. Battery producers, utilities, component suppliers and financing institutions also make commitments based on expected future demand.
Regulation (EU) 2025/1214 provides an example of a limited adaptation that retained the emissions trajectory while changing how compliance would be measured during 2025–2027. The legislation permits a registration-weighted average over the three-year period, allowing better performance in one year to compensate for weaker performance in another. This is a more narrowly defined instrument than a permanent weakening of the target, because it changes the compliance calendar without eliminating the underlying requirement. The principle is relevant to the next regulatory milestones, although future mechanisms would require separate legislative action. Regulation (EU) 2025/1214 — European Parliament and Council — June 2025. EUR-Lex+1
A durable regulatory settlement should distinguish between the stability of emissions objectives and the adaptability of instruments. Targets must be credible enough to influence investment, while adjustment procedures should be sufficiently transparent to prevent economically unnecessary destruction of productive capacity. The Commission’s proposed 2035 revision provides an opportunity to establish such a framework, but its eventual effectiveness will depend on the adopted legal provisions and their implementation rather than the political announcement itself.
The fiscal dimension: public money must not become a substitute for commercial competitiveness
Technology-specific industrial support raises a further problem: the allocation of public resources among established manufacturers, new entrants, battery companies, infrastructure operators and regional manufacturing systems. A subsidy may correct a market failure, but it can also transfer costs from private shareholders to taxpayers without producing durable productive benefits. The distinction must be central to European economic-security policy.
The Commission’s December 2025 package includes an announced Battery Booster of €1.8 billion, of which €1.5 billion is intended for interest-free loans supporting European battery-cell producers. It also presents an automotive omnibus intended to reduce administrative burdens, with projected manufacturer savings of approximately €706 million annually. The latter figure is a Commission estimate of potential annual administrative savings, not a measured improvement in operating profit or completed budgetary expenditure. Automotive Package — European Commission — December 2025. European Commission
The investment instruments should be evaluated through their capacity to reduce structural costs and generate commercially viable production. An interest-free loan can reduce financing expenditure during the construction and ramp-up of a battery factory, but the project remains exposed to manufacturing yield, materials costs, customer demand and competition. A simplification measure can reduce administrative expenditure, but it does not necessarily alter the engineering cost of an electric vehicle or the price of a battery cell. Public authorities should therefore avoid presenting the nominal amount of support as evidence that the underlying industrial weakness has been resolved.
Industrial support should also preserve competitive neutrality among firms where possible. Programmes designed around a limited number of incumbent manufacturers can disadvantage smaller suppliers or innovative entrants whose technologies may be commercially superior. Conversely, highly fragmented support may fail to create the scale required for competitive battery production. The policy challenge is to combine transparent selection criteria with sufficient concentration of resources to support commercially meaningful projects.
Chapter 7 — Key judgments
Technological neutrality is best understood as a conditional instrument for improving the efficiency and resilience of decarbonisation, not as an independent industrial objective. The European Union should preserve technologically credible options where they contribute to verified emissions outcomes and protect economically relevant capabilities, while avoiding measures that defer essential investment or create permanent dependence on public support. Environmental integrity requires clear distinctions between tailpipe, lifecycle and material-production emissions, together with credible verification of any compensation mechanism.
The institutional priority is to preserve the stability of long-term climate objectives while allowing limited, transparent adjustment of compliance timing and eligible technologies. The effectiveness of this approach depends on whether flexibility supports continued investment in competitive European production rather than merely prolonging the operation of declining manufacturing assets.
What would change the assessment: Evidence that hybrid flexibility materially improves manufacturer investment and employment outcomes without weakening verified emissions reductions would strengthen the case for broader sequencing adjustments. Evidence that flexibility primarily postpones electric investment, reduces battery-factory utilisation or generates questionable environmental credits would weaken it.
Open official record: The decisive unresolved instruments include the final adopted provisions of the proposed CO₂ revision, implementing rules for compensating emissions, independent lifecycle-verification arrangements and published evaluations of the industrial consequences of compliance flexibility.
Chapter 8 — Regulatory Sequencing, Trade Defence, Investment and Skills: European Policy Options
Europe’s industrial response must correct the economics of production rather than simply redistribute the costs of transition
The principal policy judgment is that Europe’s automotive strategy requires a coordinated intervention across five different economic constraints: regulatory compliance, manufacturing competitiveness, international trade conditions, infrastructure availability and the conversion of industrial skills. None of these constraints can be resolved independently without influencing the others. An adjustment to emissions deadlines may relieve pressure on manufacturers while reducing expected demand for new battery production. Higher tariffs on imported vehicles may strengthen the commercial position of European assembly plants while raising consumer prices or encouraging foreign manufacturers to alter their production locations. Subsidies for battery factories may increase nominal production capacity while failing to establish competitive operation if projects lack customers, affordable inputs or sufficient manufacturing yields. Charging investment can improve the economics of electric-vehicle ownership without materially improving European manufacturing competitiveness if the vehicles purchased are predominantly imported. Workforce programmes can preserve valuable expertise but achieve little if they are not linked to funded industrial projects and credible future orders.
The European Commission’s Industrial Action Plan of 5 March 2025 recognised the scale of this challenge. The Commission described automotive manufacturing as an industry accounting for approximately €1 trillion in economic activity and one-third of private research and development investment in the Union, while supporting around 13 million direct and indirect jobs. These figures provide the institutional rationale for treating automotive competitiveness as a cross-sector economic-security issue rather than as an isolated dispute between vehicle manufacturers and environmental regulators. They also demonstrate the potential transmission of automotive restructuring into innovation, regional employment and Europe’s broader manufacturing capabilities. Industrial Action Plan for the European Automotive Sector, COM(2025) 95 — European Commission — March 2025. EUR-Lex+1
The Commission’s subsequent Automotive Package adds a more explicit relationship between emissions flexibility and industrial competitiveness, but the existence of separate initiatives does not guarantee their coordination. A framework capable of protecting European production must define the authority responsible for each intervention, the problem it is intended to solve, the indicators required to demonstrate effectiveness and the circumstances under which support should be modified or withdrawn. The most important institutional reform is therefore to move from a collection of sectoral announcements towards a single, auditable system of industrial-transition governance.
Regulatory sequencing: maintain the environmental destination while managing the investment calendar
The first policy priority is to distinguish a change in the timing of compliance from a permanent weakening of the environmental objective. The three-year averaging mechanism enacted through Regulation (EU) 2025/1214 provides an existing example. It allows manufacturers’ compliance for 2025–2027 to be assessed on a registration-weighted basis over the period, reducing the importance of an isolated annual shortfall while preserving the required average emissions performance. This instrument is particularly relevant when electric model launches, vehicle production and customer adoption develop unevenly across successive years. It does not, however, remove the need for manufacturers to achieve their aggregate targets. Regulation (EU) 2025/1214 — European Parliament and Council — June 2025. EUR-Lex+1
The economic logic behind a broader sequencing mechanism is that compliance costs can become unusually high when a manufacturer’s production investments and the supporting market infrastructure mature at different rates. A company may have committed substantial expenditure to a new electric platform while encountering temporary battery-supply constraints or delayed charging infrastructure in important markets. Under such conditions, limited flexibility can prevent the manufacturer from being forced into substantial discounts or production restrictions whose financial consequences reduce the resources available for further electrification. Yet a sequencing mechanism should not reward persistent failure to introduce competitive electric vehicles. This distinction requires evidence of the manufacturer’s actual investment commitments, technology deployment and progress towards its emissions obligations.
A possible policy architecture would combine a stable long-term emissions trajectory with predefined compliance review periods and narrowly defined adjustment conditions. Rather than permitting discretionary postponement whenever manufacturers report difficult market circumstances, the legislation could specify the indicators relevant to any adjustment, such as verified infrastructure deficiencies, exceptional disruption to essential battery supplies or documented implementation obstacles beyond manufacturers’ reasonable control. Decisions should be taken transparently, apply consistently across comparable manufacturers and preserve the cumulative environmental outcome. Such a mechanism would reduce the risk that temporary flexibility becomes a recurring political negotiation.
The most difficult design question concerns the treatment of transitional powertrains. A limited role for conventional hybrids and plug-in hybrids can provide commercially useful options while electric production expands, but these technologies must remain subject to rigorous emissions accounting. Their continued eligibility should not generate incentives to maximise certified electric capability while minimising actual electric operation. For plug-in hybrids, greater attention to real-world charging behaviour and emissions performance would make regulatory flexibility more defensible. For conventional hybrids, the contribution to reducing emissions should be recognised according to measured performance rather than their inclusion within the broad category of electrified vehicles.
Table 8.1 — Regulatory sequencing options and their institutional consequences
| Policy instrument | Competent authority | Expected industrial effect | Implementation burden | Time to potential effect | Reversibility | Principal downside |
|---|---|---|---|---|---|---|
| Maintain existing 2025–2027 averaging | EU legislature established mechanism; Commission administers compliance | Reduces short-term annual compliance volatility | Relatively limited additional implementation | Already applicable | Temporary mechanism expires under its terms | Does not solve structural product uncompetitiveness |
| Extend defined multi-year compliance flexibility | EU legislature through amendment | Supports product-launch sequencing | Legislative negotiation and compliance-system changes | Medium term | Possible through future amendment | May delay necessary adjustments |
| Retain limited hybrid eligibility beyond current trajectory | EU legislature | Preserves selected production and consumer options | High legal and emissions-accounting complexity | Medium to long term | Difficult once new investments are committed | Reduced battery demand or weaker emissions outcomes |
| Introduce verified lifecycle-based supplementary reporting | EU institutions under appropriate legislation | Improves assessment of production and operational emissions | Significant data and verification requirements | Medium to long term | Framework can be revised | Administrative complexity and inconsistent datasets |
| Preserve the existing 2035 framework unchanged | EU institutions under current law | Maintains strongest current regulatory direction | Existing compliance architecture | Immediate regulatory certainty | Alterable through legislation | Greater pressure if commercial and infrastructure constraints persist |
| Adopt the Commission’s proposed revised framework | European Parliament and Council | Increases specified technology flexibility | Legislative negotiation, implementing rules and verification | Dependent on adoption | Future amendments possible | Potential dilution of investment signals or accounting integrity |
Sources: Regulation (EU) 2025/1214 — European Parliament and Council — June 2025; Proposal COM(2025) 995 — European Commission — December 2025. The assessments of implementation burden and consequences are analytical judgments rather than official cost estimates.
Trade defence must be designed around the legal evidence, not a general preference for domestic manufacturers
The second priority concerns the relationship between fair competition and industrial resilience. The Union already possesses an established trade-defence instrument applicable to Chinese-origin battery-electric vehicles. Commission Implementing Regulation (EU) 2024/2754 imposed definitive countervailing duties following an investigation into subsidisation and the threat of injury to EU producers. The investigation resulted in differentiated rates, including 17.0% for BYD, 18.8% for Geely and 35.3% for SAIC, with separate rates applicable to other cooperating companies and eligible individual exporters. A consolidated version reflecting amendments was available in February 2026. The governing legal framework is therefore more precise than a general assertion that all Chinese vehicles face a uniform European tariff. Commission Implementing Regulation (EU) 2024/2754, Consolidated Version — European Commission — February 2026; EU Imposes Duties on Unfairly Subsidised Electric Vehicles from China — European Commission — October 2024. EUR-Lex+1
The strategic case for these measures rests on the distinction between competitive efficiency and competition distorted by countervailable public support. European policymakers have a legitimate interest in ensuring that domestic manufacturers do not lose market share because competitors benefit from subsidies found to cause legally relevant injury. They do not, however, have an economically defensible basis for assuming that every Chinese cost advantage results from subsidies or that tariffs can compensate indefinitely for differences in productivity, scale and industrial organisation. Chinese battery manufacturers have accumulated substantial manufacturing experience, while their supply chains benefit from concentrated production capabilities. These advantages may persist independently of the specific subsidies identified by the Commission.
An effective trade-defence policy must therefore be accompanied by monitoring of its actual effects. The relevant measures include changes in import prices and volumes, the competitive position of EU-produced vehicles, consumer prices, manufacturer profitability and investment in European production. Additional attention is required to distinguish genuine local industrial investment from changes in production location undertaken primarily to alter the customs treatment of finished vehicles. A foreign manufacturer establishing a substantial European factory can contribute to local employment and value added; an operation with minimal local processing may have a different economic effect. Customs origin, industrial value added and corporate ownership are distinct concepts and should not be treated as interchangeable.
The risks of excessive protection must also be considered. Higher import costs can reduce consumer access to affordable electric vehicles, potentially weakening the environmental objective. Trade restrictions can generate retaliation against European exports or create difficulties for manufacturers operating internationally integrated supply chains. If the Union seeks to protect finished-vehicle production while relying on imported batteries and components, the effect on domestic competitiveness may be limited. The appropriate policy is therefore legally grounded and proportionate trade defence, combined with measures addressing the industrial cost disadvantages that protection cannot eliminate.
A European battery programme must purchase measurable industrial capability, not merely announced capacity
Battery manufacturing is the third and most technologically consequential policy area. The European Union cannot substantially reduce its dependence on external electric-vehicle supply chains simply by encouraging vehicle manufacturers to assemble more cars within its borders. Competitive production requires commercially viable access to cells, cathodes, anodes, separators, battery-management technologies, manufacturing equipment and qualified materials. Because the IEA documents a persistent regional cost disadvantage and a high concentration of battery manufacturing and component production in China, industrial intervention must focus on operational efficiency as well as investment financing. Global EV Outlook 2026: Electric Vehicle Batteries — International Energy Agency — 2026. IEA
The Commission’s Battery Booster provides a potential financing instrument, but its €1.8 billion envelope must be evaluated against the capital intensity and technical complexity of the supply chain. Interest-free loans can reduce the financing burden of establishing production facilities, yet they do not automatically improve production yields, materials quality, automation or customer demand. A battery plant operating below competitive utilisation can continue losing money even with a lower financing cost. Public support should consequently be released against verified technical and commercial milestones rather than construction announcements alone.
An appropriate milestone sequence would begin with financial closing and binding customer agreements, followed by completed equipment installation, validated trial production, stable quality performance, progressive capacity utilisation and sustained commercial shipments. These conditions distinguish an investment project from an operational industrial capability. They also permit public authorities to identify problems early enough to modify financing or technical assistance before a project becomes financially unsustainable.
The European Commission’s Battery Booster initiative describes a broader coordination agenda encompassing financing, innovation, workforce development and supply-chain development. It also identifies an indicative implementation calendar, including the initial programme launch in December 2025 and anticipated financing activity during the fourth quarter of 2026. An indicative programme timetable should not be interpreted as evidence that the corresponding financial disbursements or manufacturing outcomes had occurred by 28 October 2026. Battery Booster — European Commission. European Commission
Table 8.2 — Proposed battery investment conditionality
| Investment stage | Required evidence | Public-policy purpose | Principal failure risk |
|---|---|---|---|
| Project selection | Technical feasibility, business plan, qualified management and credible demand | Avoid financing unsupported capacity announcements | Selection of commercially nonviable projects |
| Financial closing | Binding capital commitments and identified funding sources | Confirm project bankability | Excessive reliance on future subsidies |
| Equipment installation | Verified completion and commissioning milestones | Establish physical production capability | Cost escalation or equipment incompatibility |
| Trial production | Saleable cells meeting documented customer specifications | Demonstrate technical viability | Excessive scrap and inconsistent quality |
| Industrial ramp-up | Improving production yield, throughput and utilisation | Reduce unit manufacturing costs | Persistent cost disadvantage |
| Commercial qualification | Customer validation and binding supply arrangements | Connect output to actual vehicle demand | Idle production capacity |
| Operating maturity | Competitive unit costs, reliable delivery and sustainable finances | Establish durable manufacturing capacity | Continued dependence on operating subsidies |
| Supply-chain diversification | Qualified alternative sources for critical materials | Reduce concentration and interruption risks | Replacement of one external dependency with another |
| Workforce development | Documented qualifications and retained technical employment | Accumulate European manufacturing expertise | Training without corresponding industrial demand |
The table sets out recommended financing conditions; it does not claim that these requirements are already mandatory under the Battery Booster.
The missing intermediate industries: why cell manufacturing alone is insufficient
The development of European cell factories is necessary but insufficient when the materials and equipment required to operate those factories remain highly concentrated outside the Union. European battery producers may become more dependent on imported materials as domestic cell production increases, unless upstream and midstream investments advance in parallel. This creates a sequencing problem: a cathode or anode materials plant requires a reliable customer base, while a cell factory requires reliable access to qualified materials. If each project waits for the other to become commercially established, investment can be delayed throughout the chain.
A coordinated European programme should therefore evaluate clusters of related investments rather than isolated factories. Cell producers, materials processors, component suppliers, manufacturers of production equipment and recycling operators should be connected through credible commercial arrangements. Public authorities can support coordination, but the underlying contracts must remain economically meaningful. A materials plant without customers is not strategic autonomy; it is unused capacity. A cell factory dependent on a single non-European supplier for indispensable inputs is an improvement in local manufacturing presence but not necessarily a substantial reduction in supply-chain vulnerability.
Regulation (EU) 2023/1542 on batteries and waste batteries provides an additional governance instrument. Its framework addresses sustainability, information, due diligence, performance and lifecycle management, including requirements associated with battery information and the battery passport. The Commission identifies 18 February 2027 as the intended date on which battery passports become mandatory for the relevant battery categories, subject to the applicable legal and implementation requirements. The passport can improve transparency regarding composition, performance, sourcing and lifecycle characteristics, but information disclosure should not be mistaken for the existence of alternative suppliers. Regulation (EU) 2023/1542 — European Parliament and Council — July 2023; Digital Product Passport for Batteries — European Commission — October 2026. European Commission
The strategic opportunity lies in using traceability requirements to improve industrial knowledge. Better information about material composition, manufacturing origins, battery performance and recycling possibilities can support procurement decisions and identify concentrations of risk. However, excessive reporting complexity could impose disproportionate costs on smaller suppliers without creating new manufacturing capabilities. The implementation priority should therefore be interoperable data systems that support real industrial decisions rather than administrative documentation disconnected from production and investment.
Charging infrastructure is an industrial instrument because it changes the economics of the vehicle itself
The fourth policy priority concerns the relationship between charging infrastructure, consumer costs and domestic production. Regulation (EU) 2023/1804 establishes mandatory infrastructure objectives, including fleet-based requirements for publicly accessible charging capacity. For each registered battery-electric light-duty vehicle, the national public charging network must provide at least 1.3 kW of total power output under the applicable formula, while the corresponding requirement for plug-in hybrids is at least 0.8 kW. These are aggregate national power-capacity requirements, not guarantees that individual vehicles can always access a charger of the specified output. Alternative Fuels Infrastructure — European Commission. Mobility and Transport
The industrial effect of charging investment is frequently underestimated. Improved access to reliable charging can reduce the perceived need for oversized vehicle batteries, lowering the energy-storage capacity required to provide acceptable everyday mobility. This can help reduce vehicle manufacturing costs and material demand, particularly in price-sensitive market segments. A charging system that permits consumers to purchase smaller and more affordable BEVs therefore acts indirectly on automotive industrial competitiveness, even though charging infrastructure is not part of the vehicle itself.
The geographical distribution of charging matters as much as aggregate capacity. A national network may satisfy a headline deployment objective while providing inadequate service to households without private parking, rural communities or particular transport corridors. Charging reliability, payment interoperability, electricity prices and connection delays can materially influence customer willingness to purchase electric vehicles. A programme focused exclusively on installed charge-point numbers risks overestimating practical service availability.
The appropriate intervention combines investment in public charging, electricity-grid reinforcement, transparent prices, reliable equipment maintenance and access for households unable to install private chargers. National governments and regulators must coordinate electricity infrastructure with local planning authorities, utilities and charging operators. The investment burden should be assessed against expected utilisation and genuine consumer need rather than allocated through uniform numerical targets alone.
Corporate fleets and the development of the second-hand electric market
The Commission’s December 2025 Automotive Package also proposed measures to increase zero- and low-emission vehicle uptake in corporate fleets. This approach addresses a different obstacle from direct household purchase subsidies. Company vehicles often cover relatively high annual mileage and enter the used-car market after a period of commercial operation. Increasing the supply of electric vehicles through fleets can therefore influence both near-term emissions and the longer-term availability of used BEVs. Automotive Package — European Commission — December 2025. European Commission
The policy rationale is attractive because the initial purchase decision and the later consumer market are connected. Fleet procurement can provide predictable demand for manufacturers, improve utilisation and create a larger stock of second-hand electric vehicles. However, its effectiveness depends on residual values, financing conditions, charging availability and the willingness of subsequent buyers to purchase used BEVs. If accelerated fleet electrification produces an oversupply of used vehicles relative to demand, residual values can weaken and raise leasing costs. A government programme that measures success exclusively through initial fleet registrations may therefore overlook downstream financial risks.
Corporate-fleet instruments should also avoid becoming indirect subsidies for imported manufacturing without considering the broader industrial objective. Restricting public or private demand according to origin may raise legal and competition issues, but industrial support programmes can legitimately evaluate eligible investment and manufacturing outcomes where the governing legal framework permits. The key distinction is between a policy designed to reduce fleet emissions and one designed to support domestic industrial production. Each should employ criteria appropriate to its purpose.
Skills policy must be linked to specific production programmes
The fifth priority is the conversion of engineering and manufacturing capabilities. Training programmes frequently appear less politically visible than subsidies for factories, but their importance increases when the transition alters the technical composition of industrial work. Existing automotive workers possess capabilities that may remain useful in electric vehicles, batteries, industrial automation and related manufacturing. However, conversion requires more than short courses: employers must possess production programmes capable of absorbing trained workers, while workers may require substantial practical experience with new equipment, safety procedures and quality systems.
Skills investment should therefore be designed around regional industrial demand. A programme supporting battery-manufacturing training is economically valuable where operational or credibly financed battery facilities require those workers. It is less effective where the region has no realistic prospect of creating corresponding employment. Likewise, training combustion-engine specialists in software development without assessing their previous competencies, available positions and necessary qualification pathways may produce weak outcomes.
The Commission’s Industrial Action Plan recognises skills and social transition as material components of automotive competitiveness. This provides a European policy framework, but implementation must involve national education systems, employers, technical institutions and regional authorities. Industrial Action Plan for the European Automotive Sector, COM(2025) 95 — European Commission — March 2025. EUR-Lex
An industrially meaningful programme would measure employment outcomes rather than training participation alone. Relevant indicators include the number of workers obtaining recognised qualifications, subsequent employment in technologically relevant activities, retention after an appropriate observation period and employer investment in productive equipment. Public authorities should also distinguish retraining from the preservation of existing advanced competencies. Some regional capabilities may be difficult to recreate if specialised engineers and technical personnel leave the sector before replacement projects are established.
Governance and the risk of fragmented European intervention
The European Union’s industrial response is constrained by the distribution of competences between Union institutions, member states and private manufacturers. EU legislation governs central elements of vehicle emissions regulation and trade defence, while national governments influence taxation, education, labour-market policy, infrastructure planning and investment support. Local authorities and energy-network operators influence the practical availability of charging infrastructure. Private manufacturers ultimately determine many product-development and plant-allocation decisions.
This distribution creates the possibility of fragmented intervention. One member state may provide substantial incentives for battery manufacturing while another prioritises vehicle assembly or consumer subsidies. Projects may compete for the same suppliers, labour and customers without creating sufficient overall industrial scale. The Union can end up financing several national projects that are individually politically attractive but collectively commercially fragile.
A coordinated approach should identify where European-scale capacity is necessary, where regional specialisation creates genuine advantages and where duplication would undermine competitiveness. Not every member state requires a complete battery supply chain. European sovereignty can be strengthened through diversified production located across several member states, provided that essential capabilities are accessible, competitive and resilient to disruption. The relevant governance objective is therefore integrated European industrial capacity, not complete replication of every manufacturing stage within every national economy.
Table 8.3 — Recommended European automotive industrial-policy portfolio
| Policy priority | Responsible institutions | Required action | Principal measurable outcome | Main implementation risk |
|---|---|---|---|---|
| Regulatory predictability | European Parliament, Council, Commission | Establish clear compliance provisions and review mechanisms | Stable investment decisions and verified emissions performance | Repeated political revisions |
| Battery competitiveness | Commission, member states, industrial financiers | Support projects against operational milestones | Saleable output, yields, unit costs and qualified customers | Financing nominal capacity without competitive production |
| Midstream supply chains | EU and national industrial authorities | Coordinate materials processing, components and industrial equipment | Diversified qualified suppliers | Projects without sufficient commercial demand |
| Trade defence | European Commission | Enforce applicable countervailing measures and conduct legally justified reviews | Correction of established subsidisation effects | Retaliation, circumvention or higher consumer costs |
| Charging deployment | Member states, regulators, utilities and operators | Deliver reliable public and residential access | Available capacity, uptime, charging prices and utilisation | Uneven infrastructure and network delays |
| Corporate fleet transition | EU legislature and member states under adopted rules | Improve clean-vehicle uptake while monitoring residual values | Sustainable fleet electrification and second-hand supply | Depreciation and financing distortions |
| Workforce conversion | National and regional authorities, employers | Fund employer-linked qualifications and mobility support | Verified employment and skill retention | Training disconnected from investment |
| Industrial monitoring | Commission, Eurostat, national statistical authorities | Publish harmonised production and value-added indicators | Reliable assessment of domestic industrial capability | Incompatible statistics or incomplete disclosure |
National implementation: common European objectives, different industrial instruments
Germany’s priority should be to protect the technological capabilities of its large manufacturing system while improving the cost competitiveness of future production. The greatest policy value lies in supporting supplier conversion, advanced manufacturing processes, battery integration and internationally competitive vehicle platforms. Public intervention should be designed to preserve productive engineering capabilities rather than guarantee existing production volumes irrespective of market demand. Because German manufacturers rely substantially on external markets, national policy cannot eliminate exposure to foreign tariffs or international competition. German industrial adjustment must therefore be linked to European trade strategy and the ability to export competitive vehicles.
France’s priority is to ensure that announced battery and electric-vehicle investments become commercially operational facilities with sustainable output and strong local supplier integration. Public support should emphasise production qualification, manufacturing yields, reliable customer commitments and the development of regional industrial ecosystems. France also has an interest in ensuring that European regulatory flexibility does not unexpectedly undermine investments made in reliance on future electric demand. Its policy approach consequently requires a careful balance between supporting the transformation of established manufacturers and protecting the commercial prospects of new industrial capacity.
Italy’s most effective intervention would concentrate on the financing and technological conversion of specialised suppliers. Automotive industrial policy should support engineering firms capable of supplying precision machinery, advanced components, power electronics, automation and other technologies relevant to future vehicle platforms. The objective should be to prevent viable firms from losing access to capital during the period when established product demand is declining but replacement markets have not yet reached commercial scale. Italy also requires stronger mechanisms connecting its suppliers with European manufacturing investment projects, reducing dependence on the product-allocation decisions of a limited number of final vehicle manufacturers.
The United Kingdom must manage the same technological transformation through a distinct institutional framework. Its priorities include access to EU markets, competitive energy costs, investment in battery and vehicle manufacturing, and trade arrangements that maintain the viability of internationally integrated production. Regulatory divergence can create opportunities for national adaptation but also impose additional costs on manufacturers exporting to the Union. British industrial policy should therefore focus on the practical economics of cross-border production and market access rather than assuming that regulatory independence automatically improves competitiveness.
Chapter 8 — Key judgments
The most effective European response is an integrated policy portfolio rather than a single change to the 2035 regulatory calendar. Sequencing flexibility can reduce unnecessary financial disruption, but its value depends on preserving credible emissions outcomes and continued investment. Trade-defence measures can address legally established subsidisation but cannot replace manufacturing productivity. Battery support must be conditional on operational competitiveness, while charging investment and workforce conversion must respond to concrete market and industrial requirements.
The central institutional requirement is measurable conditionality: public intervention should be evaluated by its contribution to commercially viable European production, qualified employment, reduced supply-chain concentration and verified environmental outcomes.
What would change the assessment: Evidence that existing measures are producing competitive battery plants, stronger manufacturer margins, reliable charging and sustained investment would reduce the need for additional intervention. Continued public expenditure without improvement in manufacturing costs, plant utilisation or supply-chain resilience would require a fundamental reassessment of programme design.
Open official record: The decisive records include enacted regulatory revisions, project-level Battery Booster disbursements, verified battery manufacturing output, charging infrastructure performance and harmonised regional employment outcomes.
Chapter 9 — The 2027–2031 Outlook, Strategic Indicators and Final Net Assessment
The next five years will determine whether Europe’s electric-vehicle transition becomes an industrial renewal or a redistribution of manufacturing power
The central strategic judgment is that the period from 2027 to 2031 will be decisive not because Europe’s entire automotive transition will be completed within those five years, but because the investment, production and supply-chain decisions taken during this interval will determine which industrial capabilities remain available when the more demanding 2035 regulatory requirements approach. The principal risk is that Europe increases the proportion of electric vehicles purchased by its consumers while the factories, battery producers, component suppliers and engineering organisations required to manufacture those vehicles lose competitiveness or relocate production. A secondary, equally consequential risk is that governments attempt to prevent this outcome through excessive regulatory postponement and unconditional support for established technologies, thereby weakening investment in the manufacturing capabilities that Europe will require in the longer term.
The 2026 evidence establishes the conditions from which the outlook must begin. ACEA’s first-half industry report records a substantial contraction in the EU’s passenger-car trade surplus, declining domestic manufacturing-origin penetration and increased imports from China. The IEA documents a persistent European disadvantage in battery manufacturing costs and an exceptionally high concentration of critical production capabilities in China. The Commission’s policy initiatives demonstrate institutional recognition of these pressures, but many of their intended industrial effects remain prospective. The relevant forecast is therefore not a mechanical extension of current vehicle-registration growth. It concerns the interaction of future manufacturing productivity, international market competition, public investment, technological development and regulatory choices. Economic and Market Report: Global and EU Auto Industry — ACEA — October 2026; Global EV Outlook 2026: Electric Vehicle Batteries — International Energy Agency — 2026. European Automobile Manufacturers’ Association+1
The analytical challenge is to distinguish the continuation of present risks from their inevitable realisation. Europe’s automotive industry still possesses substantial manufacturing capacity, engineering expertise, established commercial relationships and internationally recognised products. A decline in trade performance during one semester is not sufficient evidence of irreversible industrial collapse. At the same time, waiting for definitive evidence of permanent industrial damage may leave policymakers with limited options, because supplier insolvencies, engineering relocation and the dismantling of specialised production facilities can become difficult to reverse. The appropriate strategy must therefore act on observable leading indicators rather than waiting exclusively for factory closures and unemployment statistics.
Three pathways to 2031: conditional industrial renewal, competitive displacement and delayed transformation
Three broad pathways provide a useful framework for evaluating Europe’s prospective industrial position. They are not predictions with assigned probabilities, because the public evidence does not provide a defensible numerical base rate for the precise combination of regulatory decisions, global competition, technological advances and manufacturing investment under consideration. The pathways are also not completely exclusive: different countries, manufacturers and component industries could experience elements of more than one outcome simultaneously.
The first pathway is conditional industrial renewal. Under this outcome, the European Union maintains a credible emissions trajectory while introducing sufficient regulatory flexibility to manage temporary commercial constraints. European manufacturers improve productivity, expand competitive electric offerings and secure stronger relationships with battery and component producers. Public support helps viable industrial projects reach commercial production rather than merely financing announced capacity. Charging access improves, enabling electric vehicles to compete across a broader range of households and fleet uses. The result is not the elimination of Chinese competition but the preservation of a substantial European manufacturing and engineering position within an increasingly electrified market.
The second pathway is accelerated competitive displacement. Under this outcome, battery-electric demand continues expanding, but European producers struggle to match international costs and product competitiveness. Chinese and other non-European manufacturers capture an increasing proportion of European vehicle sales, while European brands source more vehicles and critical components from outside the Union. Domestic factories face weaker utilisation and suppliers lose contracts as established production programmes are replaced or relocated. Regulatory compliance may improve, and vehicle emissions may decline, while Europe’s industrial position deteriorates. This is the scenario in which the environmental transition advances without a comparable renewal of domestic manufacturing.
The third pathway is delayed industrial transformation. Under this outcome, governments provide extensive flexibility for established combustion and hybrid technologies without ensuring adequate reinvestment in future manufacturing capabilities. Some manufacturers obtain temporary financial relief, but the expansion of domestic battery production, advanced electronics and competitive electric platforms proceeds more slowly. As international competitors continue investing, Europe becomes increasingly dependent on imported technologies. When the transition eventually accelerates, firms confront the same structural disadvantages under more difficult financial and technological conditions. This pathway differs from immediate competitive displacement because industrial deterioration may initially be concealed by the continued profitability of established vehicle programmes.
Table 9.1 — Competing industrial pathways, 2027–2031
| Strategic pathway | Regulatory conditions | Manufacturing conditions | Employment implications | Principal vulnerability | Evidence that would strengthen the pathway |
|---|---|---|---|---|---|
| Conditional industrial renewal | Stable targets with accountable flexibility | Competitive electric production, successful battery investments and supplier conversion | Managed occupational transition and preservation of high-value skills | Implementation failure or insufficient scale | Improved EU-origin market participation and sustained manufacturing investment |
| Accelerated competitive displacement | Demanding targets coexist with weak industrial competitiveness | Rising dependence on imported vehicles, cells and components | Greater exposure to permanent closures and supplier restructuring | Loss of domestic capabilities despite emissions progress | Sustained growth in import penetration and declining factory utilisation |
| Delayed industrial transformation | Extensive flexibility without binding investment incentives | Continued reliance on mature technologies and delayed electric investment | Temporary protection followed by more difficult restructuring | Stranded assets and widening technological dependence | Falling investment in new platforms and critical supply chains |
These pathways are analytical constructions. They do not constitute official Commission or IEA forecasts and should not be interpreted as mutually exclusive national outcomes.
Bounded quantitative scenarios: what the production-origin figures imply under transparent assumptions
The absence of a reliable plant-level closure model does not prevent the development of bounded scenarios for manufacturing-origin shares, provided the calculations are explicitly identified as conditional arithmetic rather than predictions. The most defensible starting point is the ACEA figure indicating that 68% of vehicles sold in the EU during the first half of 2026 were manufactured within the Union. This establishes an observable baseline for domestic market participation, although it does not measure the value added contained in those vehicles.
A useful sensitivity analysis can examine what would happen if the EU-origin share changed by between two and eight percentage points over the five-year horizon. A relatively favourable case could place the 2031 share between 68% and 72%, reflecting stabilisation or modest recovery. An intermediate case could place it between 63% and 68%, reflecting limited further displacement. A more adverse case could place it between 60% and 63%, representing a substantial decline in domestic manufacturing participation.
These ranges are deliberately constructed stress assumptions, not probability-weighted forecasts or estimates derived from an econometric model. The available evidence does not establish the likelihood of each range. Their purpose is to demonstrate the industrial scale of potential changes and identify the information required to evaluate whether the relevant outcome is becoming more plausible.
The distinction between a percentage-point change and a relative percentage change is essential. A decline from 68% to 60% represents an eight-percentage-point reduction, equivalent to approximately 11.8% of the original share. It does not imply that European vehicle production would necessarily decline by the same percentage, because total EU registrations, exports and inventory movements could change. Likewise, an increase to 72% would not automatically represent an increase in European value added if manufacturers sourced a greater proportion of components externally.
Table 9.2 — Illustrative EU manufacturing-origin scenarios for 2031
| Scenario | H1 2026 baseline | Assumed 2031 EU-origin share | Change from baseline | Underlying assumption | What the range does not establish |
|---|---|---|---|---|---|
| Industrial stabilisation and recovery | 68% | 68–72% | 0 to +4 percentage points | EU manufacturing retains or improves competitiveness | Future export volumes or employment |
| Limited competitive displacement | 68% | 63–68% | −5 to 0 percentage points | Imports expand moderately relative to domestic production | Exact factory closures |
| Accelerated manufacturing displacement | 68% | 60–63% | −8 to −5 percentage points | Persistent foreign cost advantages and weaker EU investment | Probability or inevitability of the outcome |
Baseline source: Economic and Market Report: Global and EU Auto Industry — ACEA — October 2026. The 2031 ranges are explicit analytical assumptions, not published ACEA projections.
The ranges become more meaningful when expressed as conditional production volumes. If EU annual new-car registrations in 2031 were hypothetically 11 million, each percentage point of manufacturing-origin share would correspond to approximately 110,000 vehicles sold in the EU. An eight-percentage-point reduction would therefore represent approximately 880,000 EU-market vehicle sales shifting away from EU manufacturing relative to a constant 68% baseline. If registrations were instead 13 million, the corresponding figure would be approximately 1.04 million vehicles. These calculations do not imply that the same number of European-produced vehicles would disappear from global output, because manufacturers could compensate through exports or other market changes.
Table 9.3 — Conditional vehicle-volume exposure under alternative EU market sizes
| Assumed EU annual registrations in 2031 | One percentage point of market share | Loss of 3 percentage points | Loss of 5 percentage points | Loss of 8 percentage points |
|---|---|---|---|---|
| 11 million vehicles | 110,000 | 330,000 | 550,000 | 880,000 |
| 12 million vehicles | 120,000 | 360,000 | 600,000 | 960,000 |
| 13 million vehicles | 130,000 | 390,000 | 650,000 | 1,040,000 |
The calculations assume annual registrations of 11–13 million vehicles solely for sensitivity analysis, not as an independently verified forecast. Figures represent EU-market sales attributed to manufacturing origin relative to an unchanged baseline, not net production losses, factory closures or job losses.
These calculations illuminate why apparently modest changes in manufacturing-origin shares can become economically important when applied to a large vehicle market. However, the industrial consequences depend on vehicle value, domestic component content, manufacturer profitability and the capacity of European factories to serve foreign markets. An imported high-value electric vehicle and an imported low-cost combustion vehicle can have very different effects on trade values and domestic production. Consequently, changes in the manufacturing-origin share should be monitored alongside monetary value added and the geographical distribution of critical components.
The risk of stranded assets operates in both directions
The concept of stranded industrial assets is often applied to combustion-engine manufacturing facilities that may lose economic viability as electric propulsion expands. That risk is real but incomplete. Electric-vehicle and battery investments can also become stranded if regulatory uncertainty, weak demand or manufacturing cost disadvantages prevent new facilities from reaching commercially viable utilisation.
The direction of the risk depends on the investment decision. A company that commits substantial capital to a new combustion platform shortly before demand contracts may be unable to recover the expenditure over its expected production life. A battery manufacturer that constructs a factory on the assumption of rapidly growing European electric demand may face a similar problem if sales remain weak or customers purchase lower-priced cells from established foreign suppliers. In both cases, the underlying issue is the divergence between expected and realised demand, combined with investments that are difficult to redeploy.
The IEA’s observations on battery manufacturing provide an important reason for caution. Competitive cell production requires substantial technical expertise, effective automation and high manufacturing yields. New plants can require several years to approach intended output, while regional cost differences remain substantial. Consequently, the commercial viability of European battery investments depends on operational maturity as well as regulatory support. Global EV Outlook 2026: Electric Vehicle Batteries — International Energy Agency — 2026. IEA
Table 9.4 — Competing stranded-asset risks
| Asset category | Principal risk under rapid electrification | Principal risk under delayed electrification | Relevant monitoring evidence |
|---|---|---|---|
| Combustion-engine plants | Demand contracts before capital recovery | Additional investment becomes exposed to later market contraction | Product orders, depreciation and closure decisions |
| Transmission and fuel-system suppliers | Customer programmes end before conversion | Short-term orders discourage investment in alternative products | Supplier financial results and product diversification |
| Hybrid production platforms | Regulatory restrictions shorten expected life | Excessive platform investment delays future technology | Platform development expenditure and future allocations |
| Battery-cell factories | Weak utilisation and persistent cost disadvantage | Electric-demand growth below investment assumptions | Actual output, yield, orders and unit costs |
| Electric vehicle assembly facilities | Insufficient profitable demand | Delayed launches and lower capacity utilisation | Model allocation, plant output and margins |
| Charging infrastructure | Low utilisation in some locations | Inadequate network development reduces BEV adoption | Utilisation, reliability and investment commitments |
| Engineering organisations | Loss of specialised personnel during restructuring | Delayed development of future technologies | R&D expenditure, employment and technological output |
Trade-surplus sensitivity: a transparent range rather than a fabricated forecast
A further bounded exercise can illustrate the effect of changes in Europe’s passenger-car trade balance without pretending to predict the outcome. ACEA’s reported surplus of approximately €28.7 billion in the first half of 2026 provides a reference period. A simple continuation assumption that the same nominal balance occurred in the second half would produce an annualised value of approximately €57.4 billion. Such annualisation is not a forecast because passenger-car trade is influenced by seasonal patterns, product launches, international demand and exchange rates.
For scenario purposes, the annualised reference can be subjected to hypothetical changes of −10%, −25% and −40%. These would yield approximately €51.7 billion, €43.1 billion and €34.4 billion respectively. The values demonstrate the sensitivity of the annualised balance to further deterioration, but they do not establish that any particular outcome will occur in 2031. A genuine forecast would require separate modelling of export prices, export volumes, import prices, import volumes and the geographical composition of trade.
Table 9.5 — Illustrative passenger-car trade-balance sensitivities
| Conditional assumption | Annualised reference | Resulting hypothetical balance | Interpretation |
|---|---|---|---|
| No change from annualised H1 2026 | €57.4bn | €57.4bn | Constant-rate arithmetic reference |
| Further 10% contraction | €57.4bn | €51.7bn | Moderate additional deterioration |
| Further 25% contraction | €57.4bn | €43.1bn | Substantial additional deterioration |
| Further 40% contraction | €57.4bn | €34.4bn | Severe additional deterioration |
Source baseline: Economic and Market Report: Global and EU Auto Industry — ACEA — October 2026. Values are calculated sensitivities, not reported forecasts. Coverage is finished passenger-car trade and excludes the full automotive component and service balance.
The analytical value of the exercise is limited unless the source of deterioration is identified. A declining surplus caused by temporary weakness in external demand requires a different policy response from one caused by lasting loss of manufacturing competitiveness. Similarly, higher imports of critical components incorporated into competitively exported European cars have a different industrial meaning from rising imports of finished vehicles that displace domestic assembly. The Commission and member states should therefore monitor the composition of trade rather than relying on the headline surplus alone.
The 2031 industrial outlook depends on battery costs, not simply battery capacity
Europe’s battery strategy illustrates the difference between an industrial investment pipeline and a commercially sustainable manufacturing system. The IEA reports that Chinese battery-pack prices remained approximately 35% below European levels in 2025. It also documents manufacturing-cost disadvantages and the importance of achieving high production yields. These conditions imply that additional European nameplate capacity will improve strategic autonomy only if the resulting factories operate at competitive costs and secure reliable demand.
A credible outlook should therefore distinguish between several stages of battery industrial development. Announced projects represent investment intentions. Projects under construction indicate committed capital but not completed production. Commissioned factories demonstrate operational capability, while commercial maturity requires sustained output meeting customer specifications at economically viable costs. The transition from one stage to another can be prolonged and financially demanding.
The industrial-policy risk is that governments measure success through announced gigawatt-hours and fail to detect weak utilisation or production economics. Under such circumstances, Europe could possess substantial nominal battery capacity while remaining dependent on imports for competitively priced cells. Conversely, a smaller network of technically mature plants with strong local component sourcing could contribute more to industrial resilience than a larger collection of financially fragile facilities.
The 2031 outlook should consequently place greater emphasis on output, yields, cost competitiveness and supplier diversification than on construction announcements. European battery manufacturers must also develop capabilities that remain relevant as battery chemistry evolves. Investment concentrated exclusively in one technological configuration may become vulnerable if alternative chemistries achieve significant commercial advantages. However, speculative technologies should not be treated as substitutes for building competitive production using established technologies already demanded by manufacturers.
Strategic watch indicators: distinguishing normal competition from irreversible industrial weakening
The most useful monitoring framework is one that identifies changes before they become permanent industrial outcomes. A temporary fall in production can be reversed if the factory remains operational and investment continues. A cancelled future vehicle programme, withdrawal of engineering expenditure or bankruptcy of a critical supplier can be more consequential because it reduces the future options available to the industrial system.
The Commission should therefore supplement aggregate registrations and trade statistics with indicators of manufacturing investment and capacity retention. These could include the number of plants receiving future model allocations, changes in production capacity, manufacturer capital expenditure, supplier insolvencies, battery-cell output and the geographical distribution of engineering activity. National governments should contribute consistent data, while commercially confidential information should be aggregated appropriately to preserve legitimate business interests.
Table 9.6 — Strategic indicators and proposed decision thresholds
| Indicator | 2026 reference or status | Proposed warning condition | Required evidence | Policy consequence |
|---|---|---|---|---|
| EU-origin share of EU sales | 68% in H1 2026 | Decline of at least 3 percentage points sustained across comparable reporting periods | ACEA production-origin data | Examine manufacturing displacement and investment allocation |
| China-origin share of EU sales | 9% in H1 2026 | Continued increase accompanied by declining EU production | Origin-specific registrations and trade data | Evaluate competitiveness and trade-defence effectiveness |
| Passenger-car trade surplus | Approximately €28.7bn in H1 2026 | Repeated year-on-year contraction beyond temporary market effects | Eurostat trade values and volumes | Analyse export-market deterioration and import substitution |
| European battery manufacturing yields | No harmonised public baseline established here | Persistent inability to approach commercially competitive yields | Audited project-level production data | Review financing and technical support |
| Battery manufacturing costs | IEA identifies material European disadvantage | Cost gap fails to narrow despite operating maturity | Comparable cell and pack cost studies | Reassess project design and industrial support |
| Vehicle assembly utilisation | Requires plant-level baseline | Sustained underutilisation with cancelled future model allocations | Company and national manufacturing records | Target regional industrial conversion |
| Supplier financial health | Requires harmonised sectoral data | Concentrated insolvencies or permanent loss of specialised production | Insolvency registers and supplier accounts | Activate targeted restructuring and retraining measures |
| Charging reliability | Requires comparable national operating data | Persistent failures despite nominal capacity compliance | National regulators and charging operators | Redirect investment towards service quality |
| Engineering capability | Requires occupational and R&D baselines | Persistent decline in specialised employment and investment | National statistics and company disclosures | Protect research and conversion capability |
| Public battery financing | Announced EU support framework | Disbursement without operational milestones | Commission financing records | Strengthen conditionality or revise programmes |
The numerical thresholds in this table are proposed analytical warning conditions, not existing statutory triggers. In particular, a three-percentage-point decline in EU manufacturing-origin share would warrant investigation but would not independently prove that a particular regulation caused industrial displacement.
Decision architecture: what European institutions should prioritise before 2030
The Union’s most important opportunity is to establish a governance system in which industrial capacity is treated as an explicit condition of a successful environmental transition. The environmental objective should remain independently measurable, but industrial performance should be monitored with comparable seriousness. This does not imply weakening emissions standards whenever an individual manufacturer experiences losses. It means that regulatory adjustments, industrial financing and trade measures should be designed through a common assessment of the economic consequences for European production.
The European Commission is the natural coordinating institution because it possesses relevant responsibilities across emissions regulation, trade policy, competition, the internal market and industrial initiatives. Yet implementation depends heavily on member states, which influence energy prices, infrastructure, education, taxation and investment conditions. A credible European approach must therefore combine Union-level consistency with national specialisation.
One proposed institutional mechanism would be an annual European automotive industrial-capacity assessment accompanying the existing environmental and market monitoring frameworks. It should distinguish current operating capacity from announced investment and future project intentions, while separately reporting manufacturing origin, critical component sourcing, export competitiveness, employment and technical skills. Its value would lie in detecting contradictions between policy objectives early enough to permit correction.
A further requirement is to link public support to observable industrial outputs. A manufacturer or battery producer receiving substantial assistance should be evaluated against the specific capabilities the programme was intended to create. This could include qualified manufacturing output, committed investment, research activities, workforce development or reductions in strategic sourcing concentration. Conditions would need to comply with the applicable legal frameworks and avoid creating disproportionate administrative burdens.
The governance objective should not be the elimination of international trade. Europe benefits from specialised production and access to global markets, and many of its most successful manufacturers operate internationally. Strategic autonomy is better understood as the capacity to sustain essential industrial functions, diversify dependencies and adapt to external shocks without unacceptable economic disruption. That objective is compatible with foreign investment, international technology partnerships and competitive imports, provided that Europe retains meaningful productive capabilities.
Table 9.7 — Proposed 2027–2031 implementation sequence
| Period | Strategic priority | Proposed institutional action | Evidence required for continuation | Principal decision risk |
|---|---|---|---|---|
| 2027 | Regulatory and investment clarity | Resolve material legal uncertainty and evaluate existing compliance flexibility | Adopted rules, emissions performance and manufacturer investment | Extended uncertainty or premature commitments |
| 2027–2028 | Battery manufacturing execution | Prioritise operational project milestones and qualified material supply | Completed facilities, production yields and commercial orders | Projects fail to reach viable manufacturing output |
| 2028–2029 | Supplier and workforce conversion | Direct support towards firms with commercially credible new products | Supplier contracts, skills qualifications and retained production | Loss of specialised regional capabilities |
| 2028–2030 | Charging and affordability | Strengthen reliable infrastructure and access to competitive electric vehicles | Charger uptime, prices, transaction costs and registrations | Consumer demand remains dependent on temporary incentives |
| 2029–2030 | Intermediate regulatory review | Assess environmental and industrial performance against adopted requirements | Verified compliance, industrial investment and market uptake | Politicised adjustment unsupported by evidence |
| 2030–2031 | Industrial-capacity consolidation | Evaluate domestic manufacturing origin, battery competitiveness and export performance | Harmonised production, trade, employment and cost data | Europe meets market targets while losing value added |
These dates represent a recommended implementation sequence rather than a claim that the specified decisions have already been scheduled or legally mandated.
The counterfactual question: would a more flexible regulatory calendar preserve European factories?
An appropriate final assessment must address the counterfactual underlying the policy debate. Would European automotive manufacturing perform better if the Union adopted a more flexible emissions calendar? The evidence supports a conditional answer rather than a universal conclusion.
A more flexible calendar could preserve manufacturing capacity where regulation materially accelerates the withdrawal of products that remain commercially profitable and environmentally compatible with a credible transition path. It could allow manufacturers to recover existing investment, support suppliers during conversion and prevent unnecessary financial disruption. These benefits would be strongest where electric alternatives are temporarily constrained by infrastructure, product affordability or manufacturing ramp-up difficulties rather than by permanent technological disadvantages.
However, flexibility would provide less benefit where manufacturing losses result primarily from international competition, expensive battery inputs, weak exports or corporate execution problems. If a European manufacturer cannot produce electric vehicles at costs comparable with foreign competitors, delaying regulatory obligations does not directly solve that disadvantage. It may preserve cash flow temporarily, but the longer-term industrial position could deteriorate if the additional time is not used to improve competitiveness.
The converse counterfactual is equally important. Would maintaining the original regulatory timetable strengthen European manufacturing by accelerating investment and scale? It could, if clear demand expectations encourage commercially successful battery projects and electric platforms. Yet it could also intensify financial pressure if European manufacturers are required to expand electric sales through costly incentives while foreign producers supply more competitive products. The outcome depends on the distribution of manufacturing costs and investment, not on regulatory ambition alone.
The strongest policy approach therefore treats flexibility as an instrument that must be justified by evidence of its expected industrial and environmental effects. It should neither be rejected categorically nor granted without conditions. The decisive question is whether the additional commercial room created by flexibility is converted into competitive European production.
Fiscal sustainability and the danger of subsidy dependence
Public financial support can accelerate industrial transformation, but its long-term effectiveness depends on whether recipients eventually operate commercially without exceptional assistance. Battery manufacturing illustrates the problem. New European facilities may require support during construction and ramp-up because established competitors possess scale and manufacturing advantages. Such assistance can be economically defensible where it helps create capabilities that would otherwise be difficult to establish. It becomes problematic if production continues to require indefinite operating subsidies because fundamental cost disadvantages remain unresolved.
The relevant fiscal assessment should distinguish capital investment, subsidised financing, operating support and contingent liabilities. A loan is not equivalent to a grant, and an announced financing envelope is not equivalent to expenditure already incurred. Public authorities should also evaluate whether support attracts private capital or substitutes for investment that firms would otherwise have financed themselves.
The Commission’s announced Battery Booster financing should therefore be assessed through project-level disclosures and realised outcomes, not through the size of the headline envelope. Similarly, administrative simplification should be evaluated through actual compliance-cost reductions rather than projected savings alone. These distinctions are essential if European industrial policy is to remain credible under fiscal constraints. Automotive Package — European Commission — December 2025. European Commission
The broader fiscal challenge concerns the opportunity cost of public expenditure. Resources directed towards preserving an existing automotive facility cannot simultaneously finance every competing investment in electricity infrastructure, research, technical education or other strategic industries. The appropriate allocation depends on the expected economic and industrial benefits, including whether support preserves capabilities that would be particularly difficult or expensive to recreate. A policy of indiscriminate rescue would risk weakening the Union’s future competitiveness by tying public resources to declining activities.
Final net assessment: the industrial capacity to decarbonise must remain the governing test
The European automotive transition is entering a phase in which the environmental objective and the industrial instruments selected to achieve it must be evaluated separately but governed together. A reduction in vehicle emissions is an environmental outcome. A higher battery-electric registration share is a market outcome. A competitive European battery factory, a viable supplier network and a manufacturing plant receiving future vehicle programmes are industrial outcomes. Each matters, but none can substitute for the others.
The available evidence supports a serious warning about the relationship between the transition calendar and Europe’s manufacturing position. The Union’s passenger-car trade surplus has contracted substantially, imported vehicles are gaining market share, and Chinese manufacturers possess important advantages across battery and vehicle production. At the same time, European manufacturers continue to operate substantial industrial systems, and the available record does not justify treating their decline as inevitable. The future remains contingent on investment, technological execution, international market conditions and policy choices.
The case for technological neutrality is strongest where it improves emissions-efficient consumer choice, preserves useful engineering capabilities and provides manufacturers with sufficient time to complete commercially viable industrial transformation. It is weakest where it becomes a mechanism for postponing investment, protecting uncompetitive products indefinitely or substituting questionable environmental compensation for verified reductions. Similarly, the case for technology-specific support is strongest where it addresses demonstrable supply-chain concentration or industrial coordination failures, and weakest where it finances capacity without credible production economics.
Europe should consequently adopt a policy hierarchy centred on four outcomes: credible emissions reduction, competitively priced low-emission vehicles, sustainable domestic manufacturing and diversified access to critical technologies. The priority is not to determine one permissible engineering solution for every producer and consumer, but to ensure that environmental standards and industrial incentives reinforce rather than undermine each other.
The 2027–2031 period will be particularly important because manufacturing investment decisions made during these years will shape the industrial capabilities available as the 2035 framework approaches. If Europe succeeds in improving battery competitiveness, securing essential materials, converting supplier networks and maintaining internationally competitive vehicle production, the transition can strengthen both climate performance and industrial autonomy. If electric adoption advances while domestic production continues losing market share and critical technologies remain concentrated abroad, Europe may achieve a more electrified vehicle market without preserving the industrial system required to manufacture its vehicles.
Chapter 9 — Key judgments
The most consequential risk is the cumulative loss of productive options rather than a single immediate collapse in automotive output. Manufacturing facilities, supplier relationships and engineering expertise can deteriorate gradually before their disappearance becomes fully visible in aggregate statistics. Public policy must therefore respond to leading indicators of industrial weakening rather than waiting for irreversible closure decisions.
The preferred strategic pathway is conditional regulatory flexibility combined with measurable investment in competitive European electric manufacturing, battery supply chains, charging infrastructure and industrial skills. Its effectiveness depends on preserving emissions integrity and ensuring that public assistance supports durable productive capability rather than recurring financial dependence.
What would change the assessment: A sustained recovery in European manufacturing-origin share, narrowing battery-cost disadvantages, profitable electric-vehicle production, stronger exports and successful supplier conversion would substantially weaken the industrial-displacement concern. Continued deterioration in production allocation, battery dependence and specialised employment would strengthen it, particularly if accompanied by repeated public support without measurable productivity gains.
Open official record: The decisive evidence through 2031 will consist of harmonised manufacturing-origin statistics, plant-level investment and closure decisions, battery-cell operating data, manufacturer profitability, verified supply-chain localisation and comparable emissions-performance records.
Pillar III — Final Strategic Conclusion
Europe’s automotive policy should be judged neither by its regulatory ambition alone nor by the immediate profitability of incumbent manufacturers. The relevant measure of success is whether the Union can reduce transport emissions while sustaining the industrial capabilities required to participate competitively in the technological system that replaces conventional vehicle production.
The current evidence does not justify abandoning decarbonisation, nor does it support the assumption that existing regulatory instruments will automatically preserve European manufacturing. It instead identifies a narrower and more demanding requirement: Europe must make the transition commercially viable for manufacturers and consumers while ensuring that an increasing share of the critical technologies and productive capabilities remains available within a resilient European industrial system.
The central policy failure to avoid is achieving the intended environmental transition after the manufacturing capabilities required to benefit economically from that transition have already been lost.
Final net assessment: Europe’s automotive transition remains industrially recoverable, but regulatory flexibility alone will not secure that recovery. The decisive variables are manufacturing productivity, commercially successful battery production, international competitiveness, resilient supply chains and the capacity to convert existing engineering expertise into the technologies of the next automotive generation. A credible strategy must advance those capabilities before industrial deterioration becomes irreversible.


