










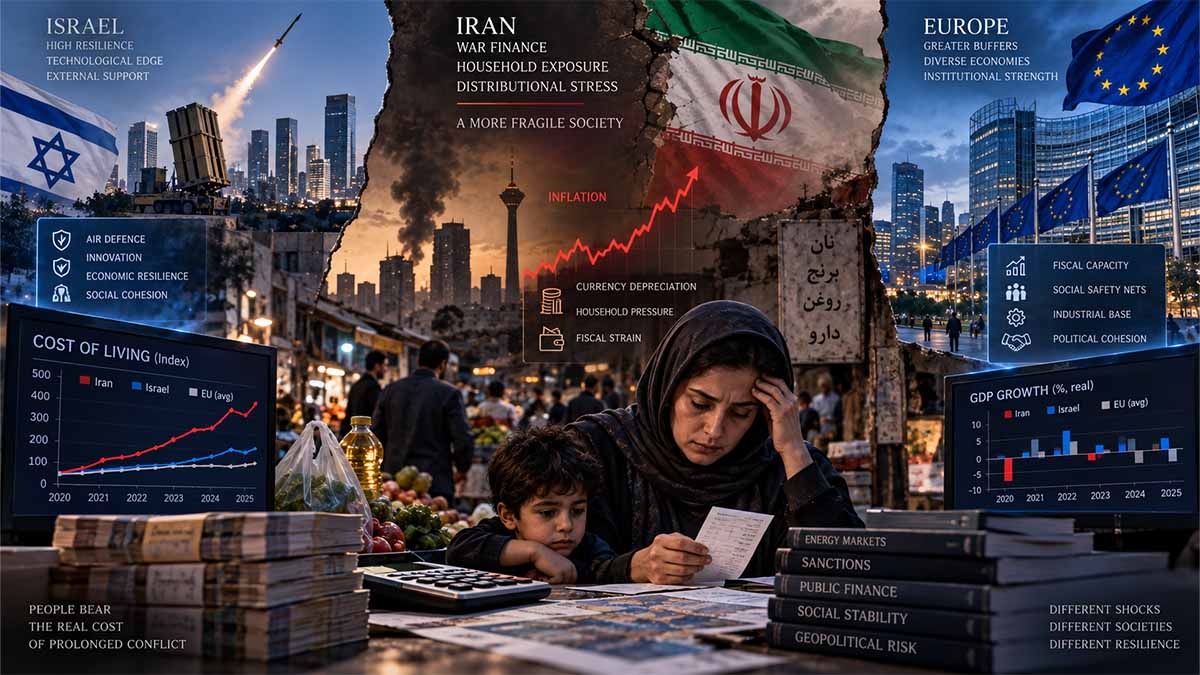
Scope: This assessment examines how war, sanctions, financial isolation, energy and trade disruption are transmitting into Iranian household welfare in 2025–2026, compares the transmission and burden-sharing mechanisms observable in Israel, the European Union, Italy, France, Germany and the United Kingdom, and adopts a five-year horizon to identify the institutional variables most likely to determine whether external economic pressure becomes prolonged domestic impoverishment.
Executive Summary / BLUF
The central finding is that Iran is experiencing a substantially more severe household-adjustment problem than Israel or the principal European economies because external revenue compression is interacting with already high inflation, exchange-rate vulnerability, fiscal constraints and weaker mechanisms for insulating household purchasing power, rather than because wartime economic pressure is unique to Iran; the IMF currently projects Iranian consumer-price inflation of 68.9% in 2026 and real GDP contraction of 5.4%, while the World Bank has withheld a conventional 2026 Iranian growth forecast in its June outlook because uncertainty has become exceptionally high. [Islamic Republic of Iran — IMF] IMF Iran country data
The external shock is material and increasingly explicit: on 24 August 2026, the United States launched Operation Economic Outcast, which the U.S. Treasury describes as an effort to sever Iran’s remaining economic and financial lifelines, including channels used for oil sales, international banking, procurement and sanctions evasion, followed by actions against banking, aviation and digital-asset networks during September; these are official descriptions of U.S. policy objectives rather than independent proof of the precise economic effect achieved inside Iran. [Treasury Launches Unprecedented Campaign Against Iranian Regime on Economic D-Day — U.S. Department of the Treasury — Aug 2026] U.S. Treasury, Operation Economic Outcast
The World Bank independently identifies the transmission mechanism that matters for household welfare: intensified sanctions, conflict, restrictions on trade and transport, lower oil revenues, shortages of imported goods and higher food prices are simultaneously weakening activity, increasing fiscal stress and raising poverty risks, while high inflation erodes real household income before nominal compensation can restore purchasing power. [Islamic Republic of Iran — World Bank Group] World Bank Iran overview
The comparison with Europe demonstrates that exposure to the Iran-related energy shock does not mechanically generate Iranian-scale household inflation, because the euro area recorded 3.2% annual inflation in August 2026, even though energy made a 1.29 percentage-point contribution to that rate and the energy component had become a significant inflationary driver; institutional capacity, monetary credibility, currency stability, fiscal space, market integration and the ability to target temporary relief therefore strongly influence the amount of an external shock that ultimately reaches household consumption. [Annual inflation up to 3.2% in the euro area — Eurostat — Sep 2026] Eurostat August 2026 inflation release
Israel provides the closer wartime comparison because it has simultaneously faced military mobilisation, production interruptions and fiscal costs, yet the Bank of Israel reported in September that inflation had moderated below the midpoint of its target range and reduced its policy rate to 3.25%, while second-quarter activity recovered after the disruption associated with Operation Roaring Lion; Israel’s experience does not establish that wartime costs are painless, but it demonstrates the stabilising importance of monetary credibility, functioning credit markets and targeted emergency liquidity mechanisms. [The Monetary Committee decides on September 1, 2026 to lower the interest rate to 3.25 percent — Bank of Israel — Sep 2026] Bank of Israel September monetary decision
The decisive analytical distinction is consequently between the origin of the economic shock and the distribution of its domestic incidence: Washington can restrict financial and commercial channels, military conflict can increase insurance, logistics and import costs, and energy disruption can reduce export earnings, but taxation, transfers, subsidy design, import prioritisation, exchange-rate allocation and protection of essential consumption determine which Iranian households absorb the resulting loss of national purchasing power. The supplied source material correctly identifies this allocation question as analytically distinct from the external shock itself, particularly where scarce resources must be prioritised among food, medicine, production inputs and non-essential consumption.
The available evidence does not yet permit the supplied claims concerning July 2026 Tehran bread prices, an August Iranian inflation reading of 69.9%/89%, the precise 110-litre gasoline threshold, or the allocation of €635 million to large-engine vehicle imports to be treated here as established official facts, because the accessible first-order record located in this research session did not independently verify those exact propositions; they are therefore excluded from the controlling judgment rather than silently reproduced.
Iran’s War Economy Is a Test of Who Gets Protected First
Iran’s wartime economic problem is no longer only how much revenue sanctions and maritime pressure remove, but how Tehran allocates what remains. In 2025, regulations reopened imports of cars above 2,500 cubic centimetres, with a reported plan for roughly 13,000 vehicles and about €635 million in foreign exchange, even as medicine, food, animal feed, machinery and industrial components competed for scarce currency. The contradiction defines the policy choice now facing the state: customs revenue from expensive imports can replenish the budget, but it cannot recreate the foreign exchange already spent abroad. Under blockade, the decisive variable is therefore not simply national income but the hierarchy of claims placed upon it. If that hierarchy remains opaque, external pressure will continue to be converted into a disproportionately domestic shock borne through food, housing, transport and medicine.
Scarce currency has become a distribution system
The €635 million reportedly allocated to the 2025 large-engine vehicle plan captures the opportunity cost with unusual clarity: around 8,000 vehicles between 2,500 and 3,000 cc were contemplated under a 180% tariff, with another 5,000 vehicles above 3,000 cc under a 190% tariff. A high tariff allows the treasury to appropriate part of the purchasing power of affluent consumers, but the budgetary gain does not reverse the external transaction; every euro transferred to a vehicle supplier is a euro unavailable at that moment for pharmaceuticals, agricultural inputs or machinery. The relevant wartime accounting therefore begins before customs revenue is collected, because foreign exchange itself has become the scarce asset.
The Toyota Land Cruiser example makes the distinction even sharper: a 2025 model priced at roughly US$60,000 in the UAE can sell for several times that amount inside Iran once tariffs and other charges are applied. The state can tax the domestic scarcity premium, but it cannot tax its way back into possession of the foreign currency used to acquire the vehicle. That is why preferential currency, subsidised credit, procurement contracts and tax relief now require the same scrutiny as direct budget expenditure: each constitutes a claim on resources whose value rises as the blockade tightens.
Price controls work only when supply policy arrives first
Iran already accepts the principle that wartime markets cannot always be left to clear without intervention. Authorities have imposed a 25% annual ceiling on rent increases, including in Tehran, while seeking to encourage lease renewal and limit arbitrary eviction; the dossier also notes uneven enforcement, which exposes the central problem with emergency controls. A price ceiling without new supply, credit or compensation can suppress the legal price while reducing availability, deteriorating quality or shifting transactions into informal markets.
The more credible alternative is narrower and administratively harder: temporary caps on essential goods combined with preferential foreign exchange for raw materials, release of strategic stocks before shortages become acute, affordable producer credit or tax relief, and direct support for low-income households. The mechanism matters because a cap alone transfers losses to producers, while supply support without retail discipline can transfer public resources to intermediaries. The 25% rent ceiling is therefore significant less as a model to replicate than as evidence that Tehran already recognises emergency intervention; what remains missing is a system linking intervention to production and supply.
Eurasia buys resilience, not equivalence
The most important structural counterweight to southern maritime pressure is the Iran–Eurasian Economic Union free-trade agreement, effective from 15 May 2025, which reduced or eliminated tariffs across a large share of trade with Russia, Kazakhstan, Belarus, Armenia and Kyrgyzstan. The agreement broadens Iran’s sourcing options for food, raw materials and industrial goods and therefore reduces the extent to which disruption at southern ports can become complete commercial isolation.
The agricultural numbers show why the northern route matters: Kazakhstan exported about 1.1 million tonnes of grain to Iran in 2025, while officials discussed the possibility of increasing annual wheat shipments by as much as 2 million tonnes. Barley, corn, vegetable oil, meat and legumes widen the potential basket, and Russian grain can also move through the Caspian. Yet the same evidence defines the ceiling on this option: falling Caspian water levels, small vessels and limited port capacity constrain throughput, meaning that Eurasian trade can diversify Iranian supply but cannot reproduce maritime scale at comparable cost.
The rail alternative carries the same dual message. In September, a 55-container block train left China for Sarakhs through Kazakhstan, Uzbekistan and Turkmenistan, with an expected transit time of 14–16 days across more than 6,000 kilometres. That route proves that pressure at sea does not sever Iran from Eurasian supply chains; it does not prove that rail can substitute for the commercial geography that existed before the war, when more than 80% of Iran’s two-way trade by volume moved through its southern coastline.
One Iranian trade official estimated that replacing maritime China trade with land transport could add US$18 billion a year, a figure that captures the difference between access and economic efficiency. Longer distance, transshipment, border congestion, limited rolling stock and dependence on neighbouring governments all raise the landed cost of imports, which means that northern routes are most valuable when used selectively for goods whose strategic value justifies their transport premium rather than as a rhetorical substitute for ports.
Customs delays now function like an additional sanction
Once food, medicine, agricultural supplies or industrial components have reached the Iranian border, delay ceases to be an external constraint and becomes an administrative choice. The dossier’s prescription for a wartime fast track follows directly from the economics of scarcity: priority cargo should receive quicker foreign-exchange approval and customs clearance, with post-entry inspections where public safety permits, because every additional day of detention increases working-capital requirements and raises the probability that a manageable shortage becomes a production interruption.
Tehran has already demonstrated that it can suspend domestic charges when logistics require it. On 10 September, the government temporarily removed a 10% charge on foreign vessels carrying specified oil, gas and liquid-petroleum products to or from Iran, explicitly reducing a domestic cost intended to encourage foreign shipping. The logic is broader than maritime energy: if a regulation increases the delivered cost of an essential import without providing a commensurate security or fiscal benefit, wartime administration should subject it to the same test.
Fiscal policy decides who absorbs the blockade
A widening deficit does not make higher gasoline prices the only available adjustment mechanism. The dossier identifies several alternatives: reductions in non-essential expenditure, narrower tax exemptions, stronger action against large-scale evasion, more effective taxation of luxury property and vehicles, and a workable capital-gains regime, alongside more aggressive reduction of energy subsidies for the largest consumers and compensation for households whose employment depends on transport. These choices differ because they decide whether the fiscal shock is absorbed through wealth, consumption, business margins or essential household expenditure.
The distribution mechanism matters strategically because food inflation above 100%, weak enforcement of rent ceilings and wages covering a shrinking proportion of basic costs do not appear to households as separate technical corrections; together they determine which groups liquidate savings and assets first. Washington’s economic campaign is designed to increase the domestic cost of resistance, but Tehran still decides whether that cost first reaches a luxury importer, a property owner, a heavy energy consumer or a household purchasing bread and medicine.
The contradiction is that Iran already possesses fragments of the policy architecture required to distribute the burden differently: the 25% rent ceiling, the 10 September suspension of the 10% shipping charge, preferential foreign exchange, strategic-stock management and the 15 May 2025 EAEU agreement all show that Tehran is intervening in prices, logistics and trade. What it lacks, according to the dossier, is a unified wartime programme with transparent data on oil receipts, foreign-exchange allocation, strategic stocks and the beneficiaries of subsidies.
The next 12–24 months will be decided by administrative hierarchy
Over the next 12–24 months, the principal risk is not that Iran will have no alternatives, but that fragmented interventions will consume scarce resources without establishing an explicit order of priority. The country retains a large domestic market, substantial industrial capacity, major energy resources, skilled labour and access to several economic blocs, while the 15 May 2025 EAEU agreement, the 1.1 million tonnes of Kazakh grain shipped in 2025 and the 55-container China–Sarakhs train show that external routes remain available. None of these assets, however, determines who receives scarce foreign exchange first.
If Tehran does not convert those assets into a published hierarchy placing medicine, food, agricultural inputs and production ahead of deferrable consumption, the cost of inaction will be paid first by households whose expenditure cannot be postponed and then by firms whose imported inputs cannot be replaced domestically. If it does, the adjustment will still be painful: the 80%-plus pre-war share of trade moving through southern ports cannot be recreated quickly by rail, while a land substitution bill estimated at US$18 billion annually would itself reduce national purchasing power. The policy choice is therefore not between pain and no pain, but between absorbing scarcity through deliberate allocation or allowing scarcity to allocate itself through prices, queues and access.
Iran’s economic resilience over those 12–24 months will ultimately be measured less by the number of barrels sold or trains arriving at Sarakhs than by whether food, housing, transport and medicine remain affordable while the state preserves enough foreign exchange for production. The dossier’s evidence points to a clear institutional test: the €635 million associated with the 2025 large-engine vehicle plan, the 25% rent ceiling, the 10% freight-charge suspension of 10 September and the expansion of Eurasian routes are not separate stories; they are competing claims on the same wartime state capacity. Failure to rank them coherently leaves the least flexible household budget as the residual absorber of the blockade.
Navigational Index
Household Transmission
How sanctions, conflict, currency scarcity, fiscal pressure and domestic price formation convert a sovereign external shock into declining household purchasing power, and why food, transport, housing and medicine become the most consequential transmission channels.
Comparative Resilience
Why Israel, the EU, Italy, France, Germany and the United Kingdom are experiencing measurable energy and wartime spillovers without a comparable collapse in price stability, and which institutional mechanisms explain the difference without treating the European economies as a single homogeneous system.
Allocation and State Capacity
How foreign-exchange prioritisation, targeted transfers, fiscal design, banking resilience, trade corridors and administrative credibility determine whether external pressure remains concentrated in sovereign finances or migrates rapidly into ordinary household budgets.
Master Abstract
Iran’s problem is not merely inflation but simultaneous erosion of several shock absorbers
Iran entered the present confrontation with structural characteristics that make external coercion unusually powerful when several channels operate simultaneously, because oil remains important to government revenues and foreign-exchange generation despite substantial economic diversification, financial sanctions already restrict access to international payment systems, recurrent currency depreciation magnifies the domestic price of imports, and prolonged high inflation has previously eroded household purchasing power even before the latest conflict shock intensified. The IMF’s current country page projects a 5.4% contraction in real GDP and 68.9% consumer-price inflation for 2026, while the World Bank describes an economy constrained by conflict, sanctions, water and energy shortages, weaker investment and disrupted imports; the World Bank’s June 2026 Global Economic Prospects report went further by excluding Iran from the normal regional forecast because uncertainty was exceptionally high, which itself constitutes a significant analytical signal about the stability of conventional macroeconomic relationships. [Islamic Republic of Iran and the IMF — IMF] IMF Iran country page [Global Economic Prospects — World Bank — Jun 2026] World Bank Global Economic Prospects June 2026
The distinction between external pressure and domestic distribution remains essential because macroeconomic scarcity never arrives at households in a politically or economically neutral form: a fall in export receipts narrows the pool of foreign exchange, but public authorities still determine the priority attached to pharmaceuticals, basic food imports, agricultural inputs, industrial intermediates, infrastructure, energy subsidies and non-essential consumption, while fiscal authorities determine which expenditures are reduced, which taxes are increased and which groups receive compensation. Earlier World Bank analysis of Iran already documented that the government had expanded transfers and subsidies to offset high inflation but found that many measures were insufficiently targeted and added to fiscal pressure, meaning that the central policy problem is not simply whether intervention exists but whether scarce public resources reach households with the highest marginal exposure to food, housing and transport prices. [Iran Overview — World Bank] World Bank Iran economic overview
The scale of external pressure has increased materially since August because the United States is no longer describing its policy simply as maintenance of the pre-existing sanctions architecture, but as a whole-of-government campaign intended to attack the networks through which Iran obtains revenue, banking access, procurement capability and international commercial services; Treasury subsequently targeted a UAE banking channel, Iranian airlines, proxy-related networks, a Russian financial institution and a digital-asset exchange, while warning third-country entities that facilitating Iranian sanctions evasion can expose them to exclusion from the U.S. financial system. These statements establish the scope and intent of U.S. policy, although economic impact must be assessed separately rather than inferred directly from Treasury rhetoric. [Operation Economic Outcast Strikes Iran’s Global Terrorist Proxy Network — U.S. Treasury — Sep 2026] Treasury September 10 action [Operation Economic Outcast Sanctions Major Bank Helping Iran Evade Sanctions — U.S. Treasury — Sep 2026] Treasury September 14 action
The resulting Iranian vulnerability therefore has a reinforcing structure rather than a single cause: financial isolation increases the cost of settling trade; declining or less accessible export revenue tightens the supply of foreign exchange; exchange-rate weakness raises import prices; import shortages increase domestic scarcity premiums; fiscal deterioration limits the state’s ability to compensate households; and expectations of future inflation accelerate precautionary purchasing and repricing, producing a transmission mechanism in which even an imported shock can become domestically self-reinforcing. The World Bank identifies essentially this combination of lower oil revenue, damaged infrastructure, transport and insurance constraints, weakening investment and high food inflation as a mechanism through which poverty is expected to rise, while the IMF’s exceptionally high inflation projection indicates that Iran is operating in a fundamentally different price regime from the European economies used here as comparators. [Iran Economic Assessment — World Bank] World Bank Iran assessment document
Europe is absorbing the energy shock through institutions that Iran cannot replicate at equivalent scale
Europe is not insulated from the Iran conflict, because Eurostat reported euro-area inflation of 3.2% in August 2026, compared with 2.9% in July, while energy contributed 1.29 percentage points to the annual rate, demonstrating that the Middle Eastern shock has entered European consumer prices; the magnitude of household transmission nevertheless remains far below the Iranian inflation environment because European economies retain convertible currencies, diversified suppliers, deep capital markets, functioning monetary-policy transmission and substantially greater ability to borrow or reallocate resources during temporary disruptions. [Annual inflation up to 3.2% in the euro area — Eurostat — Sep 2026] Eurostat full August release
That comparison should not be interpreted as evidence that European households are unaffected, because the same Eurostat data show that energy rather than underlying food inflation was driving much of the latest acceleration, while the euro area’s inflation rate excluding energy was only 2.1% and the measure excluding energy, food, alcohol and tobacco was 2.4%; this separation is analytically important because it indicates that the shock remains disproportionately concentrated in the energy channel rather than having become a broad loss of monetary anchoring comparable to Iran’s. [Annual inflation up to 3.2% in the euro area — Eurostat — Sep 2026] Eurostat inflation components
Italy
Italy’s August data provide a particularly useful transmission example because headline national inflation accelerated to 3.3% year on year, while regulated energy prices were 18.6% higher and non-regulated energy prices 17.0% higher than a year earlier, yet core inflation excluding energy and unprocessed food stood at only 1.5% and the frequently purchased grocery-and-household basket increased by 0.9%; the Italian household was therefore experiencing a significant energy shock without a comparable acceleration across basic food consumption, which sharply distinguishes the structure of Italian inflation from the broader purchasing-power deterioration documented for Iran. [Consumer prices — August 2026 — Istat] Istat August 2026 consumer prices
France
France presents an even lower headline transmission, with INSEE recording 2.4% annual consumer-price inflation in August 2026, despite continuing acceleration in energy prices, demonstrating that exposure to the same international commodity and geopolitical environment can coexist with materially different national inflation outcomes when domestic energy mixes, fiscal arrangements, regulated prices and underlying demand conditions differ. [In August 2026, consumer prices rose by 2.4% year on year — INSEE — Sep 2026] INSEE August 2026 CPI release
Germany
Germany offers the clearest official attribution of the European energy effect to the Iran conflict, because Destatis reported 2.9% annual inflation in August 2026, energy prices 10.5% higher than a year earlier and motor-fuel prices 27.7% higher, while explicitly stating that the acceleration in energy costs was principally associated with the Iran war; core inflation excluding food and energy was nevertheless only 2.4%, illustrating that even a large fuel shock had not produced generalised Iranian-style inflation. [Inflation rate at +2.9% in August 2026 — Destatis — Sep 2026] Destatis August 2026 inflation release
United Kingdom
The United Kingdom, which lies outside the EU monetary and fiscal architecture but retains comparable institutional depth, recorded 3.1% CPI inflation and 3.3% CPIH inflation in August 2026, with transport and especially motor fuels making the largest upward contribution to the change in the annual rate, while core CPI remained 2.6%; the UK case therefore reinforces the same mechanism observed in continental Europe, in which the Iran-linked energy shock is visible but remains contained within a broader macroeconomic framework that has not lost its nominal anchor. [Consumer price inflation, UK: August 2026 — Office for National Statistics] ONS August 2026 inflation bulletin
Israel shows the importance of targeted wartime financial transmission mechanisms
Israel constitutes a more relevant comparator than Europe alone because its economy has experienced direct military disruption, reserve mobilisation, damage to productive activity and substantial wartime fiscal expenditure, yet the Bank of Israel’s September assessment stated that inflation had moderated below the midpoint of the target range and reduced the policy rate to 3.25%, while reporting that second-quarter GDP had recovered relative to the fourth quarter of 2025 after the sharp interruption associated with the confrontation with Iran. [The Monetary Committee decides on September 1, 2026 to lower the interest rate to 3.25 percent — Bank of Israel] Bank of Israel September decision
The Israeli system also demonstrates a specific burden-sharing instrument that is analytically relevant to Iran without implying that the institutional models are directly transferable, because the Bank of Israel coordinated a banking-sector relief programme for reservists, evacuated households and small or micro businesses directly affected by Operation Roaring Lion, allowing qualifying borrowers to defer loan payments and thereby shifting part of the immediate liquidity shock away from household cash flow and toward the financial system over time. [The Bank of Israel has formulated an assistance program that has been adopted by the banks — Bank of Israel — Mar 2026] Bank of Israel emergency credit relief framework
This relief did not eliminate the public cost of war, because the Bank of Israel separately reported a strong positive fiscal impulse associated with defence expenditure and noted that tax increases subsequently reduced that impulse, while its July forecast placed the 2026 government deficit at 4.9% of GDP and debt at approximately 69% of GDP; the critical difference is therefore not that Israel avoided fiscal adjustment, but that wartime adjustment occurred within a financial architecture capable of combining deficit financing, monetary stabilisation, targeted credit relief and eventual tax increases without simultaneously experiencing the extreme currency and inflation pressures confronting Iran. [Research Department Staff Forecast, July 2026 — Bank of Israel] Bank of Israel July 2026 forecast [The Fiscal Impulse During the War — Bank of Israel — Mar 2026] Bank of Israel fiscal impulse analysis
Iran retains external alternatives, but diversification does not equal substitution
Iran is not economically isolated from every non-Western market, because the full free-trade agreement with the Eurasian Economic Union entered into force on 15 May 2025 and establishes duty-free treatment for almost 90% of goods while creating broader mechanisms for trade facilitation and economic cooperation; the agreement therefore expands Iran’s formal access to Russia, Kazakhstan, Belarus, Armenia and Kyrgyzstan and gives Tehran institutional channels through which food, agricultural products, machinery and industrial goods can continue moving despite Western restrictions. [Free Trade Agreement between the Eurasian Economic Union and the Islamic Republic of Iran — Eurasian Economic Commission] EAEU–Iran Free Trade Agreement [EEC implementation statement — May 2025] Eurasian Economic Commission implementation notice
The agreement nevertheless addresses tariff and commercial access rather than the entire financing and logistics problem created by intensified U.S. pressure, because foreign banks, insurers, carriers, commodity traders and intermediaries must separately assess sanctions exposure, while Treasury’s September actions explicitly extended enforcement toward foreign banking relationships, aviation networks and digital settlement channels; Eurasian access can therefore reduce some physical-supply constraints without automatically restoring inexpensive international finance, maritime insurance or unrestricted hard-currency settlement. [Iran’s Access to UAE Banks Targeted Under Operation Economic Outcast — U.S. Treasury — Aug 2026] U.S. Treasury UAE banking action [Treasury Grounds Iranian Airlines with Sweeping Sanctions Action — Sep 2026] U.S. Treasury aviation action
The comparison isolates the true resilience variable
The evidence consequently supports a narrower and more defensible proposition than the claim that sanctions alone explain Iran’s household crisis or, conversely, that domestic policy alone produces it: Iran is confronting an externally generated contraction in accessible revenue and trade channels inside a domestic economic structure whose inflation, exchange-rate, fiscal and welfare mechanisms amplify the household incidence of that contraction, whereas Israel and the principal European economies are transmitting a smaller proportion of the same geopolitical and energy shock into basic household prices because their currencies, financial markets, social-protection instruments and state financing capacity remain substantially more stable. [World Economic Outlook, April 2026 — IMF] IMF World Economic Outlook April 2026 [Annual inflation up to 3.2% in the euro area — Eurostat] Eurostat August inflation data
This does not establish that every Iranian distributional decision is inefficient or inequitable, because a rigorous conclusion requires official data on the allocation of subsidised foreign exchange, fiscal transfers, import licensing, household expenditure incidence, strategic inventories and the financing of specific wartime programmes that are not currently available at sufficient granularity; it does establish that the distribution of the shock cannot analytically be attributed to foreign coercion alone once the external loss reaches the national balance sheet, because domestic institutions necessarily determine how that loss is apportioned among public investment, private consumption, essential imports, subsidies, taxation, inflation and depletion of household savings. The conceptual priority hierarchy identified in the supplied material—food, housing, medicine, transport and production inputs versus deferrable consumption—therefore constitutes a valid question for investigation even where several of its accompanying numerical examples still require stronger first-order verification.
Key Evidence Table
| Indicator | Value/status | Reference date | Definition/scope | Issuer | Exact source |
|---|---|---|---|---|---|
| Iran projected real GDP growth | −5.4% | 2026 | IMF current country projection | IMF | [Islamic Republic of Iran and the IMF] Source |
| Iran projected consumer-price inflation | 68.9% | 2026 | IMF current country projection | IMF | [Islamic Republic of Iran and the IMF] Source |
| Iran World Bank growth forecast | Excluded because of exceptionally high uncertainty | Jun 2026 outlook | World Bank MENA forecast treatment | World Bank | [Global Economic Prospects, June 2026] Source |
| Euro-area annual inflation | 3.2% | Aug 2026 | HICP, year on year | Eurostat | [Annual inflation up to 3.2% in the euro area] Source |
| Euro-area energy contribution | +1.29 pp | Aug 2026 | Contribution to annual HICP | Eurostat | [Annual inflation up to 3.2% in the euro area] Source |
| Italy CPI | 3.3% | Aug 2026 | NIC, year on year | Istat | [Consumer prices — August 2026] Source |
| France CPI | 2.4% | Aug 2026 | CPI, year on year | INSEE | [Consumer price index — final results — August 2026] Source |
| Germany CPI | 2.9% | Aug 2026 | CPI, year on year | Destatis | [Inflation rate at +2.9% in August 2026] Source |
| Germany motor-fuel inflation | 27.7% | Aug 2026 | Year on year | Destatis | [Inflation rate at +2.9% in August 2026] Source |
| UK CPI | 3.1% | Aug 2026 | CPI, year on year | ONS | [Consumer price inflation, UK: August 2026] Source |
| Israeli policy rate | 3.25% | 1 Sep 2026 | Central-bank policy rate | Bank of Israel | [Monetary Committee decision] Source |
| Israel 2026 deficit forecast | 4.9% of GDP | Jul 2026 forecast | General-government forecast used by BoI | Bank of Israel | [Research Department Staff Forecast, July 2026] Source |
| EAEU–Iran FTA | In force | 15 May 2025 | Full free-trade agreement; almost 90% of goods duty-free | Eurasian Economic Commission | [EAEU–Iran implementation] Source |
Competing Explanations or Pathways
The ACH gate is met only in a limited form because three distinct causal explanations for Iran’s household deterioration can be tested against observable evidence, although the available public record does not support numerical probability assignments and therefore none are supplied.
| Hypothesis | Diagnostic support | Disconfirming evidence | Indicators | Current standing |
|---|---|---|---|---|
| External-pressure dominant: sanctions, war and international financial isolation account for most household deterioration | U.S. policy explicitly targets Iranian revenue, banking and procurement channels; World Bank identifies trade, insurance, oil and import disruption as major pressures. | Iran experienced structurally high inflation and fiscal weaknesses before the latest escalation, so the external shock cannot explain all price instability. | Export receipts, effective exchange rate, import volumes, settlement delays, freight and insurance costs | Strong explanatory component, insufficient as a complete explanation |
| Domestic-amplification dominant: fiscal, monetary, subsidy and allocation mechanisms explain most of the household burden | IMF inflation projection vastly exceeds European comparators exposed to the same global energy shock; World Bank documents longstanding inflation and targeting weaknesses. | The magnitude and explicit breadth of current U.S. financial pressure materially reduce Iran’s policy room and foreign-exchange availability. | Money growth, fiscal financing, subsidy incidence, FX allocation, cash-transfer indexation | Strong amplification mechanism, but not an independent origin of the entire shock |
| Combined external-plus-domestic mechanism: foreign pressure reduces national resources while domestic institutions determine the distribution and amplification of the loss | Consistent simultaneously with U.S. sanctions evidence, World Bank transmission analysis, IMF inflation projections and the much smaller European/Israeli pass-through. | Would weaken if reliable Iranian data showed household real incomes stabilising despite continued external pressure or demonstrated that imported prices alone explain most inflation | Real wages, food inflation, FX allocation, transfer coverage, fiscal monetisation, essential-import volumes | Best-supported explanatory structure in the current public record, without implying that relative causal weights are yet measurable |
Principal Gaps and Watch Indicators
Iranian oil receipts rather than announced sales volumes remain the most important unresolved external account variable, because the analytical requirement is not merely to establish that cargoes departed Iranian terminals but to establish the amount, currency, discount, settlement channel and timing of foreign exchange actually accessible to the domestic economy; continuing U.S. action against banking and sanctions-evasion channels makes the difference between gross exports and spendable receipts increasingly material. [Operation Economic Outcast Sanctions Major Bank Helping Iran Evade Sanctions — U.S. Treasury — Sep 2026] Treasury banking action
Household-incidence data constitute the largest domestic evidence gap, because authoritative publication of decile-level food expenditure, real wages, benefit coverage, arrears, rent burdens, medicine availability and household asset liquidation would determine whether inflation is being distributed broadly or disproportionately through lower-income households; the World Bank already expects poverty pressure to increase, but the present official record does not support the precision necessary to quantify the current 2026 distribution. [Iran assessment — World Bank] World Bank Iran economic assessment
Foreign-exchange allocation requires direct observation, because disclosure of monthly allocations to food, pharmaceuticals, livestock feed, industrial inputs, passenger vehicles, travel and other non-essential categories would convert the distributional debate from assertion into auditable public finance analysis; the supplied material identifies precisely this hierarchy-of-priorities problem, but the comparative amounts remain an open official record.
Eurasian trade performance should be monitored separately from diplomatic announcements, because the EAEU free-trade agreement provides a real legal-commercial architecture but does not establish the realised tonnage, financing cost, border delays or substitution ratio achieved under current sanctions pressure; customs volumes, rail throughput, Caspian shipping capacity and settlement mechanisms would show whether northern routes are materially reducing shortages or merely moderating their rate of deterioration. [Free Trade Agreement between the EAEU and Iran — Eurasian Economic Commission] EAEU–Iran FTA text
The Israel-Europe comparison should be watched through the separation between headline and underlying inflation, because a continued rise in energy prices combined with stable core and food inflation would confirm that institutional shock absorbers are still containing second-round effects, whereas broad acceleration in wages, services and essential-food prices would narrow part of the present resilience gap without implying convergence toward Iran’s much more severe macroeconomic environment. [Annual inflation up to 3.2% in the euro area — Eurostat — Sep 2026] Eurostat inflation components [Consumer price inflation, UK: August 2026 — ONS] ONS inflation components
Visualisation
No decision-useful visualisation is supportable from the verified record, because the available Iranian figure is a full-year IMF projection, the European figures are August 2026 observed HICP/CPI rates, and the Israeli evidence available in the verified record uses a combination of target-relative current inflation statements and forecast measures; placing those observations on a single comparative chart would create false comparability between different vintages, definitions and reference periods rather than improve comprehension. [Islamic Republic of Iran and the IMF] IMF Iran data [Annual inflation up to 3.2% in the euro area — Eurostat] Eurostat August 2026 data
Iran’s Distributional Stress Test: War Finance, Household Exposure and the Resilience Gap with Israel and Europe
BLUF. The controlling assessment is not that wartime pressure is unique to Iran, but that external revenue compression is interacting with an already fragile inflation, exchange-rate, fiscal and welfare architecture. The IMF projects Iranian consumer-price inflation of 68.9% and real GDP contraction of 5.4% in 2026. By contrast, the euro area recorded 3.2% annual inflation in August 2026, while Israel retained monetary-policy and credit-relief mechanisms capable of distributing wartime liquidity stress over time. The decisive analytical variable is therefore not merely the origin of the shock, but the institutional machinery through which national losses are transmitted to households.
External compression is interacting with weakened domestic shock absorbers
Financial isolation, lower accessible export revenue, exchange-rate weakness, import scarcity and fiscal constraints form a reinforcing transmission chain. The central distributional question is which households ultimately absorb the decline in national purchasing power.
Verified macroeconomic and institutional reference points
| Indicator | Value / Status | Reference | Definition / Scope | Issuer |
|---|---|---|---|---|
| Iran projected real GDP growth | −5.4% | 2026 | Current country projection | IMF |
| Iran projected consumer-price inflation | 68.9% | 2026 | Current country projection | IMF |
| Iran World Bank growth forecast | Excluded | June 2026 | Exceptionally high uncertainty | World Bank |
| Euro-area annual inflation | 3.2% | Aug 2026 | HICP, year on year | Eurostat |
| Euro-area energy contribution | +1.29 pp | Aug 2026 | Contribution to annual HICP | Eurostat |
| Italy CPI | 3.3% | Aug 2026 | NIC, year on year | Istat |
| France CPI | 2.4% | Aug 2026 | CPI, year on year | INSEE |
| Germany CPI | 2.9% | Aug 2026 | CPI, year on year | Destatis |
| Germany motor-fuel inflation | 27.7% | Aug 2026 | Year on year | Destatis |
| United Kingdom CPI | 3.1% | Aug 2026 | CPI, year on year | ONS |
| Israeli policy rate | 3.25% | 1 Sep 2026 | Central-bank policy rate | Bank of Israel |
| Israel 2026 deficit forecast | 4.9% of GDP | Jul 2026 forecast | General-government forecast | Bank of Israel |
| EAEU–Iran FTA | In force | 15 May 2025 | Almost 90% of goods duty-free | Eurasian Economic Commission |
Europe: energy shock visible, nominal anchor largely intact
| Economy | Headline | Energy / Transport Signal | Underlying Signal | Analytical Reading |
|---|---|---|---|---|
| Euro area | 3.2% | Energy contribution +1.29 pp | Ex-energy 2.1%; core measure 2.4% | Shock remains disproportionately energy-centred. |
| Italy | 3.3% | Regulated energy +18.6%; non-regulated +17.0% | Core 1.5%; frequent-purchase basket +0.9% | Large energy impulse without broad basic-consumption acceleration. |
| France | 2.4% | Energy prices accelerating | Low headline pass-through relative to peers | Domestic energy mix and price-setting mechanisms matter. |
| Germany | 2.9% | Energy +10.5%; motor fuels +27.7% | Core 2.4% | Large fuel shock had not become generalized inflation. |
| United Kingdom | 3.1% CPI | Transport / motor fuels main upward contribution | Core CPI 2.6% | Energy effect visible without loss of nominal anchor. |
From external coercion to household incidence
Three causal pathways supported to different degrees
External-pressure dominant
U.S. policy explicitly targets revenue, banking, procurement and sanctions-evasion channels, while the World Bank identifies trade, insurance, oil and import disruption as material pressures.
Domestic-amplification dominant
Inflation far above European comparators and longstanding weaknesses in subsidy targeting, exchange-rate management and fiscal financing indicate powerful domestic amplification.
Combined external + domestic mechanism
External pressure reduces the national resource envelope while domestic institutions determine allocation, compensation, monetisation and therefore the distribution and amplification of the loss.
Why comparable geopolitical exposure does not imply comparable household outcomes
The EAEU–Iran free-trade agreement provides access, but does not solve the financing problem
The full EAEU–Iran free-trade agreement entered into force on 15 May 2025 and provides duty-free treatment for almost 90% of goods. This expands formal trade access to Russia, Kazakhstan, Belarus, Armenia and Kyrgyzstan. It does not, however, automatically restore inexpensive international finance, maritime insurance or unrestricted hard-currency settlement. Banks, insurers, carriers and intermediaries still face separate sanctions-risk calculations.
Six controlling conclusions
Iran’s household problem reflects the interaction of external revenue compression with pre-existing inflation, exchange-rate vulnerability and fiscal constraints—not a single-variable sanctions mechanism.
European data show that a substantial energy shock can raise headline inflation without automatically producing a generalized loss of monetary anchoring.
Israel demonstrates the importance of monetary credibility, credit-market continuity and targeted emergency liquidity in redistributing wartime cash-flow shocks.
Once an external loss reaches the national balance sheet, domestic choices over taxation, subsidies, transfers, import priority and FX allocation determine its incidence across households.
Eurasian trade access may moderate physical supply constraints, but tariff liberalisation cannot be treated as a substitute for unrestricted finance, insurance or hard-currency settlement.
The public record is not yet sufficiently granular to quantify the distribution of Iran’s 2026 shock by income decile, consumption category or specific foreign-exchange allocation.
Evidence required for a harder distributional test
- Accessible oil receipts: currency, discounts, settlement channels and timing—not announced cargo volumes alone.
- Household incidence: decile-level food expenditure, real wages, rents, benefit coverage, arrears and asset liquidation.
- FX allocation: monthly allocations to food, medicines, feed, production inputs, travel and non-essential goods.
- Eurasian trade performance: realised tonnage, financing cost, border delays, Caspian throughput and settlement mechanisms.
Signals that would confirm or weaken the current assessment
Household Transmission
Principal judgment
Iran’s household crisis is no longer adequately described as a conventional inflation episode in which higher import costs gradually pass through into retail prices, because the available evidence shows a multi-stage compression mechanism in which declining access to foreign exchange, currency depreciation, removal of subsidised exchange-rate channels, weaker imports, falling real income, fiscal deterioration and disruption to domestic supply are operating simultaneously, thereby forcing households to absorb the shock through reduced consumption, substitution toward cheaper goods, depletion of savings, greater dependence on transfers and deteriorating access to health and other essential services. The most consequential feature is the asymmetry of this mechanism: households with the smallest discretionary budgets cannot respond to a doubling of food prices in the same way that higher-income households respond to more expensive imported durables, because food, housing, transport and medicines are difficult to postpone and already command a large proportion of lower-income expenditure.
The April 2026 World Bank assessment provides the strongest currently accessible integrated measure of this transmission process, because it records a 44% year-on-year currency depreciation in early March 2026, 62.2% year-on-year consumer-price inflation in February, and 99% year-on-year food inflation, while estimating that 36% of Iranians were already living below the World Bank’s US$8.30-a-day upper-middle-income poverty line in 2023/24; in response, the government announced an electronic voucher equivalent to IRR10 million per person for 80 million citizens, which the World Bank valued at approximately US$7 per person and judged sufficient to offset only part of the welfare deterioration. Macro Poverty Outlook: Islamic Republic of Iran — World Bank — Apr 2026
These figures matter less as isolated macroeconomic records than as a description of the sequence through which external financial pressure reaches the household: foreign-exchange scarcity changes the domestic-currency cost of imports; exchange-rate depreciation increases the replacement cost of imported food, medicines, agricultural inputs and intermediate goods; removal or narrowing of preferential exchange rates allows a larger share of that increase to enter final prices; firms confronted with higher working-capital and replacement costs raise prices before existing stocks are exhausted; fiscal transfers then attempt to restore purchasing power after the price shock has already occurred, while deficit financing can itself sustain inflation if expenditure cannot be financed from taxation or non-inflationary borrowing. The World Bank explicitly expects Iran’s fiscal deficit to be financed through domestic bond issuance, withdrawals from the sovereign wealth fund and monetary financing, with the latter adding to continuing inflationary pressure. Macro Poverty Outlook: Islamic Republic of Iran — World Bank — Apr 2026
The household shock is operating through several mutually reinforcing channels
| Transmission channel | Verified current evidence | Immediate household effect | Secondary effect | Distributional significance |
|---|---|---|---|---|
| Foreign-exchange contraction | World Bank attributes reduced access to FX reserves to intensified sanctions, conflict and weaker exports | Imported essentials become more expensive in rial terms | Importers ration supply or pass higher replacement costs into prices | Strongest where households depend on imported medicines, food ingredients or imported-input-intensive goods |
| Currency depreciation | 44% y/y depreciation in early March 2026 | Domestic currency buys fewer imported goods | Inflation expectations accelerate repricing across domestically produced goods containing imported inputs | Cash wages and fixed transfers lose real value rapidly |
| Withdrawal of subsidised FX | World Bank identifies pass-through from phasing out subsidised exchange-rate allocation | Protected imported goods move closer to market-equivalent replacement cost | Price increases propagate through food-processing and distribution chains | Disproportionately affects households with high food expenditure shares |
| Food inflation | 99% y/y in February 2026 | Essential consumption absorbs more disposable income | Households substitute toward cheaper calories and reduce dietary diversity | Poorer households have less scope to substitute away from essentials |
| General inflation | 62.2% y/y in February 2026 | Real value of salaries, pensions, savings and cash transfers falls | Demand shifts toward immediate consumption and durable stores of value | Households without inflation-protected assets are most exposed |
| Import compression | Goods and services imports estimated to decline 14.8% in 2025/26 | Less supply of consumer and intermediate goods | Domestic shortages amplify price increases beyond exchange-rate pass-through alone | Scarcity premiums are regressive when applied to essential goods |
| Weak consumption growth | Real private consumption estimated at only +0.9% in 2025/26 | Household consumption barely expands despite high nominal spending | Rising nominal expenditure increasingly represents higher prices rather than higher quantities | Signals erosion of real living standards |
| Fiscal stress | Fiscal deficit estimated at 4.4% of GDP in 2025/26 | Limits the ability to compensate households without new financing | Monetary financing risks feeding another inflation round | Broad untargeted subsidies become increasingly expensive and less sustainable |
| Social compensation | IRR10 million electronic voucher for 80 million people | Provides immediate restricted purchasing support | Real value erodes quickly if benefits are not indexed | Breadth is high, but adequacy becomes the critical variable |
| Conflict damage | Infrastructure, production, logistics and health facilities damaged | Physical access to goods and services deteriorates independently of price | Supply constraints magnify monetary inflation | Displaced households and chronically ill patients face additional non-price costs |
Source: Macro Poverty Outlook: Islamic Republic of Iran — World Bank — Apr 2026. Figures for 2025/26 are World Bank estimates rather than final observed annual outcomes.
Inflation is becoming a distribution mechanism rather than merely a price indicator
The distributional importance of a 62.2% inflation rate cannot be understood by treating all components of household expenditure as interchangeable, because an inflation shock is materially more damaging when it is concentrated in necessities that cannot easily be postponed. Iran already displayed this vulnerability well before the current conflict: the World Bank’s earlier detailed CPI analysis, based on Statistical Center of Iran data, showed that food and non-alcoholic beverages represented approximately 27% of the consumer basket, housing and utilities approximately 36%, and transport approximately 9%, meaning that these three categories together accounted for roughly 72% of the index weight in the 2019/20 structure used for that assessment. During that earlier inflation episode, food contributed about 13 percentage points to annual inflation, housing around 6.6 points, and transport around 4.3 points, demonstrating that the categories most difficult for households to avoid had already dominated the inflationary burden. Iran Economic Monitor: Mitigation and Adaptation to Sanctions and the Pandemic — World Bank
Those weights should not be interpreted as the exact 2026 consumption structure, because household expenditure patterns and CPI weights change over time, but they remain analytically useful as a structural baseline showing why food, housing and transport inflation has a much stronger welfare effect than equivalent inflation in non-essential consumer goods. A household can postpone replacing furniture, electronics or an imported vehicle; it cannot indefinitely postpone purchasing calories, heating or cooling its home, commuting to work, paying rent or obtaining prescribed medicines, and this difference means that inflation concentrated in essentials compresses discretionary expenditure more quickly than the headline CPI alone suggests.
The historical evidence also shows that Iranian households adapt by changing quantities and composition rather than simply paying more for the same consumption basket, because the World Bank documented a fall in annual per-capita red-meat consumption from approximately 8.7 kilograms in 2011/12 to 6 kilograms in 2016/17, while chicken consumption rose from 17.6 kilograms to more than 21 kilograms, and it linked the shift to relative-price changes; by 2019/20, food prices had risen by approximately 120% compared with 2016/17, with increases ranging from 73% for bread and cereals to 163% for vegetables. Iran Economic Monitor: Mitigation and Adaptation to Sanctions and the Pandemic — World Bank
The implication for 2026 is significant because the current food shock is much larger than the inflation rate recorded during that earlier adjustment episode, which means household adaptation cannot be assumed to remain confined to benign substitution among comparable foods; as price increases become larger and persist for longer, substitution moves progressively from premium to cheaper products, from animal protein to lower-cost calories, from purchased services to unpaid household labour, and ultimately from consumption smoothing into outright deprivation where budgets are already near subsistence.
Food represents the most immediate transmission point
The World Bank’s February 2026 estimate of 99% year-on-year food inflation means that the cost of a constant food basket had approximately doubled within twelve months, although actual household welfare depends on specific items, local availability and substitution behaviour rather than on the aggregate index alone. Macro Poverty Outlook: Islamic Republic of Iran — World Bank — Apr 2026
The food-price channel is amplified because Iran’s problem is not purely monetary: the World Bank identifies dependency on imported foodstuffs, shipping disruption through the Strait of Hormuz and depletion of strategic reserves as direct food-security risks, meaning that a weaker rial is interacting with physical constraints on the volume and timing of imports rather than simply making an otherwise abundant import flow more expensive. The same assessment records a 4.7% estimated contraction in agricultural output in 2025/26, after severe water shortages had already reduced agricultural activity in 2025, which removes part of the domestic-supply buffer that might otherwise have compensated for imported shortages. Macro Poverty Outlook: Islamic Republic of Iran — World Bank — Apr 2026
Food transmission indicators
| Indicator | 2023/24 | 2024/25 | 2025/26 estimate | Household interpretation |
|---|---|---|---|---|
| Real GDP growth | 5.3% | 3.7% | −2.7% | National income moves from expansion into contraction |
| Agriculture growth | 0.8% | 3.6% | −4.7% | Domestic food-supply capacity deteriorates |
| Imports of goods and services | 1.5% | 2.7% | −14.8% | Imported food and intermediate-input availability becomes more constrained |
| CPI inflation | 41.0% | 40.2% | 49.1% annual-period estimate | Persistent high inflation precedes the sharper February reading |
| February 2026 CPI, y/y | — | — | 62.2% | Current inflation accelerated beyond the annual-period estimate |
| February 2026 food inflation, y/y | — | — | 99% | Essential food prices rise materially faster than headline CPI |
| Upper-middle-income poverty rate, US$8.30/day, 2021 PPP | 36.0% | 33.2% nowcast | 36.2% projection | Welfare gains achieved before the conflict are projected to reverse |
Source: Macro Poverty Outlook: Islamic Republic of Iran — World Bank — Apr 2026. The World Bank notes that 2024/25 is a nowcast and 2025/26 an estimate/projection using its methodology; these values therefore must not be confused with final Iranian national-account releases.
The critical distributional issue is therefore not simply whether food subsidies or vouchers exist, but whether their real value moves at the same speed as food prices. A transfer fixed in nominal rial loses purchasing power extremely rapidly in this environment: using the World Bank’s 62.2% general inflation reading purely as an arithmetic illustration, a fixed nominal transfer would retain only about 61.7% of its initial real purchasing power after one year if prices continued to rise at that rate; using the contemporaneous 99% food inflation rate, a transfer earmarked for food but left unindexed would retain only about 50.3% of its initial food-purchasing power over an equivalent twelve-month change. These are not forecasts of future inflation, but calculations showing why payment frequency and indexation matter as much as the nominal amount of assistance. Macro Poverty Outlook: Islamic Republic of Iran — World Bank — Apr 2026
Real-value erosion of a fixed transfer under observed February 2026 price changes
| Reference price increase | Price index after 12 months if starting at 100 | Remaining purchasing power of an unchanged nominal transfer | Real-value loss |
|---|---|---|---|
| General CPI: 62.2% | 162.2 | 61.7% | 38.3% |
| Food prices: 99.0% | 199.0 | 50.3% | 49.7% |
Calculation: , using the World Bank’s February 2026 year-on-year CPI and food-price inflation observations; the table illustrates the effect of already-observed price changes and does not assume that the same rates will persist. Macro Poverty Outlook: Islamic Republic of Iran — World Bank — Apr 2026
Currency scarcity reaches households before they ever purchase foreign currency
The household relevance of foreign-exchange scarcity extends far beyond Iranians directly buying dollars or euros, because manufacturers, importers, pharmaceutical suppliers, livestock producers, retailers and transport companies all price goods partly according to the cost of replenishing inventories, which means depreciation can enter retail prices even when existing inventories were purchased at a stronger exchange rate. The World Bank attributes the 44% year-on-year currency depreciation observed in early March 2026 to the contraction in exports and limited access to foreign-exchange reserves amid intensified sanctions and conflict, and explicitly links that depreciation together with inflation expectations and the reduction of subsidised exchange-rate allocation to the jump in consumer prices. Macro Poverty Outlook: Islamic Republic of Iran — World Bank — Apr 2026
This transmission operates through at least four distinct pricing mechanisms: imported final goods become directly more expensive; imported components raise the domestic cost of apparently Iranian-produced goods; domestic producers of internationally tradable commodities raise local prices toward their export opportunity cost where regulation permits; and wholesalers increase margins to protect themselves against the higher future cost of replacing inventory. The result is that exchange-rate depreciation can affect bread through imported grain or fertiliser, meat through feed, medicines through active pharmaceutical ingredients and equipment, transport through tyres and spare parts, and housing through construction materials and maintenance inputs, even when the final consumer never purchases an imported finished product.
This is also why the phasing out of a subsidised exchange rate produces a measurable welfare shock even when the previous regime was inefficient, because eliminating an administrative subsidy corrects a price distortion but simultaneously exposes consumers to a previously hidden part of the exchange-rate depreciation. The World Bank notes that Iran had scaled back the subsidised exchange-rate allocation for imports of essential goods in December 2025 and redirected resources toward quasi-universal electronic vouchers, thereby changing the mechanism of protection from subsidising the import price toward compensating the household after the price increase. Macro Poverty Outlook: Islamic Republic of Iran — World Bank — Apr 2026
That shift can improve transparency if transfers reach consumers efficiently and if preferential currency previously generated leakage or arbitrage, but its welfare performance depends on three variables that become particularly demanding under wartime inflation: the transfer must reach the intended population, its nominal amount must be updated rapidly enough to prevent inflation from eroding its value, and essential goods must remain physically available for households to purchase. Cash or electronic purchasing power cannot compensate for an empty market, while abundant goods cannot protect households whose transfers have lost half of their real food value.
Employment is not collapsing at the same speed as purchasing power, which makes real income the more important metric
A distinctive feature of the current Iranian adjustment is that the World Bank does not estimate an employment collapse proportionate to the contraction in output, because the employment rate among the working-age population changes only from 37.9% in 2024/25 to 37.5% in 2025/26, while real GDP moves from +3.7% to −2.7% and inflation remains exceptionally high. Macro Poverty Outlook: Islamic Republic of Iran — World Bank — Apr 2026
This divergence matters because conventional unemployment measures can understate household distress during high inflation: workers can remain formally employed while their wages buy progressively less food, rent, transport and health care, meaning that the relevant welfare deterioration occurs through the real wage rather than job destruction alone. The World Bank explicitly expects high inflation and declining real incomes to suppress domestic demand, which is consistent with private consumption growing only 0.9% in real terms despite very high nominal price increases. Macro Poverty Outlook: Islamic Republic of Iran — World Bank — Apr 2026
The difference between employment stability and household security
| Indicator | 2023/24 | 2024/25 | 2025/26 estimate | Analytical significance |
|---|---|---|---|---|
| Employment rate, working-age population | 37.9% | 37.9% | 37.5% | Limited movement compared with the scale of the macro shock |
| Real private consumption growth | 1.6% | 3.5% | 0.9% | Household demand nearly stalls in real terms |
| Real GDP growth | 5.3% | 3.7% | −2.7% | Economy shifts into contraction |
| Services growth | 4.0% | 3.3% | 0.3% | Labour-intensive activity loses momentum |
| Industry growth | 7.3% | 2.8% | −5.4% | Industrial workers and suppliers face stronger output pressure |
| Agriculture growth | 0.8% | 3.6% | −4.7% | Rural incomes and food supply face simultaneous pressure |
Source: Macro Poverty Outlook: Islamic Republic of Iran — World Bank — Apr 2026.
The table shows why monthly wages must be evaluated against the cost of a constant essential-consumption basket rather than reported in isolation, because a nominal wage increase of 30%, 40% or even 50% can represent a real wage cut when food prices rise by 99%. The current official record retrieved for this chapter does not provide a sufficiently authoritative and internally consistent 2026 statutory wage series by worker category to calculate a certified wage-to-essential-basket ratio, so the more aggressive wage-gap figures circulating in Iranian media are not incorporated into the controlling assessment.
Housing transmits inflation differently because households cannot substitute rapidly
Housing creates a different form of wartime exposure because renters cannot respond to a sudden increase in housing costs simply by consuming a smaller quantity of housing each month without moving, sharing accommodation or accepting lower quality, while owner-occupiers remain exposed through maintenance, utilities and foregone purchasing power. Historical Iranian CPI composition is therefore important: housing and utilities represented roughly 36% of the CPI basket in the World Bank’s 2019/20 analysis, making it the largest single expenditure group in that historical weighting system. Iran Economic Monitor: Mitigation and Adaptation to Sanctions and the Pandemic — World Bank
The principal household vulnerability is the interaction between rent and general inflation rather than a single official rent index, because a renter whose wage is losing purchasing power faces simultaneous increases in food and transportation expenditure before negotiating a lease renewal, so the effective affordability threshold deteriorates even if rent rises more slowly than food. Measures limiting nominal rent increases can moderate this channel only when contracts are enforceable and supply remains available, because strict caps without sufficient rental supply can induce side payments, reduced maintenance or withdrawal of housing from the formal market; conversely, unrestricted repricing can transfer a large portion of the inflation shock immediately to tenants.
The supplied evidence correctly identifies housing as an area in which Iranian authorities have already accepted emergency intervention in principle, but the exact 25% annual ceiling described in the user-provided source rests on a secondary source rather than on a controlling regulation retrieved during this session, and it is therefore not treated here as an independently verified nationwide current rule. The broader analytical point remains supportable: housing is a high-weight, low-substitutability expenditure category, which makes enforcement quality and supply response at least as important as the nominal ceiling imposed on rent increases.
Transport acts as an inflation multiplier because fuel is both household consumption and production input
Transport expenditure has a dual role that food and housing do not fully share, because households purchase transport directly while almost every physical good also incorporates freight, distribution and worker-mobility costs. Iran has long used low administered gasoline prices as both a social subsidy and an implicit subsidy to commercial activity, but this system transfers part of the fiscal and foreign-exchange cost of transport from consumers to the state, creates incentives for excessive consumption and cross-border arbitrage, and becomes increasingly difficult to sustain when export earnings and accessible foreign exchange fall.
The World Bank records that the government reduced the quantity of gasoline available at existing subsidised prices in November 2025 and introduced a higher price tier for additional demand, explicitly describing the measure as part of an attempt to reduce fiscal and foreign-exchange pressure associated with gasoline overconsumption. Macro Poverty Outlook: Islamic Republic of Iran — World Bank — Apr 2026
The September 2026 claim supplied in the underlying source concerning a 110-litre threshold and a 100,000-rial-per-litre third-tier price has not been independently verified from an accessible first-order government record during this research session, so it should remain outside the certified quantitative baseline until the underlying decree, National Iranian Oil Products Distribution Company notice or other authoritative record is retrieved. The mechanism, however, is clear: once additional fuel costs reach freight operators, taxis, delivery services and small enterprises, the effective incidence extends beyond the households directly purchasing fuel above the threshold, because businesses incorporate higher operating costs into final prices.
Medicines expose households to both price risk and availability risk
The medical channel is qualitatively more severe because the relevant household burden cannot always be measured by CPI: a medicine whose price doubles creates an affordability problem, whereas a medicine that disappears from the market creates an access failure for which income compensation alone may not be sufficient. WHO reported in April 2026 that health partners were warning of looming medicine shortages and restricted access to health services in Iran, linked to the consequences of the conflict and damage to health and manufacturing facilities, while WHO itself was procuring medical supplies, including commodities for non-communicable diseases, some of which had to be sourced from abroad. Middle East Conflict Global Situation Report — World Health Organization — Apr 2026
WHO had already verified 26 attacks on health care between 28 February and 4 April 2026, resulting in 11 health-worker deaths, and was procuring generators, uninterrupted-power systems, trauma supplies and essential medicines for affected facilities, including medicines for chronic diseases; a separate WHO situation report recorded damage to a pharmaceutical facility in Tehran that produced medicines for cancer and multiple sclerosis. Middle East Situation Report — WHO Regional Office for the Eastern Mediterranean — Apr 2026 Middle East Situation Report — WHO Regional Office for the Eastern Mediterranean — Apr 2026
The health burden therefore contains at least four household transmission channels that conventional inflation measurement only partially captures: imported pharmaceuticals become more expensive when the rial depreciates; imported active ingredients and specialised equipment raise the cost of domestically manufactured treatment; damaged facilities create geographic access constraints even where medicines remain nationally available; and electricity, cold-chain and logistics disruption threatens continuity for products whose therapeutic value depends on uninterrupted storage or repeated dosing.
WHO describes the regional consequences in particularly concrete terms, noting that patients requiring dialysis, insulin or other life-sustaining treatments have encountered greater difficulty obtaining care since the escalation, while disruption to airspace and maritime routes has affected movement of medical supplies and equipment. Middle East Conflict — World Health Organization
UNICEF provides an additional measure of the resulting civilian-service burden inside Iran: by August 2026, its support to the government’s emergency response included essential health services reaching more than 2.1 million people, more than 2 million vaccine doses and cold-chain services, water and sanitation assistance reaching more than one million children and parents, and protection or mental-health services for 12,467 children. These figures describe humanitarian support delivered rather than the total number of people in need, but the scale confirms that the household impact of conflict extends well beyond retail prices into continuity of basic public services. Supporting Children and Families During the 2026 Conflict in Iran — UNICEF Iran — Aug 2026
Household health transmission
| Mechanism | Verified evidence | Household consequence |
|---|---|---|
| Health-facility damage | WHO verified attacks affecting Iranian health care | Reduced local treatment capacity and longer travel or waiting times |
| Pharmaceutical production disruption | WHO reported damage to a Tehran facility producing cancer and multiple-sclerosis medicines | Greater supply vulnerability for high-value specialised drugs |
| Imported medical inputs | WHO April report states NCD commodities were being sourced primarily from abroad | Exchange-rate and international-logistics exposure remains material |
| Power-system vulnerability | WHO procured generators and UPS systems for affected facilities | Continuity of ICU, diagnostic and cold-chain services depends on infrastructure resilience |
| Logistics disruption | Airspace and maritime restrictions affected medical-supply movement | Delays can become shortages even where financing exists |
| Large emergency-service requirement | UNICEF health assistance reached more than 2.1 million people | Conflict generates non-price welfare losses alongside inflation |
Sources: WHO Middle East Conflict Situation Report — Apr 2026, WHO EMRO Situation Report — Apr 2026, UNICEF Iran Emergency Response — Aug 2026.
The compensation problem is one of timing as much as generosity
Iran’s electronic voucher programme is economically important because it attempts to move support directly toward household consumption instead of subsidising all units of an imported commodity irrespective of recipient income, but its effectiveness depends on the relationship between three clocks that are currently moving at different speeds: retail prices can change daily or weekly, wages usually adjust much less frequently, and public transfers are set administratively and therefore risk being recalibrated only after a substantial real-income loss has already occurred.
The World Bank’s April 2026 record gives an unusually clear example, because the government offered IRR10 million per person to approximately 80 million citizens for selected food staples after food inflation had reached 99% year on year, and the Bank explicitly concluded that the credit would only partially offset the welfare impact of the price shock. Macro Poverty Outlook: Islamic Republic of Iran — World Bank — Apr 2026
The scale of coverage is therefore not equivalent to adequacy, because a near-universal programme can reach most households while still replacing only a small proportion of their purchasing-power loss, and a narrowly targeted programme can provide more protection per recipient while excluding households whose incomes have recently collapsed but whose administrative classification has not yet changed. The central design problem is consequently to combine broad enough coverage to catch newly vulnerable households with sufficient differentiation to direct greater resources toward those whose budgets are dominated by essentials.
What a transfer system must offset under high inflation
| Design variable | Why it matters under current Iranian conditions | Failure mode |
|---|---|---|
| Nominal benefit level | Determines immediate quantity of staples purchasable | Benefit is symbolically large but materially insufficient |
| Indexation frequency | Food prices are changing much faster than normal annual administrative cycles | Benefit loses real value between revisions |
| Eligibility updating | Conflict and inflation can change household income rapidly | Newly poor households remain outside the programme |
| Geographic adjustment | Supply constraints and transport costs vary across provinces | National nominal benefit buys different quantities in different areas |
| Product coverage | Restricted vouchers protect only listed items | Households must finance medicine, housing and transport losses elsewhere |
| Retail supply | Purchasing power is useful only when goods are available | Voucher demand encounters shortages and pushes informal-market premiums higher |
| Financing method | Determines whether compensation generates additional fiscal or monetary pressure | Monetary financing recreates part of the inflation being compensated |
| Fraud and leakage control | Scarce fiscal resources have unusually high opportunity cost | Resources migrate toward intermediaries rather than vulnerable households |
The implication is not that cash or vouchers are ineffective, but that transfers operating in a near-100% food-inflation environment require substantially tighter indexation, targeting and supply coordination than the same programme would require under single-digit inflation.
Poverty is beginning to reverse before employment collapses
The World Bank estimates that the share of the Iranian population below its US$8.30 per day upper-middle-income poverty benchmark, measured in 2021 purchasing-power parity, declined from 36.0% in 2023/24 to an estimated 33.2% in 2024/25, but is projected to increase again to 36.2% in 2025/26, almost fully reversing the preceding improvement within a single year. Macro Poverty Outlook: Islamic Republic of Iran — World Bank — Apr 2026
The lower-middle-income poverty threshold shows the same reversal, moving from 7.5% in 2023/24 to 6.3% in 2024/25 and back to 7.5% in 2025/26, while extreme poverty at the World Bank’s US$3.00-a-day 2021 PPP line rises from 2.0% to 2.5% in the final year of the series. These are model-based World Bank projections rather than contemporaneous household-survey observations, and they should therefore be interpreted as the direction and approximate magnitude of the welfare reversal rather than as a precise real-time headcount. Macro Poverty Outlook: Islamic Republic of Iran — World Bank — Apr 2026
Poverty reversal across three thresholds
| Poverty measure | 2023/24 | 2024/25 nowcast | 2025/26 projection | Change from 2024/25 to 2025/26 |
|---|---|---|---|---|
| International poverty line, US$3.00/day, 2021 PPP | 2.5% | 2.0% | 2.5% | +0.5 pp |
| Lower-middle-income line, US$4.20/day, 2021 PPP | 7.5% | 6.3% | 7.5% | +1.2 pp |
| Upper-middle-income line, US$8.30/day, 2021 PPP | 36.0% | 33.2% | 36.2% | +3.0 pp |
Source: Macro Poverty Outlook: Islamic Republic of Iran — World Bank — Apr 2026.
The important analytical point is that Iran can experience a major increase in household hardship without a proportionate change in the employment rate, because inflation destroys the purchasing power of employment income, which means the policy question must extend beyond job preservation to preservation of the real consumption that wages can command.
Fiscal protection is becoming more difficult precisely when households need more of it
The deterioration in household welfare is occurring at the same time as the government’s capacity to offset it is weakening, because the World Bank estimates that Iran’s fiscal deficit widened from 2.7% of GDP in 2023/24 to 3.8% in 2024/25 and 4.4% in 2025/26, while revenue declined from 9.6% to 9.4% and then 9.3% of GDP and public debt increased from 25.4% of GDP in 2024/25 to an estimated 31.3% in 2025/26. Macro Poverty Outlook: Islamic Republic of Iran — World Bank — Apr 2026
Fiscal capacity versus household-support pressure
| Indicator | 2023/24 | 2024/25 | 2025/26 estimate | Direction of pressure |
|---|---|---|---|---|
| Fiscal balance | −2.7% GDP | −3.8% | −4.4% | Less room for uncompensated support |
| Government revenue | 9.6% GDP | 9.4% | 9.3% | Revenue base weakens relative to needs |
| Public debt | 26.1% GDP | 25.4% | 31.3% | Financing burden rises |
| Primary balance | −2.4% GDP | −3.3% | −3.8% | Deficit persists before interest costs |
| Government consumption growth | −0.6% | 3.8% | 0.6% | Limited real expansion despite emergency pressures |
| Inflation | 41.0% | 40.2% | 49.1% annual estimate; 62.2% Feb y/y | Nominal fiscal expenditure rapidly loses real purchasing power |
Source: Macro Poverty Outlook: Islamic Republic of Iran — World Bank — Apr 2026.
This creates a classic high-inflation fiscal trap in which households demand greater compensation precisely when every nominal rial of compensation buys less and the government has fewer non-inflationary financing options available. If the state finances compensation through monetary expansion, it can partially restore purchasing power today while increasing aggregate nominal demand and inflation pressure later; if it cuts transfers, the adjustment moves immediately into household consumption; if it increases taxation broadly, disposable income falls through another channel; if it borrows domestically, it competes with private borrowers and creates future debt-service obligations.
The distributional question therefore becomes inseparable from expenditure prioritisation, because scarce fiscal resources spent on poorly targeted subsidies, low-priority capital projects or non-essential import support have a larger opportunity cost than they would under normal macroeconomic conditions. The relevant wartime test is not whether the state intervenes, because Iran already intervenes extensively, but whether each unit of fiscal and foreign-exchange capacity is being directed toward preventing the largest welfare losses per rial spent.
Iran’s household vulnerability differs from Israel and Europe primarily in the transmission architecture
The comparative lesson from Israel and Europe is not that their households escape wartime or geopolitical shocks, but that a much larger portion of the initial shock is absorbed before it becomes broad household inflation. In Iran, external revenue loss is transmitted through a depreciating currency, restricted access to reserves, import compression and high pre-existing inflation; in Israel, emergency fiscal spending and banking-sector measures transfer part of the immediate burden onto the sovereign balance sheet and the financial system, while European countries can absorb energy shocks through functioning wholesale markets, strong currencies, fiscal transfers and monetary systems that retain price credibility.
The most useful comparison is therefore institutional rather than simply numerical.
| Shock absorber | Iran | Israel | EU / major European economies | Household consequence |
|---|---|---|---|---|
| Currency stability | Severe depreciation pressure | Floating but institutionally anchored currency | Euro or sterling with deep financial markets | Iran receives stronger imported-inflation pass-through |
| External payment access | Restricted by sanctions and financial isolation | Broad international access | Broad international access | Iran faces scarcity as well as higher price |
| Fiscal-market access | Predominantly domestic and constrained | Deep domestic and international financing capacity | Deep sovereign-debt markets | Israel/EU can spread wartime costs over time more readily |
| Monetary credibility | Persistent high inflation | Inflation-targeting central bank | Inflation-targeting central banks | Nominal compensation survives longer in real terms outside Iran |
| Emergency household credit | More limited and less transparent in public record | Formal loan-deferral programmes implemented | Multiple national social-protection and credit mechanisms | Liquidity shocks can be delayed or socialised outside Iran |
| Import diversification | Trade concentrated through constrained corridors and sanction-compatible partners | Broad market access | Large integrated market and diversified supply | Physical scarcity is more likely to accompany inflation in Iran |
| Welfare indexation requirement | Extremely high because of rapid inflation | Lower | Lower | Iranian transfers require more frequent recalibration |
| Medicine logistics | Sanctions, exchange-rate and conflict exposure | International procurement access maintained despite war | Integrated pharmaceutical markets | Iranian patients face combined affordability and availability risk |
The comparison therefore identifies the decisive difference in burden transmission: Iranian households absorb the shock through prices and scarcity much earlier in the adjustment process, whereas richer and financially integrated economies can move a larger part of the shock onto government borrowing, regulated utilities, insurers, banks or future taxation before it appears as an immediate reduction in household consumption.
The most important household indicators are now leading indicators of economic resilience
The strongest early warning signal is not the headline CPI alone but the relationship between food inflation and nominal household compensation, because a widening gap indicates that lower-income households are losing nutritional purchasing power even if aggregate consumption has not yet collapsed. A second indicator is the quantity of essential imports, especially medicines, animal feed, grain and pharmaceutical inputs, because stable retail prices achieved through administrative controls are not sustainable if physical supply is falling. A third is the share of fiscal compensation financed through money creation, because the short-term welfare gain from transfers becomes self-eroding if financing accelerates inflation. A fourth is the poverty trajectory at the US$8.30 upper-middle-income threshold, which captures movement among households that are not destitute but remain highly vulnerable to sudden cost-of-living shocks.
The available official record already shows movement in all four directions: food inflation reached 99%, imports are estimated to have contracted 14.8%, monetary financing is explicitly identified by the World Bank as part of the expected deficit-financing mix, and the upper-middle-income poverty rate is projected to rise from 33.2% to 36.2% within one year. Macro Poverty Outlook: Islamic Republic of Iran — World Bank — Apr 2026
Key judgments
The evidence supports the judgment that the dominant household transmission mechanism is now a combined price-and-scarcity shock, because depreciation and inflation are reducing purchasing power at the same time that declining imports, conflict damage and logistical constraints reduce the physical availability of essential goods; this configuration is materially more dangerous to welfare than inflation generated solely by excess domestic demand, because stabilising prices requires restoring both nominal stability and supply.
Food remains the most consequential immediate channel because the February 2026 annual increase of 99% is substantially above headline inflation, while contracting agricultural output and import disruption reduce the scope for households to escape price increases by shifting between domestic and imported products. Macro Poverty Outlook: Islamic Republic of Iran — World Bank — Apr 2026
The health channel carries a lower measurable CPI footprint but potentially higher welfare severity because WHO has documented attacks on health infrastructure, pharmaceutical-production disruption and risks to essential-medicine supply, meaning that some household losses take the form of unavailable treatment rather than merely higher expenditure. Middle East Conflict Global Situation Report — World Health Organization — Apr 2026
The welfare system is cushioning rather than neutralising the shock, because the government’s broad electronic-voucher programme reaches most of the population but operates against inflation rates capable of eroding between roughly two-fifths and one-half of the real value of an unindexed nominal transfer over a twelve-month price movement of the magnitude already observed in February 2026. Macro Poverty Outlook: Islamic Republic of Iran — World Bank — Apr 2026
The present data also indicate that real-income erosion is more informative than unemployment alone, because the employment rate remains comparatively stable while inflation, poverty and real consumption deteriorate, creating a class of households that remain economically active but progressively less able to finance basic consumption.
What would change the assessment
The assessment would strengthen materially if Iranian authorities released a monthly distributional dataset linking CPI by expenditure category to wage deciles, pension payments, electronic-voucher coverage and household expenditure, because this would allow direct measurement of the real-income loss across income groups instead of inferring distributional effects from aggregate inflation and poverty estimates.
It would weaken if subsequent verified data showed that food inflation had fallen sharply while essential-import volumes recovered, the rial stabilised for a sustained period, electronic-transfer values were indexed sufficiently to preserve real purchasing power, and projected poverty deterioration failed to materialise.
A durable recovery in pharmaceutical availability, agricultural production and imported food inputs would also weaken the scarcity component of the assessment even if headline inflation remained elevated, whereas further decline in essential import volumes, interruptions to medicine production or evidence of continued depletion of strategic food stocks would strengthen it.
Open official record
The most consequential missing records are a current Statistical Center of Iran expenditure-weight table and detailed 2026 CPI series by decile, the legally operative 2026 minimum-wage schedule by worker category, the monthly real value and coverage of the electronic voucher programme, current rent and housing-cost statistics, the official September 2026 gasoline pricing decision and consumption thresholds, pharmaceutical import and shortage data from the Ministry of Health and Food and Drug Administration, and monthly foreign-exchange allocation by essential and non-essential import category. Until those records are available and independently retrievable, precise claims concerning current wage sufficiency, rent ceilings, individual bread-price increases or the incidence of the newest gasoline tier should remain separated from the certified quantitative baseline rather than being inferred from secondary reporting.
Iran’s Household Transmission Mechanism: From Foreign-Exchange Scarcity to Food, Housing, Transport and Medicine
Principal judgment. Iran’s household crisis is no longer adequately described as a conventional inflation episode. The available evidence indicates a multi-stage compression mechanism in which foreign-exchange scarcity, currency depreciation, reduced subsidised exchange-rate access, import contraction, fiscal deterioration, high inflation and conflict-related supply disruption are operating simultaneously. The resulting household shock is asymmetric because lower-income households cannot defer food, rent, transport or medicines in the same way that higher-income households can postpone discretionary consumption.
Inflation is functioning as a distribution mechanism
The loss of household purchasing power is being intensified by physical scarcity. Prices rise because the rial buys less, but also because imports, domestic production and logistics are being disrupted simultaneously.
Transmission channels from sovereign stress to household welfare
| Channel | Verified evidence | Immediate effect | Secondary effect | Distributional significance |
|---|---|---|---|---|
| FX contraction | Reduced access to reserves under sanctions, conflict and weaker exports | Imported essentials cost more | Rationing and higher replacement pricing | High exposure for medicine and import-intensive essentials |
| Currency depreciation | 44% y/y | Lower import purchasing power | Repricing spreads into domestic goods | Fixed wages and transfers lose real value |
| Subsidised FX withdrawal | Reduced preferential FX allocation for essentials | Protected prices move toward replacement cost | Food-chain propagation | Regressive where food shares are high |
| Food inflation | 99% y/y | Essentials absorb more disposable income | Dietary substitution and lower diversity | Strongest effect on lower-income households |
| General inflation | 62.2% y/y | Real value of wages and savings falls | Precautionary consumption and asset substitution | Households without inflation hedges most exposed |
| Import compression | −14.8% | Reduced supply of goods and inputs | Scarcity premiums exceed FX pass-through | Regressive where scarcity concerns necessities |
| Fiscal stress | 4.4% GDP deficit | Reduced room for support | Monetary financing may reinforce inflation | Untargeted subsidies become less sustainable |
| Social compensation | IRR10m voucher for 80m people | Immediate purchasing support | Rapid erosion without indexation | Coverage high; adequacy uncertain |
Why inflation in necessities has disproportionate welfare impact
Supply contraction is amplifying the price shock
| Indicator | 2023/24 | 2024/25 | 2025/26 est. | Household interpretation |
|---|---|---|---|---|
| Real GDP growth | 5.3% | 3.7% | −2.7% | National income moves into contraction |
| Agriculture growth | 0.8% | 3.6% | −4.7% | Domestic food buffer deteriorates |
| Imports of goods & services | 1.5% | 2.7% | −14.8% | Imported inputs and food availability tighten |
| Annual-period CPI | 41.0% | 40.2% | 49.1% | High inflation persists before February acceleration |
| February CPI y/y | — | — | 62.2% | Current inflation above annual-period estimate |
| February food inflation y/y | — | — | 99% | Essential prices outpace headline CPI |
| US$8.30/day poverty | 36.0% | 33.2% | 36.2% | Prior welfare gains reverse |
Why nominal compensation can lose effectiveness rapidly
Employment stability is not equivalent to household security
| Indicator | 2023/24 | 2024/25 | 2025/26 est. | Interpretation |
|---|---|---|---|---|
| Employment rate | 37.9% | 37.9% | 37.5% | Small movement despite large macro shock |
| Private consumption growth | 1.6% | 3.5% | 0.9% | Real household demand nearly stalls |
| Industry growth | 7.3% | 2.8% | −5.4% | Stronger output pressure for industrial workers |
| Agriculture growth | 0.8% | 3.6% | −4.7% | Rural incomes and food supply weaken together |
Medicine combines affordability risk with availability risk
Household hardship can intensify before employment collapses
| Poverty threshold | 2023/24 | 2024/25 nowcast | 2025/26 projection | Change |
|---|---|---|---|---|
| US$3.00/day • 2021 PPP | 2.5% | 2.0% | 2.5% | +0.5 pp |
| US$4.20/day • 2021 PPP | 7.5% | 6.3% | 7.5% | +1.2 pp |
| US$8.30/day • 2021 PPP | 36.0% | 33.2% | 36.2% | +3.0 pp |
The state’s compensatory capacity is weakening as household needs increase
Iran, Israel and Europe absorb shocks at different points in the system
| Shock absorber | Iran | Israel | EU / major Europe | Household consequence |
|---|---|---|---|---|
| Currency stability | Severe depreciation pressure | Institutionally anchored float | Euro / sterling, deep markets | Higher imported-inflation pass-through in Iran |
| External payment access | Restricted | Broad | Broad | Iran faces scarcity as well as higher price |
| Fiscal market access | Predominantly domestic / constrained | Deep financing capacity | Deep sovereign markets | Richer systems can spread costs over time |
| Emergency household credit | Less transparent in public record | Formal loan deferrals | Multiple social / credit mechanisms | Liquidity shocks can be delayed outside Iran |
| Import diversification | Constrained corridors | Broad market access | Large integrated market | Physical scarcity more likely in Iran |
| Medicine logistics | FX + sanctions + conflict exposure | International procurement access | Integrated pharmaceutical markets | Iran faces combined affordability / availability risk |
Six controlling judgments
The dominant household mechanism is now a combined price-and-scarcity shock rather than inflation alone.
Food is the most consequential immediate channel because 99% inflation is interacting with weaker agricultural output and import contraction.
Medicine may have a smaller CPI footprint but a higher welfare severity because availability failure cannot be solved by nominal income alone.
The electronic-voucher programme cushions rather than neutralises the shock because its real value can erode rapidly between administrative revisions.
Real-income erosion is more informative than unemployment alone because employment changes little while consumption and poverty indicators deteriorate.
Fiscal protection is becoming harder precisely when households require more support, creating a high-inflation compensation trap.
Data required to move from inference to direct measurement
- Current Statistical Center of Iran CPI weights and decile-level 2026 expenditure series.
- Legally operative minimum-wage schedule by worker category.
- Monthly voucher value, coverage, take-up and indexation.
- Current rent and housing-cost statistics.
- Official gasoline pricing decision and consumption thresholds.
- Pharmaceutical import, shortage and inventory data.
- Monthly FX allocation by essential and non-essential import category.
Leading indicators of household resilience
Comparative Resilience
Principal judgment
The central comparative finding is that Israel, the European Union, Italy, France, Germany and the United Kingdom are not escaping the economic consequences of the Iran conflict; they are absorbing those consequences through institutional channels that prevent a large external energy and security shock from becoming a generalised collapse in household purchasing power, because currencies remain credible, central banks retain operational control over inflation expectations, governments can borrow in deep domestic or international capital markets, banking systems continue intermediating credit, social-protection mechanisms can be modified without immediate monetisation of fiscal deficits, and energy systems possess substantially greater supplier diversification and substitution capacity than an economy operating under severe financial and trade restrictions.
The distinction is visible in the composition rather than merely the level of inflation, because euro-area inflation reached 3.2% in August 2026, yet the inflation rate excluding energy remained 2.1%, while food, alcohol and tobacco increased by only 1.1% and energy alone contributed 1.29 percentage points to the headline rate, which indicates a substantial external energy-price shock that has not yet propagated into a self-reinforcing increase across the entire consumption basket. Eurostat — Annual inflation up to 3.2% in the euro area, September 2026
That separation between headline and underlying inflation represents the first major resilience advantage, because when energy prices rise but food, services, wages and non-energy manufactured goods remain comparatively contained, authorities are responding to a relative-price shock rather than to a breakdown in the unit of account itself, whereas an economy in which energy, food, imports, wages, exchange rates and inflation expectations rise together faces a much more difficult stabilisation problem.
The European shock is large, but it remains concentrated
The latest European data demonstrate that the Middle Eastern conflict is economically material rather than peripheral, because euro-area energy inflation accelerated to approximately 14% in August, overall HICP inflation rose from 2.9% in July to 3.2% in August, and energy's contribution to headline inflation increased from 0.94 percentage points in July to 1.29 percentage points in August, yet inflation excluding energy actually declined from 2.2% to 2.1%, demonstrating that the second-round transmission into the rest of the consumer basket remained limited at the latest observation.
This pattern is analytically important because the ability to isolate an energy shock from underlying inflation gives monetary and fiscal authorities considerably more room to respond: temporary support can be concentrated on energy-intensive households and firms, monetary policy does not have to react as though every price category were accelerating simultaneously, and governments can allow relative prices to convey scarcity without allowing the shock to become embedded in expectations, wages and contracts.
European inflation anatomy after the Middle East energy shock
| Euro-area indicator | Jul 2026 | Aug 2026 | Change | Analytical meaning |
|---|---|---|---|---|
| Headline HICP | 2.9% | 3.2% | +0.3 pp | External shock visibly reaches consumers |
| HICP excluding energy | 2.2% | 2.1% | −0.1 pp | No broad acceleration outside energy |
| Core HICP excluding energy, food, alcohol and tobacco | 2.5% | 2.4% | −0.1 pp | Underlying inflation remains contained |
| Food, alcohol and tobacco | 1.2% | 1.1% | −0.1 pp | Essential-food inflation remains limited |
| Energy contribution to headline inflation | 0.94 pp | 1.29 pp | +0.35 pp | Energy explains a growing share of headline inflation |
| Services contribution | 1.55 pp | 1.43 pp | −0.12 pp | Domestic service inflation is not accelerating alongside energy |
| EU unemployment | 6.1% | July observation | broadly stable | Energy shock has not produced immediate labour-market dislocation |
| Euro-area unemployment | 6.4% | July observation | broadly stable | Employment remains an important shock absorber |
Sources: Eurostat — August 2026 inflation data and Eurostat — July 2026 unemployment data.
The same distinction appears in labour markets, because Eurostat estimated 13.516 million unemployed people in the EU and 11.264 million in the euro area in July 2026, with unemployment rates of 6.1% and 6.4% respectively, broadly unchanged from June, while youth unemployment declined slightly; the geopolitical shock is therefore increasing consumer energy costs without simultaneously producing an economy-wide employment collapse.
Europe’s first structural advantage is that the shock is entering through energy, not through the currency
The European economies are highly exposed to imported energy, but they are not simultaneously experiencing a collapse in the external value of the currency used to purchase those imports, which fundamentally changes the transmission mechanism because an increase in the dollar price of crude oil affects the energy component without automatically repricing every imported intermediate good through a second exchange-rate shock.
Eurostat estimates that the EU produced approximately 43% of its own energy in 2024 and imported 57%, while petroleum products represented about 67% of energy imports, natural gas 24%, solid fossil fuels 4%, electricity 3% and renewables 2%; this represents considerable external dependence, but the import structure is geographically diversified, with the United States supplying approximately 16% of oil and petroleum imports, Norway 12%, Kazakhstan 9%, Saudi Arabia 8%, and the United Kingdom and Libya around 6% each, while gas imports were led by Norway at 30%, the United States at 17%, and Algeria and Russia at roughly 14% each. Eurostat — Energy in Europe 2026
The strategic significance of this diversification is greater than the aggregate import-dependency ratio suggests, because an economy can be highly dependent on imported energy yet remain relatively resilient if cargoes can be redirected among suppliers, storage can bridge short interruptions, pipeline gas can substitute partly for LNG or vice versa, electricity can substitute for fossil fuels in selected uses, and financial markets remain available to pay higher import bills without generating an immediate balance-of-payments crisis.
The EU consequently spent more for energy after the conflict escalated, but the Commission estimated in April that the bloc had already paid approximately €24 billion in additional energy-import costs since the Middle East escalation without receiving additional physical energy, demonstrating that Europe's first line of adjustment has been a deterioration in its external energy bill rather than a breakdown in basic commodity availability.
Europe’s second advantage is deliberate fiscal absorption
The European Commission calculated that fiscal measures already adopted or credibly announced by Member States in response to the 2026 energy-price shock amounted to approximately €14.5 billion, equivalent to roughly 0.07% of EU GDP, using information available up to 4 May 2026; if those programmes had been extended across the full year at the same parameters, the Commission estimated the cost could rise to approximately €38.6 billion, or 0.2% of EU GDP. European Commission — Policy measures in EU Member States to address the 2026 energy price shock
The absolute size of the programme is less important than its financing mechanism, because Member States can temporarily increase expenditure, reduce energy taxes or regulate household tariffs while financing the resulting fiscal cost through taxation, sovereign borrowing and budget reallocations rather than through immediate monetary financing, which allows governments to shift part of the shock from current household income onto the public balance sheet and therefore spread the adjustment across taxpayers and future fiscal periods.
The Commission nevertheless warned that most of the measures identified in its spring assessment were not specifically targeted at vulnerable households or energy-intensive companies, which means European resilience is not costless and can itself generate inefficiency when broad subsidies preserve demand, weaken incentives to conserve energy or provide large transfers to households that do not require protection; for this reason, the Commission's AccelerateEU framework explicitly calls for support to be targeted, temporary and timely, while maintaining incentives for demand reduction.
Where the first shock is absorbed
| Economic layer | Iran-type constrained system | EU / major European economies | Consequence for households |
|---|---|---|---|
| Higher global oil price | Imported through FX scarcity and import cost | Imported primarily as relative energy-price shock | European transmission initially narrower |
| Financing higher import bill | Limited by sanctions and hard-currency availability | Deep euro and sterling financial markets | External payment capacity remains intact |
| Household energy protection | Constrained by inflation and fiscal financing | Temporary taxes, transfers, caps and subsidies | Part of current cost shifted to public budget |
| Business liquidity | Restricted or expensive credit environment | Functioning commercial and central-bank-supported credit markets | Firms have greater capacity to bridge temporary cost spikes |
| Exchange-rate effect | Can magnify the commodity shock | Euro and sterling remain widely convertible reserve currencies | Imported inflation does not automatically spread across entire import basket |
| Public borrowing | More limited and inflation-sensitive | Large sovereign-debt markets | Adjustment can be distributed intertemporally |
| Monetary anchor | High inflation weakens nominal anchor | Explicit inflation-targeting architecture remains credible | Wage and price expectations remain better contained |
| Supply diversification | Sanction-compatible routes constrained | Multiple oil, LNG, pipeline and electricity suppliers | Lower probability that price shock becomes generalized scarcity |
Energy diversification has reduced Europe’s vulnerability even though dependency remains high
The European energy system remains structurally dependent on imports, but it has materially changed supplier concentration since the 2022 energy crisis, because Eurostat records that Russia's share of EU solid-fuel imports fell from 46.7% in 2019 to just 0.4% in 2024, while the United States and Norway became major oil and gas suppliers and LNG infrastructure expanded across multiple entry points.
The diversification process matters because resilience is determined not simply by whether energy is imported but by how substitutable suppliers and routes are, and the EU imported approximately €375.9 billion of energy products in 2024, while the volume of imported LNG fell by 15.1% compared with 2023 and gaseous natural-gas imports declined by 4.4%, indicating that reduced demand, inventories, renewable deployment and domestic generation had already lowered part of the physical import requirement before the 2026 shock.
Electricity-sector diversification provides an additional buffer, because renewables generated 47.2% of EU electricity in 2025, nuclear power generated 23.2%, and fossil fuels accounted for approximately 29.6%, which means roughly seven-tenths of electricity generation came from sources that are not directly dependent on continuous combustion of imported fossil fuel.
This does not eliminate exposure because marginal electricity prices, gas-fired generation, transportation fuels and industrial feedstocks still transmit global fossil-fuel prices across the economy, but it reduces the amount of additional imported fuel required for each unit of economic activity and allows governments to respond to oil and gas shocks without confronting an immediate nationwide energy-availability problem.
Italy: high import exposure, strong energy pass-through, limited second-round inflation
Italy represents one of the most instructive European cases because its energy system is comparatively exposed to imported natural gas, yet August inflation shows that the shock remained highly concentrated in energy rather than spreading broadly through domestic prices.
Istat reported headline national inflation of 3.3% in August 2026, up from 2.9% in July, driven principally by regulated energy prices rising 18.6% year on year and non-regulated energy prices rising 17.0%, while core inflation excluding energy and unprocessed food actually declined to 1.5%, inflation excluding energy stood at 1.7%, and the grocery and unprocessed-food basket increased by only 0.9%. Istat — Consumer prices, August 2026
This divergence is particularly significant because Italy's energy composition remains structurally gas-intensive: Eurostat's 2024 energy data show that natural gas represented approximately 36% of Italy's available energy, among the highest shares in the Union, while gas accounted for approximately 37% of Italy's imported-energy profile, which makes Italy intrinsically sensitive to Middle Eastern and global gas-price shocks.
Yet the Italian inflation structure demonstrates that high physical energy dependence does not automatically produce generalized inflation when currency stability, regulated tariff systems, diversified gas procurement and fiscal measures prevent the initial commodity-price increase from simultaneously destabilising food, services and wages.
Italy: August 2026 transmission profile
| Indicator | Annual change | Resilience interpretation |
|---|---|---|
| NIC headline CPI | 3.3% | Overall inflation accelerated |
| HICP | 2.9% | Harmonised inflation remained below national NIC measure |
| Regulated energy | 18.6% | Strong direct energy shock |
| Non-regulated energy | 17.0% | Market-priced energy transmits external shock |
| Core inflation | 1.5% | Domestic second-round effects remain restrained |
| CPI excluding energy | 1.7% | Most non-energy prices remain comparatively stable |
| Grocery and unprocessed food | 0.9% | Essential food basket largely insulated from energy spike |
| Unprocessed food | 3.8% | Some fresh-food pressure remains |
| Transport services | 0.8% | Energy shock has not translated mechanically into service inflation |
Source: Istat — Consumer prices, August 2026.
The structural weakness for Italy lies not in current inflation transmission but in the fiscal cost of repeatedly absorbing energy shocks, because a high-debt sovereign has less freedom than fiscally stronger states to convert every external price increase into permanent consumer support; Italian resilience therefore depends increasingly on temporary targeting, diversification of gas supply, electricity-system investment and reduction of fossil-fuel intensity rather than indefinite fiscal compensation.
France: nuclear generation changes the structure of household exposure
France possesses a materially different energy shock architecture because nuclear power provides an exceptionally large domestic electricity buffer, with Eurostat recording 380,451 GWh of French nuclear output in 2024, equivalent to approximately 58.6% of all nuclear generation in the EU and 67.3% of French electricity production. Eurostat — Nuclear power production increased by 4.8% in 2024
This does not protect France from petroleum prices because road transport, aviation, freight and some heating systems remain dependent on oil and gas, but it significantly reduces the proportion of electricity supply whose marginal physical availability depends on imported fossil fuels, which explains part of the difference between very high petroleum-product inflation and much lower aggregate inflation.
INSEE reported that French energy prices increased 16.7% year on year in August 2026, while petroleum products increased 28.7%, diesel 36.4%, petrol 19.1% and liquid fuels 47.8%; despite these extraordinary energy movements, headline CPI was only 2.4%, food inflation 1.1%, service inflation 1.9%, and underlying inflation fell to 1.1%. INSEE — Consumer prices, August 2026, final results
France: an extreme petroleum shock without generalised inflation
| Indicator | Aug 2026 y/y | Jul 2026 y/y | Direction |
|---|---|---|---|
| Headline CPI | 2.4% | 2.1% | Higher |
| HICP | 2.6% | 2.4% | Higher |
| Core inflation | 1.1% | 1.3% | Lower |
| Energy | 16.7% | 12.6% | Sharply higher |
| Petroleum products | 28.7% | 20.7% | Sharply higher |
| Diesel | 36.4% | 24.1% | Sharply higher |
| Petrol | 19.1% | 16.5% | Higher |
| Liquid fuels | 47.8% | 30.9% | Sharply higher |
| Food | 1.1% | 1.0% | Nearly unchanged |
| Services | 1.9% | 2.2% | Lower |
Source: INSEE — Consumer prices, August 2026.
The French evidence is particularly important for comparative resilience because it demonstrates quantitatively that a 28.7% increase in petroleum products can coexist with only 1.1% core inflation and 1.1% food inflation, which means the external energy shock has not become a generalized nominal instability process.
France's vulnerability instead lies in fiscal space and public-debt dynamics, because large existing public expenditure commitments constrain the ability to recreate the extremely broad energy-price protection mechanisms deployed during the earlier European gas crisis indefinitely; the more sustainable French buffer is therefore increasingly structural, based on nuclear generation, electricity availability, demand management and targeted rather than universal compensation.
Germany: motor fuels surge while household energy falls
Germany presents a strikingly different configuration because Destatis explicitly attributes the recent acceleration in energy prices principally to the Iran war, yet the domestic price system is displaying offsetting movements that prevent the petroleum shock from translating mechanically into household utility inflation.
In August 2026 German energy prices were 10.5% higher than a year earlier and motor fuels were 27.7% more expensive, while heating oil increased 49.6%, but household energy overall was actually 0.7% cheaper than in August 2025, because electricity prices fell 5.5%, natural gas including operating costs declined 2.9%, and district heating fell 1.0%; Destatis explicitly states that the declines in electricity, natural gas and district heating were partly attributable to federal government measures implemented since the beginning of 2026. Destatis — Inflation rate at +2.9% in August 2026
This internal divergence illustrates how fiscal and regulatory intervention can segment the shock, because motorists and businesses dependent on road freight experience a substantial petroleum-price increase while households using electricity and pipeline energy are partially insulated through domestic tariff and fiscal mechanisms.
Germany: the energy shock is sectorally segmented
| Indicator | Aug 2026 y/y |
|---|---|
| Headline CPI | 2.9% |
| Core CPI | 2.4% |
| Total energy | 10.5% |
| Motor fuels | 27.7% |
| Heating oil | 49.6% |
| Household energy | −0.7% |
| Electricity | −5.5% |
| Natural gas including operating costs | −2.9% |
| District heating | −1.0% |
| Food | 0.1% |
| Transport division | 8.8% |
| Actual net rent excluding heating | 2.2% |
Source: Destatis — Inflation rate at +2.9% in August 2026.
Germany's underlying vulnerability differs from France because Germany no longer possesses domestic nuclear generation, having terminated nuclear electricity production in April 2023, and remains materially exposed to imported gas and petroleum products; Eurostat records Germany among the countries in which natural gas forms a significant share of energy imports and also identifies solid fossil fuels as approximately 9% of Germany's imported-energy composition.
The German resilience mechanism therefore rests less on a dominant domestic baseload technology and more on fiscal intervention, diversified gas procurement, storage, renewable generation, European electricity integration and the ability to finance temporary household relief while allowing part of the petroleum shock to remain visible in transport prices.
United Kingdom: the cap slows transmission rather than eliminating it
The United Kingdom offers another distinct model because domestic electricity and gas tariffs for default customers are governed by a regulatory price cap that is reset periodically, which means wholesale energy shocks do not enter household bills continuously but are transmitted through scheduled regulatory revisions.
Ofgem increased the cap applicable from 1 July to 30 September 2026 by 13% for a typical dual-fuel direct-debit household, with electricity averaging 26.11 pence per kWh and gas approximately 7.33 pence per kWh, and subsequently announced a further 4% increase for the October–December period, which demonstrates that the British system postpones and smooths transmission rather than making households immune to global wholesale prices. Ofgem — Energy price cap July–September 2026
The August consumer-price data show the same containment pattern visible elsewhere in Europe, because UK CPI inflation reached 3.1%, CPIH reached 3.3%, and transport inflation rose to 4.6%, driven strongly by fuels, while motor-fuel prices increased 23.0% year on year and petrol averaged 161.3 pence per litre, the highest level recorded since November 2022; diesel averaged 181.8 pence per litre, having risen by 14.2 pence in a single month. ONS — Consumer price inflation, UK: August 2026
United Kingdom: regulated household energy, exposed transport fuel
| Indicator | Aug 2026 |
|---|---|
| CPI | 3.1% y/y |
| CPIH | 3.3% y/y |
| Core CPIH | 2.9% y/y |
| CPIH services | 3.6% y/y |
| Transport | 4.6% y/y |
| Motor fuels | 23.0% y/y |
| Average petrol price | 161.3 p/litre |
| Average diesel price | 181.8 p/litre |
| July–September household energy cap change | +13% |
| October–December cap change | +4% |
Sources: ONS — Consumer price inflation, UK: August 2026 and Ofgem — Energy price cap October–December 2026.
The British case also demonstrates that regulatory protection creates fiscal and intertemporal trade-offs rather than free insulation, because a price cap does not remove wholesale costs from the economic system; it changes the timing and distribution of those costs among consumers, suppliers, taxpayers and future tariff periods.
The country's fiscal room is materially weaker than before the pandemic and the 2022 energy crisis, with the Office for Budget Responsibility forecasting public-sector net debt of approximately 94.8% of GDP in 2026–27, rising above 96% later in the forecast before declining, while public-sector net borrowing is projected at 3.6% of GDP in 2026–27; the capacity to cushion another energy shock therefore remains substantial in absolute terms but increasingly costly in debt-service and fiscal-opportunity terms. Office for Budget Responsibility — March 2026 Economic and Fiscal Outlook data
Israel: direct war exposure without de-anchoring of the price system
Israel is the most revealing comparator because its economic system has confronted direct military mobilisation, temporary shutdowns, physical damage, disruption to labour supply and substantially higher defence expenditure, yet its inflation process remained anchored strongly enough for the Bank of Israel to reduce its policy rate to 3.25% on 1 September 2026.
The Bank reported that twelve-month inflation stood at 1.5% in July, identical to inflation excluding energy and fruit and vegetables, while non-tradable inflation moderated to 2.5% and tradable-goods inflation stood at only 0.3%, even though the same monetary-policy statement records a roughly 25% increase in Brent prices during the reviewed period to around US$90 per barrel and very high European natural-gas prices. Bank of Israel — Monetary Committee decision, 1 September 2026
This outcome is analytically important because Israel has experienced an actual domestic wartime production shock rather than merely imported energy inflation, yet inflation expectations remained close to the midpoint of the central bank's target range, the shekel was described as virtually unchanged during the review period, the sovereign risk premium remained close to levels prevailing before 7 October 2023, and credit arrears remained low.
The Israeli price system therefore absorbed the war through fiscal expenditure, labour-market disruption, temporary production losses, increased borrowing and targeted financial relief rather than primarily through uncontrolled inflation.
Israel’s 2026 wartime macroeconomic buffer
| Indicator | Latest verified official position |
|---|---|
| July annual inflation | 1.5% |
| July inflation excluding energy and fruit/vegetables | 1.5% |
| July non-tradable inflation | 2.5% |
| July tradable inflation | 0.3% |
| Policy rate from September 2026 | 3.25% |
| 2026 GDP growth forecast | 4.0% |
| 2027 GDP growth forecast | 5.5% |
| 2026 inflation forecast | 1.8% |
| 2026 government deficit forecast | 4.9% of GDP |
| 2026 debt/GDP forecast | 69% |
| 2026 broad unemployment forecast, ages 25–64 | 4.6% average |
| Second-half 2026 broad unemployment expectation | approximately 3% |
| 2026 private-consumption growth forecast | 3.0% |
| 2026 civilian-import growth forecast | 10.5% |
Sources: Bank of Israel — September 2026 monetary decision and Bank of Israel — Research Department Staff Forecast, July 2026.
The Bank of Israel's July baseline assumed that 2026 defence spending would increase by approximately NIS15 billion, slightly above the NIS12.8 billion reserve already embedded in the state budget, while warning that a further defence-budget increase of as much as NIS25 billion could push the deficit toward approximately 5.5% of GDP and raise inflation relative to baseline; this shows clearly that Israeli resilience is not equivalent to absence of cost, because the burden is being transferred into public borrowing, defence expenditure and future fiscal adjustment rather than eliminated.
Israel’s banking system operates as an explicit wartime shock absorber
A particularly important difference lies in the use of the regulated banking system to protect household and business liquidity, because the Bank of Israel introduced a formal relief framework after Operation Roaring Lion that permitted affected households to defer mortgage payments for three months without additional interest or fees, defer consumer loans up to NIS100,000, and allowed affected small and micro businesses with annual turnover up to NIS25 million to postpone repayment on loans up to NIS2 million for two months without additional interest or fees. Bank of Israel — Operation Roaring Lion assistance programme
Reservist-owned businesses additionally received exemptions from interest on qualifying overdrafts of up to NIS30,000, while the Bank of Israel temporarily delayed reporting certain arrears to the national credit-data register so that technical payment disruptions associated with the war would not immediately impair borrowers' credit ratings and subsequent access to finance.
The economic significance of these measures is larger than their nominal value because they interrupt a potentially destabilising household feedback loop: lost earnings do not immediately become missed mortgage payments, missed payments do not immediately become adverse credit records, adverse credit records do not immediately become exclusion from future credit, and temporary wartime liquidity problems therefore have a lower probability of becoming permanent balance-sheet impairment.
Wartime credit transmission: Israel versus an unbuffered system
| Initial disturbance | Without banking intervention | Israeli intervention mechanism | Resulting stabilisation |
|---|---|---|---|
| Household evacuation | Mortgage payments continue despite displacement | Three-month qualifying mortgage deferral | Preserves near-term cash flow |
| Injury or damaged home | Income falls while consumer debt remains payable | Up to NIS100,000 consumer-credit deferral | Reduces forced asset liquidation |
| Small-business closure | Revenue disappears while debt service continues | Up to NIS2 million business-loan deferral | Reduces immediate insolvency risk |
| Reserve mobilisation | Business-owner cash flow deteriorates | Qualifying overdraft-interest relief | Limits short-term financing cost |
| Payment interruption | Arrears damage credit record | Temporary reporting delay | Prevents temporary shock becoming structural credit exclusion |
Sources: Bank of Israel — Assistance programme, March 2026 and Bank of Israel — Delay in reporting loan arrears to the Credit Data Registry.
Israel’s labour market converted a military shock into a temporary rather than permanent employment loss
The Bank of Israel's July forecast estimated broad unemployment among people aged 25–64 at 4.6% on average for 2026, explicitly noting that this figure was heavily affected by the combat months associated with the Iran confrontation, while expecting unemployment to settle around 3% during the second half of the year as reserve personnel returned and restrictions eased.
The distinction between temporary absence and permanent employment destruction is essential for resilience analysis, because mobilisation can reduce current output severely while preserving employer-worker relationships, allowing production to recover rapidly once workers return, whereas prolonged sanctions, firm closures or persistent shortages destroy productive relationships themselves and therefore produce a slower recovery.
The Bank of Israel estimated that GDP in the second quarter of 2026 was 6.2% above the fourth quarter of 2025 on an annualised comparison, although the increase was only 3.8% after removing overseas production by Israeli companies, which still demonstrates substantial recovery after the first-quarter disruption.
By September, the Bank's monthly economic-activity index increased another 0.4% in August, supported by consumption-goods imports, manufacturing inputs and tax receipts, even though exports, retail activity and credit-card purchases provided some offsetting weakness, providing further evidence of recovery without implying that the war's economic cost had disappeared.
The resilience gap is visible in the relationship between energy and food inflation
Perhaps the most decision-useful comparison is not between headline inflation rates but between energy inflation and food inflation, because energy represents the internationally transmitted shock while food indicates whether that shock has penetrated essential household consumption.
Energy shock versus essential-consumption transmission
| Economy | Headline inflation | Energy-related inflation | Food inflation | Core / underlying inflation | Interpretation |
|---|---|---|---|---|---|
| Euro area | 3.2% HICP | Energy contributed 1.29 pp | 1.1% food, alcohol & tobacco | 2.4% core | Energy shock remains concentrated |
| Italy | 3.3% NIC | Regulated 18.6%, non-regulated 17.0% | Grocery basket 0.9% | 1.5% | Very large energy shock with minimal food spillover |
| France | 2.4% CPI | Energy 16.7% | 1.1% | 1.1% | Strongest evidence of containment |
| Germany | 2.9% CPI | Energy 10.5%, fuels 27.7% | 0.1% | 2.4% | Petroleum shock largely isolated from food |
| United Kingdom | 3.1% CPI | Motor fuels 23.0% | Not directly comparable in cited release | Core CPIH 2.9% | Transport shock evident but broader inflation contained |
| Israel | 1.5% CPI, July | Global Brent shock absorbed without broad domestic repricing | component not required for conclusion | 1.5% ex-energy/fruit/veg | Direct wartime exposure without monetary de-anchoring |
Sources: Eurostat, Istat, INSEE, Destatis, ONS and Bank of Israel.
The pattern is sufficiently consistent across countries to support a robust conclusion: the 2026 Middle East shock is visible primarily in petroleum, transport and selected energy categories, while underlying food and core inflation remain comparatively low across most of the European economies examined, meaning that the shock has so far changed relative prices more strongly than it has destabilised the overall price level.
Monetary credibility is performing an economic function that cannot be replicated quickly
Central-bank credibility matters because inflation depends partly on current input costs and partly on expectations about future prices, wages and exchange rates; when households and firms believe that a central bank will ultimately restore inflation to target, an energy shock is less likely to produce anticipatory wage increases, inventory hoarding, accelerated consumer purchases or widespread repricing unrelated to current costs.
The Bank of Israel could lower its policy rate to 3.25% even while global energy prices were rising because inflation expectations remained anchored near the midpoint of the target range, while the European data similarly show core inflation close enough to central-bank objectives that authorities can differentiate between temporary energy inflation and persistent domestic inflation rather than responding mechanically to every increase in oil prices.
This is a major resilience advantage because a credible monetary authority can allow a temporary relative-price adjustment without validating it through permanently faster money-price growth, whereas in a high-inflation economy every new energy shock can become evidence supporting expectations of further depreciation, higher prices and greater demand for hard assets, producing a self-reinforcing feedback mechanism.
Fiscal resilience is substantial but heterogeneous and not unlimited
European and Israeli resilience should not be overstated, because moving an external shock onto the public balance sheet still creates a real economic liability: taxpayers eventually finance subsidies, sovereign-debt holders demand interest, additional public borrowing competes for fiscal capacity, and persistent energy support can become structurally difficult to remove once households incorporate it into expectations.
The United Kingdom illustrates this constraint especially clearly, because the OBR projects debt around 95% of GDP across much of its medium-term forecast, while Italy also operates with very high sovereign indebtedness and France faces a constrained fiscal environment, meaning that none of these governments can permanently neutralise every energy shock without sacrificing other expenditure, increasing taxation or weakening fiscal sustainability.
Israel faces a parallel but differently structured trade-off because the Bank of Israel projects debt around 69% of GDP and a 4.9% deficit in 2026, with further defence expenditure capable of pushing borrowing and inflation higher, meaning that continued resilience depends partly on the conflict remaining episodic rather than evolving into an open-ended fiscal mobilisation.
Comparative fiscal shock-absorption architecture
| Jurisdiction | Principal fiscal buffer | Principal constraint | Transmission avoided today | Cost transferred to future |
|---|---|---|---|---|
| EU collectively | National budgets plus integrated capital markets | Heterogeneous fiscal space | Immediate household energy shock | Higher deficits or lower fiscal room |
| Italy | Temporary tariff/tax relief and sovereign borrowing | High debt stock | Part of utility and transport shock | Debt-service burden and reduced policy space |
| France | Budget intervention plus electricity-system structure | Large public expenditure commitments | Electricity and household-energy volatility | Fiscal consolidation pressure |
| Germany | Fiscal relief plus lower household electricity/gas costs | Constitutional and political fiscal constraints | Household utility-price shock | Budget reallocations and future financing |
| UK | Regulatory energy cap, benefits and public borrowing | Debt near 95% GDP and high borrowing costs | Immediate retail-tariff volatility | Tariff resetting and fiscal burden |
| Israel | Deficit financing, credit relief, compensation and banking measures | High defence expenditure and geopolitical risk | Temporary household/business liquidity shock | Higher debt, taxes or expenditure restraint |
Financial-system continuity is an underrated resilience variable
A functioning payments and banking system allows an economy to transform a sudden real loss into a manageable financing problem, because households can borrow temporarily, companies can finance inventories, governments can issue debt, importers can obtain trade finance, and central banks can provide liquidity if markets become stressed.
This mechanism separates Israel and Europe sharply from economies facing extensive financial isolation, because a European energy importer facing a temporary US$10 million increase in working-capital needs can generally obtain bank credit or access capital markets, whereas a company operating under severe sanctions may confront not only a higher commodity price but also difficulty transferring payment, obtaining insurance, opening letters of credit, sourcing correspondent banking or settling transactions in a convertible currency.
The same nominal oil-price shock therefore has a different macroeconomic multiplier depending on financial architecture: in an integrated system it initially becomes a financing and profitability problem, while in a financially isolated system it can become a quantity constraint, because goods cannot be procured even when domestic demand exists.
The comparative resilience hierarchy is therefore structural
The evidence permits a hierarchy of shock absorbers without assigning normative rankings to governments, because the countries examined rely on different combinations of energy structure, financial capacity, monetary credibility and fiscal intervention.
France derives exceptional protection from nuclear electricity, which limits exposure of the power sector even though petroleum transport remains vulnerable; Germany combines diversified sourcing, European market integration and fiscal support but remains more exposed to imported fossil fuels; Italy remains highly gas-dependent but has so far prevented energy inflation from spilling materially into food and core prices; the United Kingdom relies more visibly on regulated household tariff transmission and a deep sovereign-financing market; Israel relies heavily on central-bank credibility, exchange-rate stability, fiscal borrowing and direct banking-sector intervention during combat periods.
The EU layer adds another form of resilience because national systems share a large internal market, interconnected electricity and gas networks, common trade policy, common euro-area monetary policy for participating states and increasingly coordinated energy procurement and crisis tools, reducing the probability that a supply disruption in one jurisdiction must be absorbed entirely within that jurisdiction.
What Europe has learned since the 2022 energy crisis
The 2026 response is materially shaped by institutional adaptation following the earlier Russian gas shock, because European governments entered the present crisis with broader LNG access, reduced Russian concentration, greater renewable capacity, substantially higher awareness of storage management and established legal templates for targeted energy support.
Eurostat records that EU renewable generation supplied 47.2% of electricity in 2025, while nuclear provided another 23.2%, meaning that roughly 70.4% of European electricity production came from these two sources alone; although this statistic does not imply that 70% of the energy system is immune to fossil prices, it greatly reduces direct fuel-import dependence in electricity generation compared with a system dominated by gas and oil.
The Commission's AccelerateEU initiative makes this strategic logic explicit by treating the current Middle East shock not merely as a temporary price problem but as another demonstration that dependence on volatile imported fossil fuels creates fiscal, industrial and security exposure, and therefore combines immediate consumer relief with measures intended to accelerate electrification, renewables and domestic clean-energy supply.
Resilience does not mean immunity
The European and Israeli models still contain several escalation thresholds that could materially weaken the present assessment, because a prolonged closure or major impairment of the Strait of Hormuz, sustained oil prices substantially above present levels, simultaneous disruption to LNG trade, another direct Israel-Iran confrontation or persistent defence mobilisation would progressively transform a temporary relative-price shock into a broader macroeconomic problem.
Germany and Italy remain especially exposed to sustained imported-energy inflation; the United Kingdom remains sensitive to wholesale gas pricing through the retail cap; France remains exposed in petroleum-intensive transport despite its nuclear electricity advantage; Israel remains vulnerable to reserve mobilisation, defence spending and labour-supply constraints; and the EU as a whole remains approximately 57% dependent on net imported energy, meaning that diversification reduces supplier concentration but does not eliminate its external-resource requirement.
A shock lasting several months can also migrate gradually from energy into freight, industrial production, food processing and wages, meaning that today's low food and core inflation does not guarantee permanent containment; the present judgment is therefore a description of the transmission observed through August and September 2026 rather than an assumption that second-round effects cannot emerge.
Comparative resilience matrix
| Resilience dimension | Israel | Italy | France | Germany | United Kingdom | EU system |
|---|---|---|---|---|---|---|
| Monetary anchor | Strong | ECB | ECB | ECB | Bank of England framework | ECB for euro area |
| Current broad inflation containment | Strong | Strong despite energy | Very strong | Strong | Moderate-strong | Strong |
| Energy-import exposure | Material | High | Moderate, mitigated by nuclear | High | Material | 57% net import dependency |
| Domestic electricity buffer | Gas + renewables + regional structure | Limited nuclear-free mix | Very strong nuclear | Renewables, no nuclear | Mixed domestic/import system | Renewables + nuclear ≈70% of electricity |
| Fiscal shock absorption | High but defence-constrained | Available but debt-constrained | Available but fiscally constrained | Significant | Significant but debt-constrained | €14.5bn announced spring measures |
| Household credit intervention | Very strong and explicit | Conventional banking/social system | Conventional banking/social system | Conventional banking/social system | Conventional banking/social system | National responsibility |
| Exchange-rate stability | Strong during latest review | Euro | Euro | Euro | Sterling | Euro architecture |
| Food-price containment | Strong overall inflation environment | 0.9% grocery basket | 1.1% food | 0.1% food | Broader inflation contained | 1.1% food/alcohol/tobacco |
| Ability to spread shock over time | High | High but constrained by debt | High but fiscally constrained | High | High but costly | High relative to financially isolated economies |
| Principal vulnerability | Defence/fiscal escalation | Imported gas and debt | Petroleum transport and fiscal space | Imported fossil fuels | Gas/retail tariff transmission and debt | Persistent fossil-import dependency |
The table does not imply that one system is universally superior, because each country's apparent resilience reflects a different combination of technology, fiscal history, energy geography and institutional design, while the key analytical finding is simply that all possess multiple intermediate shock absorbers between an international commodity-price increase and household subsistence expenditure.
Decision-relevant comparison
The comparative evidence supports a strong distinction between shock exposure and shock transmission, because Italy can experience regulated-energy inflation above 18%, France can experience petroleum inflation near 29%, Germany can experience motor-fuel inflation near 28%, and the United Kingdom can experience motor-fuel inflation of 23% without producing food inflation or underlying inflation remotely proportional to those movements.
That outcome is not produced by a single policy instrument but by a layered system in which external energy costs first meet diversified suppliers, liquid foreign-exchange markets and trade finance, then interact with regulated utilities, competition and inventories, then meet fiscal relief and social protection, then pass through an independent monetary-policy system whose credibility limits second-round expectations, and only after those filters reach the final household budget.
Israel provides the wartime version of the same mechanism because the system allowed a large defence and labour shock to be temporarily absorbed by government borrowing, central-bank credibility, banking relief and continued financial-market access while preserving price stability, rather than forcing the entire wartime adjustment immediately through current household consumption.
The resilience gap with Iran therefore does not primarily arise from the fact that European and Israeli households face smaller geopolitical shocks, because several of the observed energy-price movements are extremely large; it arises from the fact that the European and Israeli institutional systems possess more places in which the shock can be temporarily parked, financed, redistributed or substituted before it reaches essential household consumption.
Key judgments
The strongest evidence of European resilience is the separation between energy inflation and underlying inflation, because euro-area energy contributed 1.29 percentage points to August headline inflation while inflation excluding energy fell to 2.1%, showing that the external shock remains concentrated rather than self-reinforcing across the general price system.
France represents the strongest electricity-supply buffer because nuclear power generated 67.3% of French electricity in 2024, allowing a severe petroleum shock to coexist with only 1.1% core inflation and 1.1% food inflation in August 2026.
Germany demonstrates the value of segmented intervention because motor fuels increased 27.7% while household energy overall fell 0.7%, which prevented the oil shock from appearing uniformly across household utility expenditure.
Italy demonstrates that even a gas-intensive economy can contain second-round inflation, because regulated and non-regulated energy rose 18.6% and 17.0% respectively while core inflation remained 1.5% and the grocery basket increased only 0.9%.
The United Kingdom demonstrates how regulatory timing modifies transmission, because Ofgem's quarterly price cap converts continuous wholesale volatility into periodic household tariff adjustments, although the July cap still increased by 13% and the October cap by another 4%, proving that smoothing does not eliminate the underlying resource cost.
Israel represents the most important wartime comparator because annual inflation was still only 1.5% in July, the policy rate could be reduced to 3.25%, the exchange rate remained broadly stable during the latest review period and targeted credit relief prevented part of the military shock from immediately becoming household insolvency or business failure.
What would change the assessment
The European resilience judgment would weaken materially if energy inflation began propagating simultaneously into food, services and wages, particularly if euro-area inflation excluding energy moved persistently upward while inflation expectations departed from central-bank targets, because that would indicate that the current relative-price shock was becoming a generalized inflation process.
The assessment would also weaken if a sustained disruption to oil or LNG supply caused physical shortages rather than merely higher prices, because fiscal transfers and price caps can redistribute purchasing power but cannot create missing molecules of gas or barrels of oil.
For Israel, another prolonged mobilisation that materially increased defence expenditure beyond the current fiscal assumptions, weakened the shekel, increased the sovereign risk premium or created persistent labour shortages would reduce the present resilience advantage, particularly because the Bank of Israel already identifies defence-budget expansion as a material upside risk to the deficit and inflation.
The resilience judgment would strengthen if energy-price inflation fell while core inflation remained contained, European storage and import diversification continued improving, Israeli inflation expectations remained anchored, and the present shock could be financed without significant deterioration in sovereign debt trajectories.
Open official record
The most consequential outstanding evidence includes detailed country-level fiscal costs of all energy measures adopted after the European Commission's 4 May 2026 cut-off, because the current €14.5 billion figure does not capture measures announced later in the summer; comparable current energy-import dependency ratios for Italy, France and Germany using 2025 rather than 2024 balances; complete August 2026 Israeli CPI component data in an English official release; harmonised household-income and real-wage data for all comparator countries covering the post-February conflict period; and final 2026 fiscal estimates capable of showing how much of the shock was ultimately transferred from households onto sovereign balance sheets.
Comparative Resilience: How Israel and Europe Absorb the Iran-Conflict Shock Before It Reaches Household Subsistence
Principal judgment. Israel and the principal European economies are not insulated from the Iran conflict. Their resilience lies in the presence of multiple intermediate shock absorbers—credible currencies, functioning monetary transmission, deep capital markets, fiscal borrowing capacity, banking continuity, social-protection mechanisms and diversified energy systems—that prevent a large external energy and security shock from becoming an immediate generalised collapse in household purchasing power.
Energy inflation has risen without broad monetary de-anchoring
Euro-area energy inflation accelerated materially, yet ex-energy and core inflation edged lower. The shock remains concentrated in relative energy prices rather than spreading uniformly through food, services and wages.
European inflation anatomy after the Middle East energy shock
| Indicator | Jul 2026 | Aug 2026 | Change | Analytical meaning |
|---|---|---|---|---|
| Headline HICP | 2.9% | 3.2% | +0.3 pp | External shock reaches consumers |
| HICP excluding energy | 2.2% | 2.1% | −0.1 pp | No broad acceleration outside energy |
| Core HICP | 2.5% | 2.4% | −0.1 pp | Underlying inflation remains contained |
| Food, alcohol & tobacco | 1.2% | 1.1% | −0.1 pp | Essential-food inflation remains limited |
| Energy contribution | 0.94 pp | 1.29 pp | +0.35 pp | Energy explains growing share of headline |
| Services contribution | 1.55 pp | 1.43 pp | −0.12 pp | Domestic services not accelerating with energy |
Four layers that prevent energy shock from becoming household collapse
Import dependence remains high, but concentration has fallen
Europe is shifting part of the shock onto public balance sheets
Italy, France, Germany and the United Kingdom are absorbing the same shock differently
| Economy | Headline inflation | Energy shock | Food / core signal | Resilience mechanism |
|---|---|---|---|---|
| Italy | 3.3% | Regulated +18.6%; non-regulated +17.0% | Core 1.5%; grocery basket 0.9% | Tariff regulation, diversified gas, fiscal absorption |
| France | 2.4% | Energy +16.7%; petroleum +28.7% | Food 1.1%; core 1.1% | Nuclear-heavy electricity, fiscal support |
| Germany | 2.9% | Motor fuels +27.7%; heating oil +49.6% | Food 0.1%; core 2.4% | Segmented fiscal intervention, storage, diversified gas |
| United Kingdom | 3.1% | Motor fuels +23.0%; cap +13% | Core CPIH 2.9% | Regulatory cap smooths timing of household pass-through |
High gas exposure, limited second-round inflation
Nuclear power alters the exposure profile
Fuel shock is being segmented
The cap smooths rather than eliminates the shock
| Indicator | Aug 2026 | Transmission signal |
|---|---|---|
| Headline CPI | 2.4% | Low aggregate transmission |
| Petroleum products | 28.7% | Large external energy shock |
| Diesel | 36.4% | Transport channel highly exposed |
| Food | 1.1% | Essential-consumption spillover minimal |
| Underlying inflation | 1.1% | No generalized nominal instability |
Direct war exposure without de-anchoring of the price system
| Indicator | Verified position | Analytical significance |
|---|---|---|
| July inflation | 1.5% | Price system remains anchored |
| Ex-energy / fruit / vegetables | 1.5% | Underlying inflation contained |
| Policy rate | 3.25% | Central bank could ease despite energy shock |
| 2026 GDP growth forecast | 4.0% | Recovery after temporary disruption |
| 2026 deficit | 4.9% GDP | War burden shifted partly to public balance sheet |
| Debt / GDP | 69% | Resilience has a future fiscal cost |
| Private consumption growth | 3.0% | Household demand remains functional |
| Civilian import growth | 10.5% | No import-compression regime |
Temporary liquidity stress is being prevented from becoming permanent balance-sheet impairment
Energy inflation versus essential-consumption transmission
| Economy | Headline | Energy shock | Food / essential signal | Core / underlying |
|---|---|---|---|---|
| Euro area | 3.2% | +1.29 pp contribution | 1.1% | 2.4% |
| Italy | 3.3% | 18.6% / 17.0% | 0.9% | 1.5% |
| France | 2.4% | 16.7% | 1.1% | 1.1% |
| Germany | 2.9% | 27.7% fuels | 0.1% | 2.4% |
| UK | 3.1% | 23.0% motor fuels | Not directly comparable | 2.9% core CPIH |
| Israel | 1.5% | Global Brent shock absorbed | No broad spillover signal | 1.5% ex-energy / F&V |
Protection today creates liabilities tomorrow
| Jurisdiction | Principal buffer | Constraint | Transmission avoided today | Cost transferred forward |
|---|---|---|---|---|
| EU collectively | National budgets + capital markets | Uneven fiscal space | Immediate household energy shock | Higher deficits / reduced room |
| Italy | Tariff / tax relief + borrowing | High debt stock | Utility / transport burden | Debt-service burden |
| France | Budget intervention + nuclear system | Large spending commitments | Electricity volatility | Future consolidation |
| Germany | Fiscal relief + tariff intervention | Fiscal-rule constraints | Household utility shock | Budget reallocation |
| UK | Price cap + benefits + borrowing | Debt near 95% GDP | Immediate retail volatility | Tariff resets / fiscal burden |
| Israel | Deficit + credit relief | Defence expenditure | Liquidity shock | Higher debt / taxes / restraint |
Structural differences across shock-absorption systems
| Dimension | Israel | Italy | France | Germany | UK | EU system |
|---|---|---|---|---|---|---|
| Monetary anchor | Strong | ECB | ECB | ECB | BoE framework | ECB for euro area |
| Energy exposure | Material | High | Moderate | High | Material | 57% import dependency |
| Electricity buffer | Gas + renewables | Limited | Very strong nuclear | Renewables / no nuclear | Mixed | Renewables + nuclear ≈70% |
| Credit intervention | Very explicit | Conventional | Conventional | Conventional | Conventional | National responsibility |
| Principal vulnerability | Defence escalation | Gas + debt | Petroleum + fiscal space | Imported fuels | Gas + debt | Persistent fossil dependence |
Six controlling judgments
The strongest evidence of European resilience is the separation between energy inflation and underlying inflation.
France’s nuclear electricity system provides the strongest structural power-sector buffer among the major economies examined.
Germany shows that policy can segment an energy shock, with very high motor-fuel inflation coexisting with falling household-energy prices.
Italy demonstrates that gas intensity does not mechanically imply broad inflation if monetary, fiscal and procurement buffers remain functional.
The UK price-cap model modifies the timing and distribution of transmission rather than removing the underlying wholesale energy cost.
Israel is the strongest wartime comparator because direct military disruption has been absorbed through borrowing, credit relief and monetary credibility without generalized price de-anchoring.
Evidence still required for a full resilience audit
- Country-level fiscal costs of energy measures announced after the Commission’s 4 May 2026 cut-off.
- Updated 2025 energy-import dependency ratios for Italy, France and Germany.
- Complete August 2026 Israeli CPI-component data in an English official release.
- Harmonised post-conflict real-wage and household-income data across comparators.
- Final 2026 fiscal outcomes showing how much shock was transferred onto sovereign balance sheets.
What would weaken the current resilience judgment
Allocation and State Capacity
Principal judgment
Iran’s central wartime economic constraint is no longer simply the volume of resources entering the country, but the state’s capacity to rank competing claims on scarce foreign exchange, fiscal space, banking liquidity, transport capacity and administrative attention with sufficient speed and transparency to prevent an external shock from being amplified by domestic allocation failures. The distinction is decisive because two economies exposed to the same loss of export revenue can produce very different household outcomes depending on whether scarce dollars, euros, yuan or other settlement currencies are channelled toward medicines, staple foods, animal feed, industrial inputs and critical infrastructure, or instead dissipated through poorly targeted subsidies, opaque preferential access, delayed customs clearance and low-priority consumption.
The most defensible assessment is therefore that foreign-exchange allocation has become the core transmission valve between sanctions pressure and household welfare, while fiscal policy, the banking system, customs administration and alternative trade corridors determine whether the state can keep that valve functioning. The World Bank’s April 2026 regional assessment describes a conflict shock affecting trade, energy, shipping and macroeconomic stability across the Middle East, while identifying the effective blockade of the Strait of Hormuz as a major global supply disturbance because roughly 20% of global oil consumption and LNG trade normally moves through that corridor; for Iran, the same maritime disruption is compounded by sanctions and restricted financial access, creating simultaneous pressure on export earnings and import logistics. World Bank — Middle East, North Africa, Afghanistan & Pakistan Economic Update, April 2026
The allocation problem has subsequently become more severe because the United States broadened financial enforcement during August and September 2026 through Operation Economic Outcast, which Treasury describes as a campaign targeting oil-smuggling channels, banking relationships, foreign-currency networks, aviation, digital-asset infrastructure and other mechanisms Iran uses to obtain or move funds abroad; these are official U.S. policy descriptions and should therefore be treated as evidence of enforcement scope and intent rather than independent proof of the full economic effect achieved inside Iran. U.S. Treasury — Treasury Launches Unprecedented Campaign Against Iranian Regime on Economic D-Day, 24 August 2026
The critical variable is not gross revenue but usable foreign exchange
An oil cargo can generate revenue without immediately generating foreign currency that is freely usable across the Iranian economy, because the relevant economic value depends on how the sale is settled, where proceeds are held, whether correspondent banking channels remain available, what currencies can be converted, how large a sanctions discount is applied and whether counterparties are willing to process payments without exposing themselves to secondary sanctions.
This distinction has become materially more important in 2026 because U.S. Treasury actions increasingly target the conversion and settlement architecture rather than only the physical export of petroleum. On 1 May 2026, Treasury stated that Iranian exchange houses facilitate billions of dollars of foreign-currency transactions each year and identified their role in converting oil revenue, often received in Chinese yuan, into currencies more readily usable by sanctioned Iranian entities; on 19 May, Treasury again targeted exchange houses and front companies handling hundreds of millions of dollars on behalf of sanctioned Iranian banks. U.S. Treasury — Economic Fury Targets Iranian Shadow Banking Networks Moving Billions in Foreign Currency, 1 May 2026 U.S. Treasury — Economic Fury Targets Networks Generating Billions for Iran’s Terrorist Regime, 19 May 2026
Treasury subsequently stated that between January 2024 and June 2026 Banque Misr UAE processed approximately US$1.8 billion for 103 companies potentially connected to Iranian shadow-banking networks, and proposed cutting the bank’s correspondent access to U.S. financial institutions; again, the US$1.8 billion estimate is a U.S. Treasury assessment rather than an independently audited Iranian flow measure, but it illustrates the scale of the channels now being targeted. U.S. Treasury — Iran’s Access to UAE Banks Targeted Under Operation Economic Outcast, 28 August 2026
Foreign-exchange usability hierarchy
| Stage | What must occur | Principal constraint | Household relevance |
|---|---|---|---|
| Export physically occurs | Oil, petrochemical or non-oil good leaves Iran | Maritime security, vessel access, sanctions exposure | No immediate household benefit if proceeds remain inaccessible |
| Buyer pays | Counterparty settles invoice | Currency, banking channel, sanctions screening | Determines whether revenue becomes usable rather than trapped |
| Funds remain accessible | Iranian entity controls account or intermediary | Account freezes, correspondent restrictions, de-risking | Restricted access reduces effective import capacity |
| Currency can be converted | Yuan, dirham or other proceeds exchanged | Exchange houses, intermediary banks, liquidity | Determines ability to pay suppliers quoting in other currencies |
| Payment reaches importer | Bank or intermediary transfers funds | Compliance risk, transaction delay, secondary sanctions | Delays can become inventory shortages |
| Import is prioritised | State allocates FX to competing sectors | Administrative criteria, political priority, transparency | Determines which households or industries receive scarce goods |
| Goods clear customs | Cargo physically enters domestic market | Licensing, inspection, port and border congestion | Determines whether financial allocation becomes real supply |
| Distribution reaches retail | Goods move through domestic networks | Freight, fuel, warehousing, regional bottlenecks | Determines final price and availability |
The decisive metric for state capacity is therefore not simply oil-export revenue reported in dollars, but the proportion of that revenue that can be converted into timely, settlement-ready purchasing power for priority imports.
Foreign-exchange allocation is the most consequential domestic rationing decision
When foreign currency becomes scarce, every allocation creates an opportunity cost because the same dollar or yuan cannot simultaneously finance a pharmaceutical ingredient, a shipment of wheat, a machine tool, a vehicle, an industrial chemical and a consumer durable.
The state therefore operates an implicit hierarchy even where no formal wartime hierarchy is publicly disclosed. The critical institutional question is whether that hierarchy is organised around measurable welfare and production criteria or around fragmented administrative access.
A rational wartime allocation structure would distinguish at least four categories: life-preserving imports, including medicines, medical equipment and essential food; production-preserving inputs, including industrial intermediates, agricultural feed and replacement parts; infrastructure-preserving imports, including power, water, telecommunications and transport equipment; and deferrable consumption, in which the welfare loss from postponement is significantly lower.
The importance of this hierarchy is reinforced by the World Health Organization’s April assessment, which stated that Iranian health partners were warning of looming medicine shortages while WHO itself was sourcing non-communicable-disease commodities primarily from abroad, demonstrating that access to foreign exchange for pharmaceuticals is not an abstract balance-of-payments question but a direct determinant of continuity of care. WHO — Middle East Conflict Global Situation Report, 30 April 2026
Wartime foreign-exchange priority matrix
| Priority tier | Typical imports | Failure consequence | Time tolerance | Allocation logic |
|---|---|---|---|---|
| Tier 1: Life-preserving | Insulin, dialysis inputs, oncology drugs, vaccines, essential food | Mortality, morbidity, acute food insecurity | Days to weeks | Highest priority |
| Tier 2: Production-preserving | Grain, animal feed, fertiliser, industrial spare parts, chemicals | Supply contraction, unemployment, second-round inflation | Weeks | High priority |
| Tier 3: Infrastructure-preserving | Power components, pumps, telecom equipment, transport spares | System outages, logistics disruption | Weeks to months | High but sequenced |
| Tier 4: Strategic industrial | Machinery, capital goods, selected technology | Reduced future capacity | Months | Depends on sector and substitution options |
| Tier 5: Consumption-supporting | Non-essential consumer imports | Welfare inconvenience rather than system failure | Months | Lower priority |
| Tier 6: Deferrable luxury | Premium vehicles, prestige goods, other high-end discretionary imports | Limited macroeconomic welfare effect | Long | Lowest emergency priority |
This matrix is analytical rather than a claim that Iranian authorities formally employ these exact categories, because the current public record does not provide a transparent monthly priority schedule showing foreign-exchange allocations by importer and commodity class.
The opacity of allocation weakens both efficiency and legitimacy
Scarcity requires rationing, but rationing without public criteria increases the risk that the foreign-exchange system itself becomes a source of economic rent.
Where importers receive preferential access to foreign currency at rates below the effective market-clearing price, the difference between the official allocation rate and the market value of foreign exchange becomes a transferable economic advantage. If the imported product is strictly price-controlled and sold at the intended subsidised retail price, that advantage can benefit consumers; if enforcement is weak, part of the subsidy can instead be captured through mark-ups, resale, re-export, false invoicing or privileged access.
The result is a governance problem rather than simply a monetary problem, because the effectiveness of a subsidised exchange-rate regime depends on whether authorities can answer four questions for every major allocation: who received the currency, at what rate, for which commodity and at what final domestic price.
The absence of sufficiently granular and timely public data on these variables prevents independent verification of how much scarce foreign exchange is supporting essential consumption as opposed to low-priority imports. The supplied material identifies this transparency deficit directly, noting that public scrutiny of preferential currency, subsidised credit, procurement and tax relief becomes more important as those benefits grow more valuable under blockade.
Minimum audit architecture for foreign-exchange allocation
| Required disclosure | Why it matters | What it would reveal |
|---|---|---|
| Importer identity | Establishes beneficiary concentration | Whether allocation is dispersed or captured by repeat recipients |
| Commodity HS code | Links currency to physical goods | Whether allocation prioritises essentials |
| Currency amount | Measures resource use | Fiscal and FX opportunity cost |
| Exchange rate applied | Measures implicit subsidy | Size of transfer relative to market FX rate |
| Approval date | Measures administrative delay | Whether priority sectors receive faster treatment |
| Customs entry date | Measures conversion of approval into real supply | Whether allocated FX actually produces imports |
| Retail-price condition | Tests subsidy pass-through | Whether consumer receives intended benefit |
| Final importer/distributor margin | Tests rent capture | Whether intermediaries retain subsidy |
| Beneficial ownership | Identifies related-party exposure | Whether concentration occurs through affiliated entities |
| Expiry and claw-back condition | Limits hoarding | Whether unused allocations return to the pool |
Preferential exchange rates and electronic transfers solve different problems
Iran’s recent policy shift away from some subsidised import exchange-rate mechanisms toward electronic vouchers represents a move from price-side support toward income-side support, and the difference matters because the two instruments distribute risk differently.
A preferential exchange rate lowers the importer’s domestic-currency acquisition cost before the good reaches the market, while a voucher compensates the household after market prices have risen. The first instrument places administrative pressure on customs, importers and price enforcement; the second places administrative pressure on beneficiary databases, payment systems and inflation indexation.
The first is vulnerable to leakage between allocation and retail sale, while the second is vulnerable to erosion of nominal purchasing power. Neither mechanism can solve a physical shortage because a subsidised price or electronic credit cannot create supply when shipping, production or payment channels are interrupted.
Subsidised FX versus direct transfer architecture
| Dimension | Preferential FX | Electronic voucher / transfer |
|---|---|---|
| Point of intervention | Importer | Household |
| Main objective | Lower domestic acquisition cost | Restore purchasing power |
| Main administrative risk | Diversion and rent capture | Targeting error and inflation erosion |
| Transparency requirement | Importer, FX rate, quantity, resale price | Beneficiary list, transfer value, indexation |
| Market-price signal | Suppressed | Preserved |
| Leakage risk | Potentially high if resale uncontrolled | Lower at import stage, but possible retailer manipulation |
| Fiscal/FX burden visibility | Often obscured in exchange-rate spread | More explicit in budget or quasi-budget |
| Physical-shortage solution | No | No |
| Suitability during extreme inflation | Requires strict enforcement | Requires frequent indexation |
| Distributional precision | Depends on consumption of subsidised good | Potentially high if household data are accurate |
The preferable instrument cannot be determined in the abstract because it depends on market structure, administrative capacity and inflation dynamics; in an economy with strong beneficiary databases but weak importer oversight, direct transfers can reduce leakage, while in an economy experiencing extreme price volatility and limited retail competition, direct transfers can lose real value too quickly unless indexed.
Fiscal design determines whether compensation stabilises or reproduces inflation
Iran’s fiscal problem is not simply that the government needs more resources, but that the method used to obtain those resources changes the macroeconomic consequence of compensation.
If emergency transfers are funded through taxation on high-income groups or reduced non-essential expenditure, redistribution occurs without automatically increasing the money supply. If financed through domestic bonds purchased by private savers, the burden is shifted into future debt service. If financed through central-bank credit or monetary expansion, the government can increase nominal household purchasing power rapidly, but part of the real benefit can be eroded by the additional inflation generated through higher liquidity and expectations.
The resulting fiscal transmission chain can therefore be represented as:
external revenue loss → fiscal gap → financing choice → inflation effect → real transfer value → household protection
The key state-capacity question is not the nominal size of the transfer programme, but whether the financing architecture preserves its real value.
Fiscal financing options under wartime pressure
| Financing method | Immediate fiscal effect | Inflation risk | Distributional effect | Main institutional requirement |
|---|---|---|---|---|
| Expenditure reprioritisation | Frees resources without new debt | Low | Depends on what is cut | Strong budget control |
| Progressive taxation | Raises revenue | Low to moderate | Shifts burden upward | Tax administration and enforcement |
| Luxury/wealth-related taxation | Raises targeted revenue | Low | Concentrated on higher-income groups | Asset registry and valuation |
| Domestic bonds | Defers adjustment | Moderate depending on monetary conditions | Burden moved toward future taxpayers | Functioning debt market |
| Sovereign wealth withdrawals | Uses accumulated assets | Low immediate inflation if FX-backed | Intergenerational cost | Transparent reserve governance |
| External borrowing | Adds foreign resources | Low direct monetary effect | Future external debt service | Market access, currently restricted |
| Central-bank financing | Rapid liquidity creation | High in current conditions | Can initially support lower incomes but erodes real value broadly | Monetary-fiscal coordination |
| Reduction of universal subsidies | Reduces fiscal burden | Can raise administered prices | Regressive without compensation | Accurate household targeting |
A state with weak tax collection and constrained market borrowing has fewer non-inflationary choices, which means administrative capacity in taxation becomes part of inflation control rather than merely a revenue function.
Tax capacity becomes strategically important when oil revenue falls
An oil-exporting state can tolerate relatively weak direct taxation when hydrocarbon revenues finance a large portion of public expenditure, but once external revenue is constrained, the capacity to identify taxable income, wealth, property, profits and consumption becomes materially more important.
The relevant measure of resilience is therefore not only the tax rate written in law but the effective tax base, which depends on registries, digital invoicing, beneficial-ownership transparency, enforcement against evasion and the ability to distinguish productive investment from rent-seeking.
A wartime fiscal system that relies mainly on consumption taxes and administered price increases can shift the burden toward ordinary households because those instruments are easier to collect than taxes on hidden income or wealth. By contrast, taxes on high-value property, luxury vehicles, capital gains or concentrated profits require more sophisticated administrative information but can distribute more of the adjustment toward households with greater capacity to absorb it.
The supplied material correctly treats this as an allocation problem rather than an ideological choice, because narrowing exemptions, reducing non-essential expenditure, taxing luxury assets and pursuing large-scale evasion represent alternative channels through which fiscal adjustment can occur before further increases in broadly consumed goods.
Banking resilience determines whether temporary disruption becomes permanent productive loss
The banking system performs three functions during wartime scarcity that are often underestimated: it finances inventories while firms wait for foreign-exchange allocations, bridges the delay between shipment and sale, and allows otherwise viable businesses to survive temporary revenue interruptions.
Where banks are liquid and recapitalised, a manufacturer facing a three-month delay in imported components can borrow working capital and retain its workforce; where the banking system is itself stressed, the same delay can produce payroll arrears, supplier defaults and eventual closure.
Iran’s problem is compounded by its partial exclusion from conventional cross-border banking, because domestic banks may be able to create rial liquidity while still being unable to create the foreign currency required to pay an external supplier.
This distinction can be expressed as domestic liquidity versus external settlement capacity.
Banking functions under sanctions pressure
| Banking function | Domestic rial capability | Foreign-currency requirement | Consequence if unavailable |
|---|---|---|---|
| Payroll finance | High | None directly | Employment disruption |
| Inventory finance | High domestically | Often indirect | Reduced production |
| Import letter of credit | Limited | High | Trade delays |
| Supplier prepayment | Limited | High | Loss of foreign supplier |
| FX conversion | Constrained | High | Increased transaction cost |
| Trade insurance | Mostly external | High | Shipping refusal or higher premiums |
| Correspondent settlement | External | Very high | Payment failure |
| Emergency SME lending | Domestic | Low | Avoids otherwise preventable business failure |
This is why U.S. Treasury measures targeting correspondent banking relationships matter beyond the sanctioned entities themselves, because third-country banks can reduce exposure pre-emptively when secondary-sanctions risk increases. Treasury’s September designation of Russia’s VTB Bank specifically targeted its relationships with sanctioned Iranian banks and warned foreign financial institutions of additional sanctions exposure for continued dealings, increasing the incentive for international banks to de-risk even where individual transactions might not themselves be prohibited. U.S. Treasury — Operation Economic Outcast Sanctions Major Bank Helping Iran Evade Sanctions, 14 September 2026
Shadow banking reduces isolation but increases transaction friction
Iran’s use of exchange houses, front companies, alternative settlement networks and digital assets provides an adaptive mechanism against conventional financial isolation, but adaptation is not equivalent to efficiency.
Every additional intermediary can impose a fee, delay settlement, increase counterparty risk, reduce legal recourse and create another point at which funds can be frozen, diverted or lost. Even when sanctions-evasion networks successfully move money, the economic cost of each transaction can therefore remain materially higher than conventional correspondent banking.
Treasury’s August action against what it called Iran’s “clandestine currency networks” alleged that these networks were moving hundreds of millions of dollars across multiple jurisdictions while suffering from corruption and mismanagement; the claims concerning corruption originate from the U.S. government and should be treated as attributed assertions, but the documented pattern of reliance on multi-jurisdictional intermediaries itself demonstrates the additional complexity imposed on Iranian settlement channels. U.S. Treasury — Treasury Dismantles Iranian Regime’s Global Clandestine Currency Networks, 7 August 2026
The September designation of an Iranian digital-asset platform further shows that alternative payment technology does not automatically remove sanctions exposure, because Treasury explicitly extended enforcement toward digital-asset infrastructure that it says was used for sanctions evasion. U.S. Treasury — Operation Economic Outcast Disrupts Digital Asset Exchange Enabling the Iranian Regime, 17 September 2026
Cost stack created by non-standard settlement
| Friction layer | Conventional trade channel | Sanctions-constrained channel | Economic effect |
|---|---|---|---|
| Payment bank | Direct correspondent | Multiple intermediaries | Higher fees |
| Currency conversion | Liquid FX market | Exchange house / indirect conversion | Wider spread |
| Legal documentation | Standard banking contract | Layered ownership and complex settlement | Higher compliance cost |
| Settlement speed | Hours to days | Potentially days to weeks | Inventory financing burden |
| Counterparty protection | Strong legal recourse | Limited or opaque | Higher risk premium |
| Insurance | Standard coverage | Restricted insurer pool | Higher freight cost |
| Payment certainty | High | Lower | Supplier demands prepayment |
| Asset-freeze risk | Low in normal trade | Material | Embedded sanctions premium |
Administrative speed becomes an economic resource
When supply conditions are normal, a customs delay of several days is inefficient; during a wartime shortage of insulin, animal feed or industrial components, the same delay can become economically material.
Administrative capacity therefore becomes part of national productive capacity because customs authorities, standards agencies, ports, health regulators, central banks and ministries must process priority imports fast enough to prevent avoidable shortages.
The relevant performance metric should be time from foreign-exchange approval to domestic market release, because this captures the entire administrative chain rather than a single ministry’s processing time.
Administrative throughput chain
| Stage | Normal administrative task | Wartime vulnerability | Decision-useful metric |
|---|---|---|---|
| Import licence | Verify eligibility | Queue accumulation | Median approval time |
| FX approval | Allocate currency | Scarcity and prioritisation dispute | Days from application to allocation |
| Supplier settlement | Transfer funds | Banking delay | Settlement completion time |
| Shipment | Move cargo | Insurance/security disruption | Transit time |
| Border arrival | Register cargo | Port congestion | Dwell time |
| Inspection | Health/customs checks | Capacity constraint | Hours/days per priority category |
| Release | Customs clearance | Documentation delay | Clearance time |
| Distribution | Deliver inland | Fuel/road bottlenecks | Time to regional warehouse |
A system that publishes these metrics by commodity category can distinguish genuine external shortages from delays produced by domestic bureaucracy.
Trade corridors reduce concentration risk but cannot fully replace maritime capacity
Iran’s most important structural adaptation is the expansion of northern and Eurasian trade routes, because they diversify access away from southern maritime corridors and reduce dependence on a single chokepoint.
The full free-trade agreement between Iran and the Eurasian Economic Union entered into force on 15 May 2025, according to the Eurasian Economic Commission, creating a broader institutional framework for trade with Russia, Kazakhstan, Belarus, Armenia and Kyrgyzstan. Eurasian Economic Commission — Implementation of EAEU–Iran Free Trade Agreement, 22 May 2025
The strategic value of the agreement is not that it eliminates sanctions, but that it widens the number of commercially and politically viable suppliers and formalises lower-friction access to agricultural goods, industrial inputs and other products from northern markets.
The limits are equally important because land and Caspian routes face lower throughput, border transshipment, gauge changes in some rail corridors, limited rolling stock, port capacity constraints, seasonal conditions and multiple sovereign jurisdictions.
Strategic corridor comparison
| Corridor | Principal advantage | Principal constraint | Suitable cargo |
|---|---|---|---|
| Persian Gulf / southern ports | Highest bulk throughput | Maritime blockade and sanctions exposure | Oil, grain, bulk cargo |
| Caspian Sea | Access to Russia/Kazakhstan | Port and vessel limitations | Grain, commodities, regional trade |
| Turkmenistan–Sarakhs rail | Land access to Central Asia | Border capacity and transshipment | Containers, industrial goods |
| Kazakhstan–Uzbekistan–Turkmenistan | Links China/Central Asia to Iran | Multi-border complexity | Containers, machinery |
| Armenia route | Direct EAEU connection | Limited scale and geography | Regional goods |
| Azerbaijan / north-south corridor | Russia–Iran connectivity | Political and infrastructure dependencies | Mixed freight |
| Air cargo | Speed | Very high cost and aviation sanctions | High-value medical or urgent inputs |
The economic purpose of corridor diversification is therefore resilience rather than equivalence, because replacing a disrupted high-capacity maritime route entirely with rail and road is not realistic over short time horizons.
Corridor economics should be evaluated on delivered cost, not political symbolism
A new rail connection has limited economic value if transport, transshipment, border and financing costs make the delivered product unaffordable.
The appropriate metric is therefore:
landed cost = purchase price + transport + insurance + sanctions premium + financing cost + border cost + domestic distribution
This framework is important because tariff reductions under the EAEU agreement can reduce one component of cost while other components rise because of longer routes, more intermediaries or settlement friction.
Corridor evaluation framework
| Variable | Maritime route | Eurasian land route | Decision relevance |
|---|---|---|---|
| Unit freight cost | Normally lower for bulk | Usually higher | Determines commodity suitability |
| Volume capacity | Very high | Lower | Limits substitution |
| Transit time | Variable | Potentially competitive for containers | Important for high-value goods |
| Sanctions exposure | High | Still material through banks and insurers | Neither route eliminates financial restrictions |
| Border crossings | Fewer | Multiple | Administrative burden |
| Inventory requirement | Moderate | Potentially higher | Working-capital cost |
| Reliability | Chokepoint-sensitive | Border-policy-sensitive | Diversification benefit |
| Best use | Bulk energy and food | Selected high-value or strategic cargo | Complementary rather than total substitution |
Aviation restrictions increase the cost of moving high-value, time-sensitive goods
Air freight is economically small compared with sea and rail in tonnage, but strategically important for pharmaceuticals, electronics, precision components and urgent industrial spares.
The September 8 U.S. Treasury action sanctioned 36 aviation-sector targets and stated that it was targeting all remaining active Iranian airlines together with front companies, foreign intermediaries and procurement routes; the action therefore raises the sanctions-compliance burden around a transport mode particularly relevant to high-value and urgent cargo. U.S. Treasury — Treasury Grounds Iranian Airlines with Sweeping Sanctions Action, 8 September 2026
This does not establish that civilian medical air shipments are impossible, but it increases the importance of licensing clarity, third-country carriers and protected humanitarian channels, because risk-averse commercial actors may decline even transactions that remain legally permissible if compliance costs or uncertainty become too high.
Humanitarian exemptions are only effective if commercial channels remain usable
Formal exemption from sanctions does not guarantee physical delivery, because a pharmaceutical shipment may technically be permitted while the bank refuses settlement, the insurer refuses coverage, the shipping company avoids the route or the supplier demands prepayment.
The WHO’s statement that medical commodities were being sourced primarily from abroad while medicine shortages were looming demonstrates that the problem is simultaneously regulatory, financial and logistical rather than reducible to the legal status of humanitarian trade. WHO — Middle East Conflict Global Situation Report, 30 April 2026
The effectiveness of humanitarian channels should therefore be measured by completed deliveries, not licence availability.
Humanitarian trade execution test
| Question | Formal compliance measure | Real-economy measure |
|---|---|---|
| Is medicine legally exempt? | Licence or exemption exists | Supplier accepts order |
| Can it be paid for? | Transaction legally permissible | Bank executes transfer |
| Can it be shipped? | Cargo permitted | Carrier accepts booking |
| Can it be insured? | Insurance legally possible | Insurer issues cover |
| Can it clear customs? | Import authorised | Cargo released rapidly |
| Can patients obtain it? | National stock exists | Pharmacy/hospital availability |
State capacity depends on sequencing, not merely spending
A government can allocate large nominal sums while still producing poor outcomes if interventions occur in the wrong sequence.
For example, paying households before increasing staple supply can increase demand against a fixed quantity of food and push prices upward; imposing a price ceiling before compensating producers can reduce supply; increasing fuel prices before expanding public transport can impose mobility costs that workers cannot avoid; and restricting imports before domestic substitutes are ready can create scarcity rather than industrial upgrading.
The effectiveness of wartime administration therefore depends on linking interventions in sequence.
Example of sequencing logic
| Policy action | Precondition | Risk if implemented alone |
|---|---|---|
| Food price ceiling | Guaranteed supply and producer compensation | Shortage and black market |
| Transfer increase | Adequate retail supply | Additional price pressure |
| Fuel subsidy reduction | Targeted transport compensation | Freight and commuting shock |
| Import restriction | Verified domestic substitute | Production disruption |
| FX liberalisation | Household safety net | Sudden essential-goods inflation |
| Credit tightening | Supply stabilisation | Business failures |
| Tax increase | Income/asset targeting | Regressive consumption compression |
| Strategic stock release | Transparent replenishment plan | Temporary relief followed by deeper shortage |
Administrative credibility has a direct economic value
Credibility affects behaviour because households and firms alter decisions when they distrust official supply assurances.
If businesses expect future foreign-exchange restrictions, they accelerate import applications; if households expect future shortages, they increase precautionary purchases; if distributors expect new price controls, they may withhold stock; if producers expect delayed compensation, they reduce output.
This means that poor information policy can create a self-generated demand shock even when physical supply has not yet deteriorated proportionately.
The state therefore needs to publish credible information on strategic stocks, currency allocations, import arrivals and compensation schedules without disclosing operational details that would create security risks.
Credibility indicators
| Indicator | High-capacity signal | Low-capacity signal |
|---|---|---|
| FX allocation data | Regular category-level publication | Opaque ad hoc announcements |
| Strategic stocks | Audited range and replenishment plan | Unverifiable assurances |
| Transfer timetable | Predictable and indexed | Delayed discretionary payments |
| Customs clearance | Published priority-lane times | Persistent unexplained queues |
| Price controls | Time-limited with supply mechanism | Open-ended caps |
| Import priorities | Explicit commodity hierarchy | Case-by-case exceptions |
| Tax measures | Legally defined and measurable | Arbitrary collection |
| Emergency rules | Sunset clauses | Permanent exceptional powers |
The state faces a three-way allocation problem between households, production and defence
Scarce resources must ultimately be distributed across three broad national functions: maintaining household consumption, maintaining productive capacity and maintaining state security expenditure.
These categories are not independent because underfunding households can reduce labour productivity and social stability, underfunding production shrinks the future tax and supply base, and underfunding security can alter the strategic environment itself.
The appropriate framework is therefore not “civilian versus military spending” in the abstract, but marginal national-resilience value per unit of scarce resource.
National allocation triangle
| Allocation destination | Immediate benefit | Long-term risk if underfunded | Long-term risk if overfunded |
|---|---|---|---|
| Household essentials | Preserves consumption and social stability | Poverty, malnutrition, unrest, lower productivity | Fiscal strain if universally subsidised |
| Productive capacity | Preserves jobs, output and future supply | Deindustrialisation, shortages, unemployment | Resources locked in low-productivity firms |
| Security/defence | Preserves military capability | Strategic vulnerability | Crowding out of civilian resilience |
| Infrastructure | Maintains power, water, transport | Systemic production losses | Capital spending can crowd out emergency needs |
| Strategic reserves | Provides supply buffer | Severe exposure to blockade | Excess inventory and fiscal cost |
The key governance requirement is that the relative allocation across these functions should be auditable enough to establish that emergency scarcity is being managed deliberately rather than through administrative inertia.
State capacity can be measured through conversion efficiency
The most useful integrated concept is conversion efficiency, defined here as the proportion of scarce sovereign resources that successfully becomes usable household or productive capacity after accounting for financial, administrative and logistical leakage.
A dollar of oil revenue that remains frozen abroad has near-zero immediate domestic conversion efficiency; a dollar that is converted through multiple intermediaries at high cost has reduced conversion efficiency; a dollar allocated to medicine, paid successfully, shipped, cleared rapidly and delivered to hospitals has high conversion efficiency.
Conversion-efficiency chain
| Resource stage | Potential loss |
|---|---|
| Gross export revenue | Commercial discount |
| Settled foreign proceeds | Banking/intermediary fee |
| Convertible FX | Exchange spread |
| Approved import allocation | Administrative delay |
| Supplier invoice | Sanctions premium |
| Shipment | Freight/insurance premium |
| Border arrival | Customs delay |
| Domestic distribution | Transport/wholesale margin |
| Final household benefit | Retail leakage/inflation |
This framework explains why two states earning the same nominal foreign revenue can generate very different quantities of food, medicine or industrial output.
Key judgments
Foreign-exchange allocation has become the central wartime governance function because sanctions are increasingly targeting not only Iran’s ability to earn revenue but also the banking, exchange-house, correspondent and digital mechanisms required to make that revenue usable; Treasury’s 2026 actions against exchange houses, UAE banking channels, VTB and digital-asset networks demonstrate that the pressure architecture is explicitly moving deeper into the settlement chain. U.S. Treasury — Economic Fury Targets Iranian Shadow Banking Networks, 1 May 2026 U.S. Treasury — Iran’s Access to UAE Banks Targeted, 28 August 2026 U.S. Treasury — VTB Bank designation, 14 September 2026
Iran’s adaptation through shadow banking, exchange houses, non-dollar settlement and digital assets reduces the probability of complete financial isolation, but it does so at the cost of greater transaction complexity, higher intermediation risk and less transparent conversion between gross export revenue and usable domestic purchasing power.
The EAEU free-trade agreement gives Iran a real and institutionally meaningful diversification channel because it entered into force on 15 May 2025, but tariff liberalisation cannot by itself solve banking, insurance, settlement and physical-throughput constraints. Eurasian Economic Commission — EAEU–Iran free-trade implementation, 22 May 2025
Banking resilience should be measured through the ability to distinguish rial liquidity from foreign-currency settlement capacity, because domestic credit can prevent otherwise viable firms from failing while they wait for imports, but it cannot substitute for the foreign currency needed to pay an overseas supplier.
Fiscal resilience depends more on financing composition than nominal spending volume, because transfers funded through monetary creation can partially reproduce the inflation they are intended to offset, whereas tax enforcement, reprioritisation and domestic debt shift the burden through different channels.
Trade-corridor resilience depends on landed cost and throughput rather than on political announcements, because northern rail, road and Caspian routes provide diversification but cannot immediately replicate the scale and cost characteristics of southern maritime trade.
Administrative credibility has become a macroeconomic variable because opaque FX allocations, unpredictable transfers, customs delays and inconsistent emergency rules encourage hoarding and precautionary behaviour that can intensify shortages beyond the initial external shock.
What would change the assessment
The assessment would strengthen materially if sanctions enforcement continued expanding from trade and banking into additional third-country settlement, insurance and logistics channels, especially if foreign banks began withdrawing from otherwise lawful humanitarian and commercial transactions because of secondary-sanctions risk.
It would also strengthen if official Iranian data showed a growing divergence between gross export revenue and settled, domestically usable foreign exchange, because that would confirm that the binding constraint had moved from production and export toward financial conversion.
The assessment would weaken if Iranian authorities published timely commodity-level foreign-exchange allocation data showing sustained priority for food, medicines and industrial inputs, while customs clearance times shortened and shortages diminished despite continued external pressure.
A sustained rise in EAEU and Central Asian import volumes accompanied by lower delivered freight costs would demonstrate that northern corridors were moving from supplementary resilience channels toward partial structural substitutes for disrupted maritime trade.
A decline in pharmaceutical shortages despite continued sanctions would indicate that humanitarian payment and logistics mechanisms had improved sufficiently to break one of the most consequential household transmission channels.
Open official record
The most consequential missing official records are a monthly Iranian foreign-exchange allocation table by commodity and importer, the effective exchange rates attached to each allocation category, the share of oil and non-oil export proceeds actually repatriated and converted into domestically usable currency, the currency composition of settled trade receipts, current strategic inventories for medicines and staple foods, average customs clearance times for designated essential commodities, cargo volumes across Sarakhs, the Caspian ports and other northern corridors, domestic banking-sector exposure to state and quasi-state borrowers, emergency SME lending volumes, the financing composition of wartime transfers, and audited data on tax collection from high-income, property and corporate bases.
Without those records, the public evidence establishes that Iran faces a severe allocation problem and that the financial channels through which it converts external earnings into domestic supply are under increasing pressure, but it does not yet permit a defensible claim about the exact percentage of scarce foreign exchange being directed toward essential versus discretionary uses.
Iran’s Wartime Allocation Architecture: Foreign-Exchange Usability, State Capacity and the Conversion of Scarce Resources into Household Resilience
Principal judgment. Iran’s binding wartime economic constraint is no longer simply how many resources enter the national system, but whether the state can convert gross export earnings, fiscal capacity, banking liquidity and transport access into settlement-ready foreign exchange and then allocate it rapidly enough toward medicines, staple foods, agricultural inputs, industrial production and critical infrastructure. Foreign-exchange allocation has therefore become the central transmission valve between external pressure and household welfare.
Gross export revenue is not equivalent to usable foreign exchange
An exported cargo generates household-relevant value only if proceeds are settled, remain accessible, can be converted, reach importers, finance priority goods, clear customs and move through domestic distribution.
Foreign-exchange usability hierarchy
| Stage | What must occur | Principal constraint | Household relevance |
|---|---|---|---|
| 1. Export physically occurs | Oil / petrochemical / non-oil cargo leaves Iran | Maritime security, vessel access, sanctions exposure | No immediate benefit if proceeds remain inaccessible |
| 2. Buyer pays | Counterparty settles invoice | Currency, banking channel, sanctions screening | Determines whether revenue becomes usable |
| 3. Funds remain accessible | Iranian entity controls account/intermediary | Freeze risk, correspondent limits, de-risking | Restricted access reduces import capacity |
| 4. Currency can be converted | Yuan / dirham / other proceeds exchanged | Exchange houses, banks, liquidity | Allows payment to suppliers quoting in other currencies |
| 5. Payment reaches importer | Funds transferred to commercial user | Compliance, delay, secondary sanctions | Delay becomes inventory shortage |
| 6. Import is prioritised | State allocates FX among sectors | Criteria, political priority, transparency | Determines who receives scarce goods |
| 7. Goods clear customs | Cargo enters domestic market | Licensing, inspection, congestion | Financial allocation becomes real supply |
| 8. Distribution reaches retail | Goods move through domestic network | Fuel, freight, storage, regional bottlenecks | Determines final price and availability |
Scarce FX must be ranked by welfare and system-preservation value
| Priority tier | Typical imports | Failure consequence | Time tolerance | Allocation logic |
|---|---|---|---|---|
| Tier 1 • Life-preserving | Insulin, dialysis, oncology, vaccines, essential food | Mortality, morbidity, food insecurity | Days–weeks | Highest |
| Tier 2 • Production-preserving | Grain, feed, fertiliser, spares, chemicals | Supply contraction, unemployment, inflation | Weeks | High |
| Tier 3 • Infrastructure-preserving | Power, pumps, telecoms, transport spares | Outages, logistics disruption | Weeks–months | High, sequenced |
| Tier 4 • Strategic industrial | Machinery, selected capital goods | Lower future productive capacity | Months | Sector dependent |
| Tier 5 • Consumption-supporting | Non-essential consumer imports | Welfare inconvenience | Months | Lower |
| Tier 6 • Deferrable luxury | Premium vehicles, prestige imports | Limited macro-welfare effect | Long | Lowest emergency priority |
Minimum audit architecture for preferential foreign exchange
Preferential FX and electronic transfers solve different problems
| Dimension | Preferential FX | Electronic voucher / transfer |
|---|---|---|
| Point of intervention | Importer | Household |
| Main objective | Lower acquisition cost | Restore purchasing power |
| Main risk | Diversion / rent capture | Targeting error / inflation erosion |
| Transparency need | Importer, FX rate, volume, resale price | Beneficiary, transfer value, indexation |
| Market signal | Suppressed | Preserved |
| Physical-shortage solution | No | No |
| Extreme-inflation requirement | Strict enforcement | Frequent indexation |
The financing method determines whether compensation stabilises or recreates inflation
| Financing method | Immediate effect | Inflation risk | Distributional effect | Requirement |
|---|---|---|---|---|
| Expenditure reprioritisation | Frees resources | Low | Depends on what is cut | Strong budget control |
| Progressive taxation | Raises revenue | Low–moderate | Shifts burden upward | Enforcement capacity |
| Domestic bonds | Defers adjustment | Moderate | Future taxpayer burden | Functioning debt market |
| Sovereign wealth withdrawal | Uses assets | Low if FX-backed | Intergenerational cost | Reserve governance |
| Central-bank financing | Rapid liquidity | High | Short-term relief, broad real-value erosion | Monetary-fiscal coordination |
| Reduce universal subsidies | Cuts fiscal burden | Administered-price risk | Regressive without compensation | Accurate targeting |
Domestic rial liquidity cannot substitute for external settlement capacity
| Banking function | Domestic rial capability | FX requirement | Consequence if unavailable |
|---|---|---|---|
| Payroll finance | High | None directly | Employment disruption |
| Inventory finance | High domestically | Often indirect | Reduced production |
| Import letter of credit | Limited | High | Trade delay |
| Supplier prepayment | Limited | High | Loss of supplier |
| Correspondent settlement | External | Very high | Payment failure |
| SME emergency lending | Domestic | Low | Avoidable firm failure |
Adaptation reduces isolation but raises transaction costs
Administrative speed becomes a measurable economic resource
| Stage | Normal task | Wartime vulnerability | Decision-useful metric |
|---|---|---|---|
| Import licence | Verify eligibility | Queue accumulation | Median approval time |
| FX approval | Allocate currency | Scarcity / prioritisation dispute | Days to allocation |
| Supplier settlement | Transfer funds | Banking delay | Settlement completion time |
| Border arrival | Register cargo | Port congestion | Dwell time |
| Inspection / clearance | Health / customs checks | Capacity constraint | Hours / days per priority category |
| Distribution | Deliver inland | Fuel / road bottlenecks | Time to regional warehouse |
Diversification improves resilience, but does not replicate maritime scale
| Corridor | Principal advantage | Principal constraint | Suitable cargo |
|---|---|---|---|
| Persian Gulf / southern ports | Highest bulk throughput | Blockade / sanctions exposure | Oil, grain, bulk cargo |
| Caspian Sea | Russia / Kazakhstan access | Port / vessel limitations | Grain, commodities, regional trade |
| Turkmenistan–Sarakhs rail | Land access to Central Asia | Border capacity / transshipment | Containers, industrial goods |
| Central Asia route | China / regional connectivity | Multi-border complexity | Containers, machinery |
| Azerbaijan / North–South | Russia–Iran connectivity | Political / infrastructure dependence | Mixed freight |
| Air cargo | Speed | Very high cost / aviation sanctions | Urgent medical / high-value inputs |
Delivered cost matters more than political symbolism
Tariff liberalisation can reduce one component of delivered cost while longer routes, more intermediaries, financing friction and border delays increase others. Northern corridors therefore provide resilience through diversification rather than one-for-one replacement of maritime capacity.
Legal exemption is not equivalent to completed delivery
State capacity depends on order of operations, not nominal spending alone
| Policy action | Required precondition | Risk if implemented alone |
|---|---|---|
| Food price ceiling | Guaranteed supply + producer compensation | Shortage / black market |
| Transfer increase | Adequate retail supply | Additional price pressure |
| Fuel subsidy reduction | Transport compensation | Freight / commuting shock |
| Import restriction | Verified domestic substitute | Production disruption |
| FX liberalisation | Household safety net | Essential-goods inflation |
| Strategic stock release | Replenishment plan | Temporary relief followed by deeper shortage |
Information quality has direct macroeconomic value
Households, production and security compete for the same scarce national resource base
The integrated measure of wartime state capacity
Conversion efficiency is the proportion of scarce sovereign resources that successfully becomes usable household or productive capacity after financial, administrative and logistical leakage.
Six controlling judgments
Foreign-exchange allocation has become the central wartime governance function because pressure increasingly targets the conversion and settlement chain, not merely exports.
Shadow banking and non-dollar settlement reduce complete isolation but introduce additional fees, risk, delay and opacity.
The EAEU free-trade agreement provides genuine diversification, but cannot by itself solve banking, insurance or throughput constraints.
Domestic banking resilience must be separated from external settlement capacity: rial liquidity can preserve firms, but cannot pay foreign suppliers.
Fiscal resilience depends on financing composition because monetised transfers can partially reproduce the inflation they are meant to offset.
Administrative credibility is itself a macroeconomic variable because opacity, delay and inconsistent rules can induce precautionary behaviour that worsens scarcity.
Records required for a full allocation audit
- Monthly FX allocation by commodity and importer.
- Effective exchange rate attached to each category.
- Share of export proceeds actually repatriated and converted into usable currency.
- Currency composition of settled trade receipts.
- Strategic medicine and food inventories.
- Priority customs-clearance times.
- Cargo volumes through Sarakhs, Caspian and northern corridors.
- Financing composition of wartime transfers and audited tax-collection data.