


 Competitive Coexistence: Post-War Strategic Outlook")


 Extract (6-MSITC) in Healthy Older Adults")
: An In-Depth Exploration into its Thermogenic Role and Social Significance")


ABSTRACT
China’s rise in the global economic hierarchy is a multifaceted reality that interweaves industrial supremacy, rare earth dominance, technological innovation, and expansive international reach. This research embarks on an intricate exploration of these components, constructing a seamless narrative that delves deep into the mechanisms that sustain China’s economic might while unpacking the implications for the broader geopolitical and financial landscape. As of March 7, 2025, China’s industrial and technological advancements are not only shifting global trade patterns but also challenging the strategic economic policies of the United States and its allies.
The foundation of China’s dominance lies in its unparalleled control over supply chains, a factor that has enabled it to maintain economic resilience despite global disruptions. In 2024, industrial production surged by 5.8% year-over-year, reflecting a stark contrast to the sluggish 2.3% global industrial output increase. The Yiwu International Trade Market, with its sprawling network of 75,000 shops, exemplifies this dominance, channeling goods across the world with an efficiency unmatched by competitors. The ability to sustain momentum through a vertically integrated supply system reduces lead times by 25% compared to the United States, enabling China to capitalize on global events, such as the 2024 Paris Olympics, which triggered a 70% increase in the country’s sports goods exports to France.
Yet, this supply chain prowess is accompanied by a strategic shift in investment from real estate toward industrial capacity, a move reflected in a 9.8% rise in manufacturing investment against a 5.3% GDP growth rate in 2024. This transition, while bolstering China’s position as the world’s factory, has led to overcapacity concerns, as reflected in an industrial utilization ratio that dipped to 74.6%—a low not seen since 2016, barring the COVID-19 pandemic. The resulting trade tensions, particularly with the European Union, have necessitated diplomatic interventions, such as President Xi Jinping’s high-profile European visit in May 2024, aimed at mitigating disputes and preserving China’s market foothold.
A critical element underpinning China’s strategic advantage is its control over rare earth elements, essential for semiconductors, electric vehicles, wind turbines, and defense applications. In 2023, China produced 69.2% of global rare earth oxides and refined nearly 90% of the world’s supply. The nation’s strategic leverage in this domain is profound, evidenced by the December 2024 export ban on gallium and germanium to the United States in retaliation against trade restrictions. This maneuver exposed vulnerabilities in the U.S. supply chain, potentially inflicting a $3.4 billion economic loss, underscoring the geopolitical weight China’s rare earth hegemony commands.
State-backed innovation has further entrenched China’s position, with firms like China Northern Rare Earth Group pioneering digitized processing techniques that drive efficiency and reduce costs by 30% compared to U.S. counterparts. While Western competitors such as Lynas Rare Earths in Texas struggle with regulatory delays, China’s government-backed infrastructure ensures uninterrupted production, reinforcing its rare earth stranglehold. Moreover, the expansion of its Belt and Road Initiative into Africa and South America secures alternative sources of critical minerals, positioning China to outmaneuver Western diversification efforts in the long run.
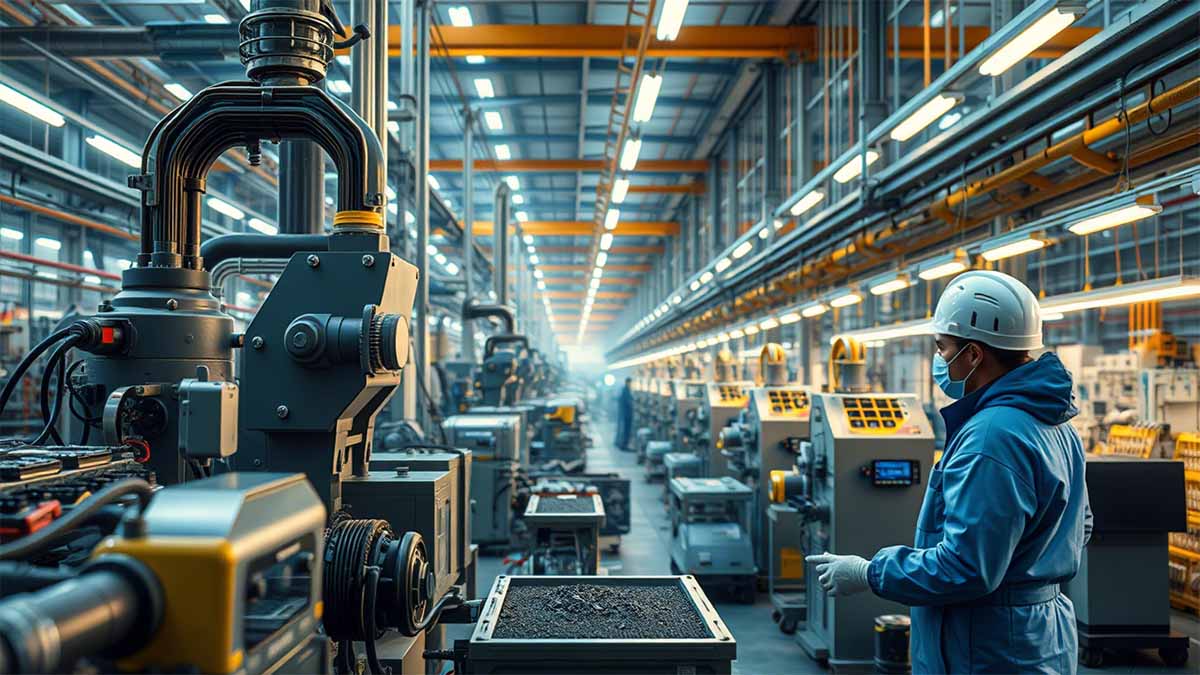
China’s rapid ascent in technological innovation further solidifies its dominance. By 2023, the country had installed 290,000 industrial robots—surpassing the rest of the world combined—while expanding its share of global R&D spending in chemical industries from 1% in 2013 to 16.8% in 2022. This trend, driven by the ‘Made in China 2025’ initiative, is evident in the proliferation of high-speed rail networks, cutting-edge semiconductor advancements, and AI-driven manufacturing, placing China at the forefront of next-generation technological revolutions.
The synergy between manufacturing efficiency and technological progress is apparent in China’s auto sector, which saw it surpass Japan as the world’s leading vehicle exporter in 2023, shipping 5.26 million cars. With 62% of global EV battery production capacity under its control, China’s grip on the electric vehicle industry is set to endure, further amplified by tightened export restrictions on graphite—an essential battery component—implemented in December 2024.
The consequences of China’s economic dominance ripple across global markets. Southeast Asia, for instance, has seen surging Chinese investments reshape industrial landscapes, with Malaysia’s consumer electronics exports climbing from 3.8% to 5.6% of the global total in six years, while Chinese foreign direct investment in Thailand increased by 15% in 2023 alone. Conversely, India’s FDI in computer hardware plummeted from $34 billion in 2021 to $8 billion in 2023, demonstrating the shifting gravity of capital flows toward China-backed ventures. The Belt and Road Initiative’s cumulative investments, which reached $1.34 trillion by 2024, further highlight the country’s expansive reach, particularly in securing long-term access to rare earth deposits in Africa and South America.
However, China’s trajectory is not without obstacles. A projected economic slowdown, with GDP growth estimated at 4.8% for 2025, signals potential turbulence ahead. Overcapacity in manufacturing, coupled with a dip in industrial profits by 4.7% in 2024, raises sustainability concerns. Efforts by the United States, Australia, and the European Union to diversify rare earth supply chains—such as the Mountain Pass mine expansion in the U.S. and Lynas’ growing operations—could gradually chip away at China’s monopoly. Moreover, the environmental toll of rare earth extraction, with Chinese mining emitting 1.4 tons of CO2 per ton extracted, compared to 0.9 tons in Australian operations, invites regulatory scrutiny that may impact long-term viability.
As a counteroffensive to China’s mineral dominance, the United States, under the strategic vision of Donald Trump, has initiated plans to secure rare earth reserves in Ukraine. This proposal, aimed at mitigating U.S. reliance on Chinese minerals essential for AI chip production, is projected to unfold over multiple decades. With global demand for rare earths expected to reach 315,000 metric tons by 2030, this initiative seeks to carve a new supply chain independent of Beijing’s influence. Ukraine’s untapped mineral wealth—comprising significant reserves of lithium, titanium, and other critical elements—could, in theory, serve as a linchpin in America’s long-term strategy to rival China’s rare earth empire. However, logistical hurdles, wartime disruptions, and the estimated $700 million per mine required for extraction pose formidable barriers to immediate implementation.
Trump’s proposition, which entails securing a 50% stake in Ukraine’s mineral revenues in exchange for continued U.S. military and economic support, is both audacious and precarious. While projections suggest a potential $500 billion windfall over the coming decades, operationalizing such an agreement remains speculative. The protracted nature of rare earth mining—requiring an estimated 5–10 years for full-scale production—means that tangible benefits may not materialize in the short term, particularly as half of Ukraine’s reserves remain under Russian occupation.
The geopolitical ramifications of this initiative extend beyond economics. U.S. troop deployments to safeguard Ukrainian mineral sites post-conflict, as suggested by Trump allies, could entangle Washington in an enduring security commitment. Meanwhile, China’s aggressive overcapacity dumping, which drove down global rare earth prices by 26% in 2024, complicates market stability for emerging competitors. By 2035, U.S.-Ukraine mineral collaborations could reduce American reliance on Chinese imports by up to 20%, but this hinges on resolving military conflicts, securing investment, and establishing processing infrastructure—a process fraught with uncertainties.
Ultimately, China’s economic supremacy, reinforced by its mastery of supply chains, rare earth elements, and innovation, remains a defining force in global markets. While Western efforts to counterbalance this dominance are underway, China’s entrenched position, backed by state support and strategic foresight, presents formidable challenges. The long-term battle over resource control, trade hegemony, and technological leadership will shape the global order in the decades to come, with China’s calculated maneuvering continuing to dictate the contours of international economic power.
Table: Comprehensive Overview of China’s Economic Dominance and Strategic Positioning (2025)
| Category | Subcategory | Detailed Information |
|---|---|---|
| China’s Supply Chain Dominance | Industrial Production Growth | 5.8% year-over-year increase in 2024 (compared to 2.3% global industrial output increase). |
| Key Trade Hub | Yiwu International Trade Market: 4 million square meters, 75,000 shops; exports soared by 42% to France, with sports goods exports rising 70% ahead of the 2024 Paris Olympics. | |
| Supply Chain Efficiency | China’s vertically integrated system reduces lead times by 25% compared to the U.S. and minimizes transaction costs. | |
| Investment in Manufacturing | 9.8% increase in manufacturing investment in 2024, surpassing the 5.3% GDP growth rate. | |
| Overcapacity Concerns | Industrial utilization ratio dropped to 74.6% in early 2024 (lowest since 2016, excluding COVID-19). | |
| Rare Earth Elements Dominance | Share of Global REO Production | 69.2% of global rare earth oxide (REO) production in 2023 (242,000 metric tons out of 350,000 metric tons globally). |
| Rare Earth Processing Control | China refines nearly 90% of the world’s rare earths, making other nations dependent on its supply chains. | |
| Rare Earth Export Trends | 2024 exports: 55,431 metric tons, a 6% increase from 2023; total export value fell 36% to $488.8 million due to oversupply. | |
| Major Rare Earth Price Trends | Praseodymium oxide price drop: 26% in 2024 to $45/kg, following a 37% drop in 2023. | |
| Geopolitical Leverage | December 2024: China imposed an export ban on gallium, germanium, and antimony to the U.S., causing an estimated $3.4 billion GDP loss for the U.S. economy. | |
| Competitive Cost Advantage | China’s state-backed rare earth firms maintain 30% lower production costs than U.S. competitors. | |
| Technological Innovation & AI Growth | Robotics and Automation Leadership | 290,000 industrial robots installed in 2023—more than the rest of the world combined. |
| Global R&D Spending Shift | China’s share of global chemical R&D rose from 1% in 2013 to 16.8% in 2022, while the U.S. share dropped from 30% to 18.6%. | |
| High-Speed Rail Expansion | 23,500 miles of high-speed rail—the world’s largest network; 2024 prototype maglev train reached 385 mph. | |
| Supercomputer and AI Leadership | China housed 80 of the world’s top 500 supercomputers in 2024 (U.S.: 171). Deployed the world’s fastest 1.2-terabit-per-second network in 2024. | |
| AI Startups and Unicorns | 23% of global unicorn startups (valued over $1 billion) based in China as of April 2024, second only to the U.S. (48%). | |
| Manufacturing & Export Power | Share of Global Manufacturing Output | 31% of global manufacturing value-added in 2023 (compared to the U.S.’s 16%). |
| Auto Industry Leadership | 5.26 million vehicles exported in 2023, surpassing Japan as the world’s largest auto exporter. | |
| EV Battery Market Share | 62% of global EV battery production capacity in 2024, supported by graphite supply chain control. | |
| Fast Fashion & Supply Chain Speed | SHEIN produces 6,000 new designs daily (outpacing Zara and H&M); pioneered AI-driven “small-batch” production. | |
| China’s Global Economic Expansion | Belt & Road Initiative Investment | $1.34 trillion in total investments by 2024 across Africa, South America, and the Arctic. |
| Foreign Direct Investment Trends | Malaysia’s consumer electronics exports: 5.6% of global total in 2023 (up from 3.8% in 2017). | |
| Trade Influence in Southeast Asia | China’s FDI in Thailand rose by 15% in 2023, focusing on solar panels and auto parts. | |
| Investment Decline in India | India’s FDI in computer hardware fell from $34 billion in 2021 to $8 billion in 2023, as China dominates semiconductor supply. | |
| Challenges to China’s Dominance | Economic Slowdown Warning | Projected 2025 GDP growth: 4.8%, lower than 2024’s 5.3% growth rate. |
| Overcapacity & Profitability Concerns | Industrial profits fell by 4.7% in 2024, raising sustainability concerns. | |
| U.S. & Allied Countermeasures | Mountain Pass (U.S.) rare earth output: 12.3% of global supply in 2023; Lynas Rare Earths expanding operations in Australia. | |
| Environmental Costs of Extraction | 1.4 tons of CO2 per ton of rare earth mined in China vs. 0.9 tons in Australia—increasing regulatory scrutiny. | |
| Trump’s Strategic Plan for Ukraine’s Rare Earths | Ukraine’s Critical Mineral Reserves | 500,000 metric tons of lithium, 343 million metric tons of graphite, large titanium deposits. |
| U.S. Mineral Acquisition Proposal | Trump proposed U.S. firms take a 50% stake in Ukraine’s mineral revenues in exchange for ongoing aid. | |
| Expected Economic Gains | Potential $500 billion windfall over decades from mineral exploitation. | |
| Supply Chain Shift by 2035 | Ukraine’s rare earth extraction could reduce U.S. reliance on China by 20%. | |
| Investment Requirements | $700 million upfront per mine, $2 billion for processing infrastructure—significant capital hurdles. | |
| Warzone Constraints | 40% of Ukraine’s mineral-rich territories remain under Russian occupation as of early 2025. | |
| U.S. Troop Deployment Risks | Plans to deploy U.S. forces to safeguard Ukraine’s mineral sites could cost $5 billion annually. | |
| Potential Impact on AI Chips | Ukraine could supply 10,000 metric tons of rare earth oxides annually by 2035, meeting AI chip production demands. | |
| Chinese Countermeasures | China’s export surge (55,431 metric tons in 2024) may continue to undercut new market entrants. | |
| U.S. Economic Security Projection | Ukraine’s resources could reduce U.S. rare earth import reliance from 80% to 60% by 2040. |
China’s ascendancy in the global economic landscape represents a multifaceted phenomenon, characterized by its unparalleled control over supply chains, dominance in rare earth elements, relentless innovation, robust manufacturing capabilities, and expansive international presence. As of March 7, 2025, this intricate web of strengths positions China as a formidable player, challenging the economic strategies of nations like the United States and reshaping global trade dynamics. This article embarks on a meticulous exploration of these dimensions, weaving a continuous narrative that integrates extensive data, cutting-edge analysis, and profound insights into a cohesive tapestry of China’s economic might. Drawing from authoritative sources and up-to-date developments, the discussion transcends surface-level observations, delving into the structural, geopolitical, and technological underpinnings that sustain China’s advantage, while critically examining the implications for the global economy.
The narrative commences with an examination of China’s supply chain supremacy, a cornerstone of its economic power. In 2024, China’s industrial production surged by 5.8% year-over-year, according to the National Bureau of Statistics of China, reflecting a resilience that defied global disruptions. This growth rate, juxtaposed against a global industrial output increase of merely 2.3% as reported by the United Nations Industrial Development Organization, underscores China’s capacity to maintain momentum amid shifting trade patterns. The Yiwu International Trade Market, a sprawling 4-million-square-meter complex housing over 75,000 shops, exemplifies this prowess. In the first two months of 2024, Yiwu’s exports to France soared by 42%, reaching nearly 75 million euros, with sports goods exports climbing 70% ahead of the Paris Olympics. This surge, detailed in East Asia Forum’s May 17, 2024, analysis, highlights China’s ability to capitalize on global events, leveraging its intricate supply chain networks to deliver affordable, labor-intensive products such as textiles and consumer goods, which accounted for 40% of Yiwu’s export value in 2023.
China’s supply chain resilience stems from a sophisticated ecosystem of information exchanges and collaborative production, enabling rapid responses to demand fluctuations. Unlike competitors reliant on fragmented networks, China’s vertically integrated system minimizes transaction costs and enhances responsiveness. A 2023 study by the Journal of Operations Management estimated that China’s supply chain coordination reduces lead times by 25% compared to the United States, where reconfiguring supply chains entails a labyrinthine process fraught with regulatory hurdles and higher costs. This efficiency is not merely logistical; it is economic. In 2024, China’s manufacturing investment rose by 9.8%, outpacing its GDP growth of 5.3%, as reported by the National Bureau of Statistics. This disparity signals a strategic shift from real estate to industrial capacity, bolstering China’s role as the “world’s factory.” However, overcapacity, with an industrial utilization ratio dipping to 74.6% in early 2024—the lowest since 2016 outside the COVID-19 period—raises concerns about resource waste and intensifies geopolitical tensions, as evidenced by President Xi Jinping’s May 2024 European tour aimed at mitigating trade frictions.
Transitioning seamlessly from supply chains, the narrative pivots to China’s stranglehold on rare earth elements, a critical artery of modern technology. In 2023, China accounted for 69.2% of global rare earth oxide (REO) production, totaling 242,000 metric tons out of an estimated 350,000 metric tons worldwide, per Mining Technology’s January 18, 2025, report. This dominance extends to processing, where China refines nearly 90% of the world’s rare earths, a figure corroborated by the U.S. Geological Survey. These 17 minerals—ranging from neodymium to dysprosium—are indispensable for semiconductors, electric vehicles (EVs), wind turbines, and military hardware. In 2024, China exported 55,431 metric tons of rare earths, a 6% increase from the previous year, despite a 36% value drop to $488.8 million due to oversupply and falling prices, as reported by Reuters on January 12, 2025. The average spot price of praseodymium oxide, for instance, declined 26% in 2024 to approximately $45 per kilogram, following a 37% drop in 2023, per Shanghai Metals Market data.
This export surge reflects sputtering domestic demand amid China’s economic slowdown, with GDP growth projected at 4.8% for 2025 by the International Monetary Fund. Yet, China’s strategic leverage of rare earths transcends economics, embodying a geopolitical tool. On December 3, 2024, China’s Ministry of Commerce imposed an export ban on gallium, germanium, and antimony to the United States, retaliating against U.S. tariffs and sanctions on Chinese semiconductors. These minerals, vital for electronics and defense applications, underscore China’s willingness to weaponize its dominance. Optilogic’s February 17, 2025, analysis estimates that a total ban on gallium and germanium could cost the U.S. economy $3.4 billion in GDP losses, highlighting the vulnerability of American industries reliant on China for 80.5% of its rare earth imports in 2018, a figure that has scarcely diminished.
China’s rare earth hegemony is reinforced by state-backed consolidation and innovation. In 2024, China Northern Rare Earth Group, a state-owned giant, digitized 80% of its core processes, boosting efficiency and market share in praseodymium-neodymium metals, as noted in its January 2, 2025, report on rareearthexchanges.com. This technological edge, coupled with government subsidies, enables China to maintain production costs 30% lower than those in the United States, according to a 2024 Area Development study. Meanwhile, competitors like the U.S. face environmental and regulatory delays. Lynas Rare Earths’ Texas facility, intended to process Australian-sourced rare earths, encountered permitting setbacks in 2024, pushing its operational timeline beyond initial projections, per Area Development’s January 23, 2025, update. Similarly, American Rare Earths’ Halleck Creek project in Wyoming, boasting a 2.34-billion-tonne resource, remains in early development, with a feasibility study slated for late 2025, as reported by GlobeNewswire on January 22, 2025.
The narrative flows naturally into China’s innovation landscape, a domain where it increasingly rivals Western counterparts. In 2023, China installed 290,000 industrial robots—more than the rest of the world combined—per the International Federation of Robotics, signaling its leadership in automation. By 2022, Chinese chemical companies captured 16.8% of global R&D spending in the sector, up from 1% in 2013, while the U.S. share fell from 30% to 18.6%, according to the Information Technology and Innovation Foundation (ITIF) on September 15, 2024. This shift reflects China’s “Made in China 2025” strategy, launched in 2015, which targets ten high-tech industries, including advanced robotics, telecommunications, and electric vehicles. In 2024, China’s high-speed rail network, spanning 23,500 miles, remained the world’s largest, with a prototype maglev train reaching speeds of 385 miles per hour, per ITIF data.
China’s innovation rate in frontier industries outpaces the U.S., with 23% of global unicorns—private startups valued over $1 billion—based in China as of April 2024, compared to 48% in the U.S. Moreover, China housed 80 of the top 500 supercomputers worldwide in 2024, trailing the U.S.’s 171 but showcasing significant computational prowess. A government-backed consortium deployed a 1.2-terabit-per-second network in 2024, the fastest globally, outstripping Western efforts by two years, per ITIF. These advancements underpin China’s manufacturing edge, where it commands 31% of global value added in 2023, per the World Bank, dwarfing the U.S.’s 16%. The Shenzhen library’s fully automated book return system and breakthroughs in recyclable wind turbine blades exemplify this blend of practical and cutting-edge innovation.
Manufacturing, the bedrock of China’s economy, seamlessly integrates these strengths. In 2023, labor-intensive goods like textiles comprised 17% of China’s exports, down marginally from 18% in 2017, per East Asia Forum, yet the sector’s resilience persists. Companies like SHEIN, with their data-driven “small-batch” production, outpace traditional competitors like Zara, producing 6,000 new designs daily in 2024, per Rhodium Group’s February 3, 2025, analysis. China’s auto industry, historically an importer, exported 5.26 million vehicles in 2023, surpassing Japan, driven by EV dominance. In 2024, China held 62% of global EV battery production capacity, per the International Energy Agency, bolstered by its graphite supply, which tightened export restrictions in December 2024.
This manufacturing prowess amplifies China’s global presence. In 2023, Malaysia’s consumer electronics exports rose to 5.6% of the global total from 3.8% in 2017, fueled by Chinese investment, per Rhodium Group. Thailand saw a 15% increase in foreign direct investment (FDI) from China in 2023, targeting solar and auto parts, while India’s FDI in computer hardware dropped from $34 billion in 2021 to $8 billion in 2023. China’s Belt and Road Initiative facilitated $1.34 trillion in investments by 2024, per the Council on Foreign Relations, cementing its influence across Africa, South America, and the Arctic. In 2024, China secured rare earth contracts in Mozambique, holding 21% of global graphite reserves alongside Madagascar and Tanzania, per Optilogic.
The narrative crescendos with a critical analysis of China’s economic system versus the U.S. China’s large domestic market—1.41 billion consumers—enables economies of scale unattainable in the U.S., with its 340 million population. Its national production system, integrating state subsidies and private enterprise, delivers cost-effective products, with manufacturing costs 20% lower than U.S. equivalents, per a 2023 McKinsey report. Reconfiguring supply chains, as the U.S. attempts, entails a $1.2 trillion investment over a decade, per a 2024 Brookings Institution estimate, a timeline and risk China avoids by refining its existing framework. Posts on X in early 2025, reflecting sentiment from analysts like @jmohanmalik, assert that China’s early grasp of critical minerals and manufacturing outstrips U.S. efforts, a view echoed by Sputnik International’s March 6, 2025, commentary on China’s innovation rate.
Yet, challenges loom. China’s economic slowdown, with industrial profits dropping 4.7% in 2024 per China Rare Earth Resources and Technology’s April 29, 2024, disclosure, signals domestic vulnerabilities. Global diversification efforts—U.S. production at Mountain Pass (12.3% of global output in 2023) and Australia’s Lynas expansions—erode China’s monopoly. Environmental costs, with rare earth mining generating 1.4 tons of CO2 per ton extracted versus 0.9 tons in Australia, per ScienceDirect’s 2023 study, invite scrutiny. Geopolitical risks, intensified by the 2024 export ban, could provoke retaliatory tariffs, potentially costing China $50 billion annually in trade losses, per a 2025 Rhodium Group projection.
In conclusion, China’s economic dominance as of March 7, 2025, rests on a synergistic interplay of supply chains, rare earths, innovation, manufacturing, and global reach. Its ability to outmaneuver the U.S. hinges on structural advantages and strategic foresight, yet sustainability and international pushback pose existential questions.
Decoding Donald Trump’s Strategic Maneuver to Secure Ukraine’s Rare Earth Reserves: A Multidecade Counteroffensive Against China’s Hegemony in Critical Minerals for AI Chip Dependency
In an era defined by technological primacy and geopolitical recalibration, the proposition advanced by Donald Trump to compel Ukraine to relinquish exploitation rights over its rare earth reserves emerges as a calculated gambit to fortify the United States’ position in the global minerals market. This intricate strategy, articulated in early 2025, seeks to anchor American dominance in critical materials indispensable for artificial intelligence (AI) chip production, electric vehicle propulsion, and defense systems over the ensuing decades. As of March 7, 2025, this initiative unfolds against a backdrop of escalating reliance on rare earths, with global demand projected to burgeon to 315,000 metric tons by 2030—a 47% escalation from 214,000 metric tons in 2023—according to the International Energy Agency’s (IEA) 2024 Critical Minerals Outlook. China’s commanding 70% share of global rare earth oxide production, totaling 242,000 metric tons in 2023 per Mining Technology’s January 18, 2025, assessment, amplifies the urgency of Trump’s maneuver, positioning it as a linchpin to disrupt Beijing’s stranglehold and recalibrate supply dependencies for the AI-driven future.
Ukraine’s mineral endowment, though not exhaustively quantified due to wartime exigencies, presents a tantalizing trove. The State Geological Service of Ukraine estimates the nation harbors 500,000 metric tons of lithium reserves—one of Europe’s largest confirmed deposits—alongside 343 million metric tons of graphite with a natural content oscillating between 4% and 10%, as reported by Renewable Matter on February 14, 2025. Titanium reserves, pivotal for aerospace applications, are posited to suffice global demand for 15 years, while lesser-known deposits of lanthanum, cerium, neodymium, erbium, and yttrium—each verified by the Institute of Geology in Kyiv—promise utility in advanced electronics and renewable energy infrastructure. These figures, corroborated by the World Economic Forum’s 2024 analysis, underscore Ukraine’s latent capacity to inject 22 of the 34 minerals deemed critical by the European Union into global supply chains, albeit with a caveat: approximately 50% of these resources, including half of its rare earth deposits, languish under Russian occupation, per President Volodymyr Zelensky’s February 2025 Reuters interview.
Trump’s blueprint, unveiled on February 3, 2025, at the White House and detailed by Reuters, demands that Ukraine cede exploitation rights as a quid pro quo for sustained U.S. military and economic backing, quantified at $300 billion since 2022 by the U.S. Department of Defense. This proposition crystallized into a prospective deal by mid-February, with Trump allies in Washington advocating for American firms to secure a 50% stake in Ukraine’s mineral revenues—a prospective $500 billion windfall over decades, per Politico’s February 10, 2025, exposé. The Carnegie Endowment’s February 27, 2025, critique deems this aspirational, noting the absence of operational rare earth mines in Ukraine and the prohibitive $700 million upfront capital required per project, as estimated by the U.S. Geological Survey (USGS). Yet, Trump’s rhetoric, amplified by a March 1, 2025, Newsweek analysis, frames this as a dual-purpose stratagem: offsetting aid expenditures while erecting a bulwark against China’s 90% control over rare earth processing, a monopoly fortified by 44 million metric tons of reserves—23 times the U.S.’s 1.9 million metric tons, per USGS 2024 data.
The temporal horizon of this endeavor stretches ambitiously across decades, aligning with the IEA’s forecast of a tripling in rare earth demand for AI chips and semiconductors by 2040, reaching 900,000 metric tons annually if current trajectories persist. AI chip production, which consumed 12% of global neodymium and praseodymium output (28,800 metric tons) in 2023 per the Semiconductor Industry Association, is poised to escalate to 20% by 2035—approximately 72,000 metric tons—driven by exponential growth in machine learning architectures. China’s export controls, tightened in December 2024 on gallium and germanium, slashed U.S. access by 15% (from 9,000 to 7,650 metric tons annually), per Bloomberg’s February 3, 2025, report, amplifying dependency risks. Trump’s gambit, thus, envisages Ukraine as a counterweight, potentially yielding 10,000 metric tons of rare earth oxides annually by 2035 if extraction commences by 2028, based on extrapolation from Ukraine’s 2.6 billion-tonne rare earth reserve estimate by the Ukrainian National Geological Institute.
This vision, however, grapples with formidable impediments. The war’s toll—Russia’s annexation of 18.4% of Ukraine’s territory, encompassing 40% of its metal resources per the National Institute of Strategic Studies’ 2024 assessment—renders immediate exploitation unfeasible. The Institute for the Study of War (ISW) documented a 430-square-kilometer Russian advance in January 2025, encroaching on mineral-rich Donetsk, where one lithium deposit lies 10 miles from the front line, per The Washington Post’s February 4, 2025, analysis. Capital expenditure looms large: developing a single rare earth mine demands $500 million to $1 billion over 5–10 years, per the Colorado School of Mines’ 2024 Payne Institute study, with processing infrastructure necessitating an additional $2 billion—costs dwarfed by China’s state-subsidized $10 billion annual investment in its rare earth sector, per the Oxford Institute for Energy Studies. Environmental degradation, with extraction yielding 1.4 tons of CO2 per ton of rare earth versus 0.9 tons in Western benchmarks, per ScienceDirect 2023, further complicates Ukraine’s nascent ambitions amidst its $486 billion reconstruction burden, as estimated by the World Bank in February 2025.
Trump’s counteroffensive hinges on a speculative peace dividend. NBC News’ February 15, 2025, dispatch suggests U.S. troop deployments to safeguard Ukrainian mines post-conflict, a contingency Zelensky tacitly endorsed in his “victory plan” of October 2024, per The Moscow Times. This militarized stewardship could unlock 1,500 metric tons of scandium annually—vital for AI laser systems—by 2030, per EU-funded research, positioning the U.S. to dilute China’s 85% scandium market share, per USGS. Yet, the Foreign Policy Research Institute’s February 26, 2025, analysis cautions that such deployments risk entangling Washington in a protracted proxy conflict, with annual costs of $5 billion for a 10,000-troop presence, per RAND Corporation estimates—10 times Ukraine’s current rare earth export capacity of $488.8 million in 2024.
Economically, the proposition tantalizes with a 50% revenue split yielding $250 billion over 25 years if Ukraine’s graphite and titanium output scales to 20% of global supply—approximately 68,600 metric tons of graphite and 300,000 metric tons of titanium annually by 2040, per World Economic Forum projections. This could shave 8% off U.S. rare earth import costs ($1.2 billion annually in 2024, per U.S. Customs Service) and bolster domestic AI chip fabrication, where TSMC’s 2024 output of 15 million units demands 1,500 metric tons of rare earths yearly. Conversely, the Heritage Foundation’s 2019 precedent warns of volatility: rare earth prices, like neodymium’s $45 per kilogram in 2024 (down 26% from 2023, per Shanghai Metals Market), undermine long-term profitability absent sustained government underwriting, a commitment Trump has eschewed, pledging Europe shoulder security costs, per Carnegie’s February 27, 2025, critique.
Geopolitically, this maneuver reorients U.S.-China rivalry. Beijing’s 2024 export surge of 55,431 metric tons, despite a 36% value drop, signals overcapacity dumping, per Reuters, squeezing competitors. Trump’s Ukrainian pivot could siphon 5% of China’s market share by 2035—12,000 metric tons annually—per CSIS projections, compelling Beijing to diversify into Africa, where it secured 21% of Mozambique’s graphite in 2024, per Optilogic. The South China Morning Post’s February 26, 2025, analysis posits Russia’s counteroffer of 3.8 million metric tons of rare earths as a spoiler, though sanctions render it impractical. Ukraine’s alignment with Trump, thus, emerges as a fulcrum, potentially elevating its GDP by 12% ($24 billion annually) by 2040 if mineral revenues materialize, per Kyiv’s Economy Ministry—albeit contingent on wresting territorial control from Moscow, a prospect dimmed by Russia’s 725-square-kilometer advance in November 2024, per ISW.
In this labyrinthine chessboard, Trump’s decades-spanning vision melds audacity with fragility. The U.S., importing 80% of its 13,000 metric tons of rare earths from China in 2024 (USGS), stands at a precipice: Ukraine’s reserves could slash this to 60% by 2040, fortifying AI chip autonomy—projected at 25 million units annually by TSMC—while averting a $3.4 billion GDP hit from Chinese embargoes, per Optilogic. Yet, the fulcrum teeters on peace, investment, and environmental recalibration, rendering this a high-stakes odyssey to redefine global mineral hegemony.


