









Executive Summary
BLUF — Russia is not eliminating collapse risk; it is exchanging acute external vulnerability for prolonged structural dependence on fewer, more powerful partners.
The reported 318 EEF 2026 agreements worth nearly ₽7 trillion remain unverified by an accessible official post-forum document and are therefore excluded from the evidentiary baseline.
The verified macroeconomic picture is stagnationary: 0.0–1.0% GDP growth, 6.0–7.0% inflation, a 14% policy rate, and declining capital formation in 2026.
Moscow’s survival architecture rests on redirected commodity exports, state-directed investment, import substitution, Asian logistics and alternative payment rails.
The pivotal sectors through 2031 are energy, mining, defence-adjacent manufacturing, transport corridors, agriculture, nuclear technology, digital infrastructure and Arctic logistics.
China supplies market depth and industrial inputs but creates asymmetric dependence; India, ASEAN, the Gulf and Central Asia provide diversification without fully replacing Western capital and technology.
The most probable outcome is managed stagnation—not collapse or genuine convergence—with stronger strategic sectors but weaker civilian productivity.
The decisive variable is implementation: announcements and memoranda matter only when converted into financed projects, imported equipment, operating capacity and recurring cash flow.
Russia’s ₽7 Trillion Pivot: Survival Is Not Yet Growth
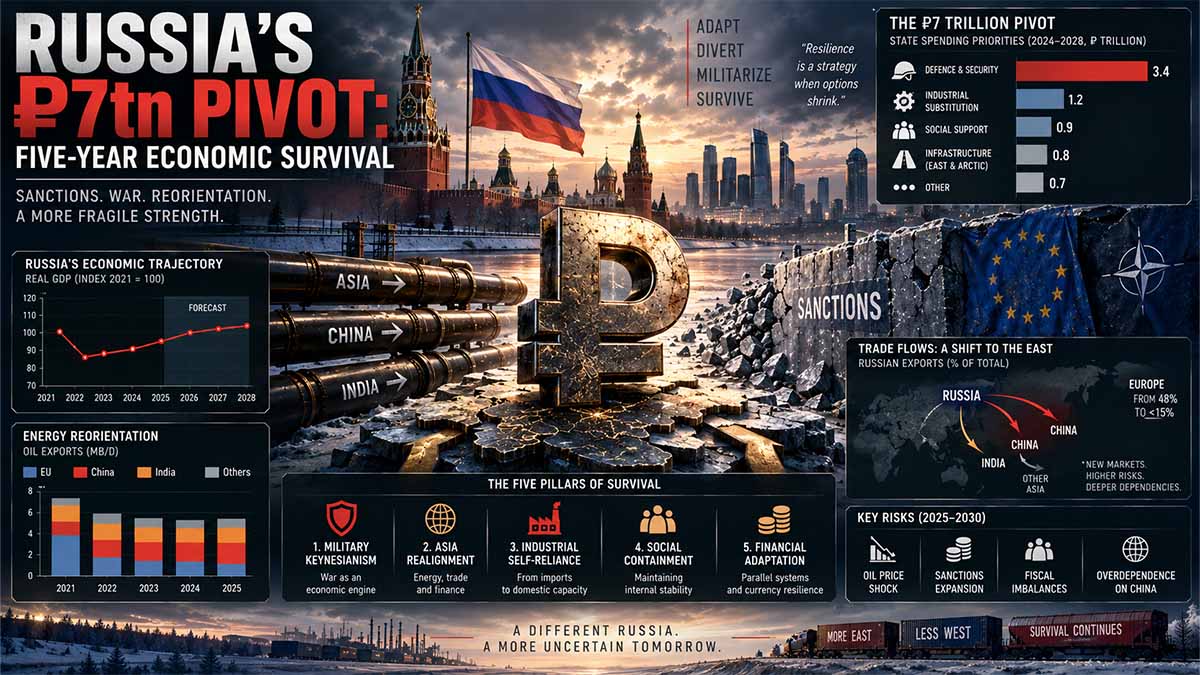
Russia has avoided the economic collapse widely anticipated after February 2022. It has not, however, solved the harder problem: transforming wartime resilience into sustainable development. The 318 agreements reportedly signed at the Eastern Economic Forum in Vladivostok, with a declared value approaching ₽7 trillion, advertise the scale of Moscow’s ambitions. But agreements are not factories, ports or cash flow. Behind the headline stands an economy growing by no more than 1%, carrying inflation of around 6%, financing itself at a 14% policy rate, and competing for an exceptionally scarce labour force. Russia’s five-year contest is therefore not simply against sanctions. It is against expensive capital, technological attrition, logistical friction and the possibility that its eastern opening produces new dependencies faster than it creates productive capacity.
The resilience paradox
Russia’s achievement is real but easily misread. The economy expanded by 4.9% in 2024, before growth slowed to 1.0% in 2025. On 13 August 2026, the Bank of Russia reduced its 2026 forecast to 0.0–1.0%, raised projected year-end inflation to 6.0–7.0%, and placed gross fixed-capital formation between a 1.5% contraction and 0.5% growth. Commentary on the Bank of Russia’s Medium-Term Forecast – Bank of Russia – August 2026.
This is neither collapse nor healthy expansion. It is a controlled, highly segmented equilibrium in which hydrocarbon receipts, public procurement, capital controls, domestic banks and state-directed credit protect strategic production, while high borrowing costs compress civilian investment. The Bank of Russia cut its policy rate to 14% on 24 July 2026, but still expected an average of 14.5–14.6% for the year and 10.5–12.5% in 2027. Bank of Russia Cuts the Key Rate by 25 Basis Points to 14.00% – Bank of Russia – July 2026.
The critical distinction is between financial liquidity and productive capital. Moscow can create rouble liquidity and direct lending. It cannot administratively manufacture advanced machine tools, industrial software, aircraft components, experienced engineers or commercially viable projects. Russia has preserved the circulation of money; it must now preserve the reproduction of capital.
The ₽7 trillion test
The EEF total should be treated as a project pipeline, not as realised investment. A forum agreement may be an enforceable construction contract, but it may also be a memorandum, financing framework, declaration of intent or expansion already contained in a public company’s investment plan. Nominal totals can include multiyear expenditure, debt, state guarantees and imported equipment. They do not reveal how much new productive capacity will remain in Russia.
The decisive sequence is more demanding: signature, legal commitment, verified counterparties, committed equity, committed debt, procurement, construction, commissioning and recurring revenue. A project contributes to economic expansion only as it crosses those gates. At a 14% policy rate, even commercially sound projects face a formidable financing hurdle unless they receive subsidised credit, regulated returns, export guarantees or direct budget support.
This makes conversion risk the central measure of the Vladivostok strategy. If half the announced value reaches physical construction and subsequent operation, the forum will have marked a material reallocation of Russian capital toward the Pacific. If most agreements remain political frameworks or state-supported commitments that would have proceeded anyway, ₽7 trillion will primarily measure diplomatic signalling. The Russian Ministry of Economic Development’s monitoring of concessions and public-private partnerships offers an institutional foundation, but credible assessment requires project-level disclosure of financing, guarantees, imported content and completion milestones. Monitoring of Concession and Public-Private Partnership Projects – Ministry of Economic Development of the Russian Federation – June 2026.
China’s leverage
China is indispensable because it combines everything Russia now needs most: commodity demand, industrial goods, machinery, vehicles, electronics, renminbi settlement and geographical proximity. Yet the relationship is asymmetric. Russia has leverage where it controls scarce resources; China has leverage where Russia confronts restricted alternatives.
That asymmetry will shape the economics of pipelines, mines, processing plants and technology localisation through 2031. Chinese involvement is most likely where long-term resource access, equipment exports or guaranteed offtake create a clear commercial return. Political alignment does not oblige Chinese banks to finance projects carrying disproportionate sanctions exposure or weak economics.
Replacement should not be confused with autonomy. Substituting Chinese machinery for European equipment can restore production, but it transfers dependence to a new supplier. Genuine technological sovereignty requires domestic design, manufacturing, maintenance and iterative improvement. Moscow has set a target of raising electronics-industry output to ₽6.3 trillion within six years. Government Meeting on Electronics-Industry Development – Government of the Russian Federation – September 2025. The relevant measures are not output value alone, but domestic intellectual property, fabrication capability, imported tooling, production yields and serviceability without foreign updates.
India and the wider portfolio
India gives Moscow an alternative large-scale energy market and a politically autonomous partner in nuclear power, fertilisers, pharmaceuticals, defence and transport. Its limitation is structural imbalance: Russia can sell far more oil and commodities than it presently buys in Indian goods. Bilateral growth is sustainable only if Russian export receipts can be converted, invested or recycled through larger imports of Indian pharmaceuticals, machinery, chemicals, food and services.
ASEAN offers something different: jurisdictional diversification. Vietnam, Indonesia, Malaysia, Thailand and Singapore provide distinct combinations of demand, manufacturing, maritime services and financial connectivity. But ASEAN is not a unified sanctions-neutral market. Banks and companies embedded in Western and Chinese supply chains assess compliance independently, particularly where electronics or dual-use products are involved.
The Gulf contributes capital, commodity trading, shipping, aviation and access to third markets. Yet Dubai, Abu Dhabi and Riyadh derive their usefulness from globally connected financial systems that they will not jeopardise without adequate compensation. Gulf institutions will fund assets with credible returns, collateral and exit options—not Russia’s geopolitical strategy as such.
Central Asia is the geographical hinge. Kazakhstan, Uzbekistan, Kyrgyzstan and neighbouring economies provide rail corridors, labour, warehousing, financial channels and access toward China, Iran and South Asia. Russia and Uzbekistan have set a target of 30 billion US dollars in bilateral trade by 2030. Russian–Uzbek Intergovernmental Commission Meeting – Government of the Russian Federation – April 2026. But Central Asian governments are pursuing their own partnerships with China, Europe, Türkiye and the Gulf. Moscow gains routes; the region gains bargaining power.
Corridors before commerce
Russia’s eastward turn will succeed only if diplomacy becomes infrastructure. The Northern Sea Route, the International North–South Transport Corridor, the Trans-Siberian Railway, the Baikal–Amur Mainline, Far Eastern ports and Caspian crossings are not interchangeable projects. Each addresses a different vulnerability.
The Northern Sea Route can support Arctic resource exports and reduce distance to parts of Asia, but it requires ice-class vessels, icebreakers, rescue capacity, hydrographic services and credible insurance. Rosatom, responsible for a central part of the federal development programme, reported a new cargo record in January 2025. New Record Set for Volume of Cargo Shipped Along the Northern Sea Route – Rosatom – January 2025. The commercial test is whether non-captive cargo grows without permanent exceptional subsidy.
The North–South corridor can connect Russia through the Caspian and Iran to Indian Ocean markets. Its success depends less on maps than on missing rail links, customs interoperability, port handling, wagon availability, insurance and payment. A corridor becomes an economic asset only when it reduces predictable door-to-door cost. Until then, it is strategic redundancy purchased at a premium.
The strategic sectors
Energy will preserve fiscal mass, but not necessarily its former rent. Oil can be redirected more readily than pipeline gas, although longer voyages, discounts, intermediary margins and insurance reduce the realised price. Gas requires fixed infrastructure and a committed buyer. Russia has stated that it could deliver as much as 100 billion cubic metres eastward after 2030. Alexander Novak: Russia to Deliver 100 bcm of Gas Eastward after 2030 – Government of the Russian Federation – October 2022. That ambition depends on pipelines, upstream investment and negotiated Chinese demand.
Mining offers nickel, palladium, aluminium, gold, uranium and other strategic materials, but exporting raw resources would reproduce the weakness Russia is trying to escape. The economic prize lies in refining, alloys and component manufacturing. Agriculture and fertilisers provide wider markets across Asia, Africa and the Middle East, yet remain dependent on machinery, seeds, breeding stock, chemicals and maritime logistics.
Nuclear power is the strongest integrated Russian export proposition. It combines reactors, engineering, fuel, training, maintenance and state finance over several decades. Rosatom’s 2025 sustainability reporting attributed 51% of Russia’s low-carbon electricity generation to the corporation and recorded ten domestic wind farms exceeding 1.1 GW. Sustainability Report 2025 – Rosatom – 2026. Russian-designed units under construction at China’s Tianwan site and nuclear cooperation with Uzbekistan demonstrate that Moscow can still export complex technological systems, not only commodities.
The sanctions learning cycle
Sanctions adaptation is not cost-free circumvention. It is a continuous contest in which Russia changes supplier, route, ownership, currency or product specification, while sanctioning authorities identify the new network and extend enforcement.
The European Commission’s consolidated record was updated on 23 July 2026 to include the EU’s twenty-first sanctions package, following earlier measures against the shadow-fleet ecosystem. Sanctions Adopted Following Russia’s Military Aggression Against Ukraine – European Commission – July 2026. The EU has also legislated a phased end to Russian gas imports, including LNG by 31 December 2026 and pipeline gas thereafter. Regulation 2026/261 on Phasing Out Russian Natural Gas Imports – European Union – January 2026.
The United States Commerce Department identifies 50 common high-priority items considered especially vulnerable to diversion to Russia. Common High Priority Items List – US Bureau of Industry and Security – 2026. The question is therefore not whether Russia can obtain individual components. It is whether it can secure them at the necessary scale, quality and timing, with warranties, software and replacement parts.
The shadow tax
Shadow shipping, opaque trading companies, smaller banks, national-currency settlement and re-export routes reduce the probability of an abrupt external stop. They simultaneously impose a shadow tax on the Russian economy. Older tankers require more maintenance. Complex ownership increases legal risk. Additional intermediaries demand margins. Longer routes immobilise working capital. Currency conversions widen spreads. Non-standard insurance raises exposure to accidents and port refusal.
The effectiveness of sanctions cannot therefore be inferred from export volume alone. A stable number of barrels may conceal declining net revenue after discounts, freight and commissions. Similarly, a payment that eventually settles may have required prepayment, multiple banks and weeks of delay. Those frictions reduce the capital available for productive investment.
Official Dutch analysis identified elevated diversion risks in trade patterns involving Armenia, Kazakhstan, Kyrgyzstan, Mongolia, Serbia, Türkiye and Turkmenistan, while warning that the observed patterns required further transaction-level assessment. Possible Circumvention of Sanctions Against Russia by Newer, Smaller Firms – Statistics Netherlands – December 2024. The next phase of enforcement will increasingly target networks—owners, managers, insurers, brokers and payment agents—rather than vessels or products in isolation.
Labour becomes strategy
Russia cannot finance its way out of the labour constraint. Seasonally adjusted unemployment stood at a record 2.1% in January 2026. Bank of Russia survey participants expected 2.2% unemployment and 10.4% nominal wage growth for the year. Macroeconomic Survey of the Bank of Russia – Bank of Russia – August 2026.
Low unemployment normally signals strength. In Russia’s present configuration it also signals minimal spare capacity. Defence production, construction, extraction, transport, healthcare and civilian industry compete for the same engineers, welders, programmers and machine operators. Higher wages can move workers between sectors; they cannot quickly create expertise.
This explains why strategic expansion may coexist with civilian deterioration. Directed credit and procurement attract labour toward protected sectors, while smaller manufacturers and public services struggle to retain personnel. Automation offers relief but requires precisely the capital goods and technologies whose acquisition has become more difficult. By 2031, skills may prove a tighter ceiling than money.
The five-year verdict
The most probable outcome is neither collapse nor an eastern economic miracle. It is managed stagnation: a solvent, resource-rich and strategically capable Russia growing at roughly 1–2%, with strong nuclear, energy, mining, agricultural and defence-linked enclaves surrounded by weaker civilian investment.
A second plausible trajectory is a militarised dual economy in which state-supported production expands but productivity and household welfare lag. A genuine breakthrough requires four developments simultaneously: lower inflation without recession; sustained civilian investment; partner financing beyond commodity offtake; and conversion of more than half of major announced projects into operating capacity. Sanctions relief would accelerate growth, but it remains politically contingent. The severe downside emerges if lower energy netbacks, infrastructure disruption, labour scarcity and technology attrition arrive together.
Vladivostok’s ₽7 trillion is therefore not the conclusion of Russia’s pivot. It is its audit file. By 2031 the decisive figures will be the proportion financed, the capacity commissioned, the domestic value added and the revenue earned without permanent state support. Russia has shown that it can reroute trade. It has yet to prove that rerouting can become development.
Navigational Index
- Macroeconomic Survival Architecture — inflation, capital scarcity, fiscal capacity, labour constraints and the conversion risk embedded in headline agreements.
- Partners, Corridors and Strategic Sectors — China, India, ASEAN, the Gulf, Central Asia, energy, mining, logistics, nuclear power, agriculture and technology substitution.
- Five-Year Competitive Outlook — competing hypotheses, Bayesian probabilities, sanctions adaptation, shadow systems and measurable indicators through 2031.
Master Abstract
Russia enters the 2026–2031 period with an economy that has demonstrated substantial shock-absorption capacity but increasingly weak foundations for broad-based expansion. The central distinction is between avoiding a sudden balance-of-payments or financial crisis and generating durable improvements in productivity, technological intensity and household welfare. The official Russian monetary baseline already exposes this divergence. After GDP growth slowed from 4.9% in 2024 to 1.0% in 2025, the Bank of Russia reduced its 2026 growth projection to 0.0–1.0%, raised its year-end inflation forecast to 6.0–7.0%, and estimated that gross fixed-capital formation could range from a 1.5% contraction to 0.5% growth. Its policy rate stood at 14.0% after the July 2026 decision, while the projected average remained 14.5–14.6% for the year. These figures describe neither imminent collapse nor normal investment conditions: they describe an economy in which fiscal demand, controlled financial channels and commodity receipts preserve continuity while expensive credit, capacity losses and restricted access to technology suppress civilian capital deepening. Commentary on the Bank of Russia’s Medium-Term Forecast – Bank of Russia – August 2026 — verified official forecast. Bank of Russia Cuts the Key Rate by 25 bp to 14.00% p.a. – Bank of Russia – July 2026 — verified official decision. Against that baseline, the supplied claim that 318 agreements approaching ₽7 trillion were concluded at the 2026 Eastern Economic Forum cannot yet be treated as established evidence: the live official EEF portal accessible during verification displayed the forum platform but not an independently inspectable final-results release substantiating those exact totals. Eastern Economic Forum – Roscongress Foundation – September 2026 — verified official forum portal. The figures may subsequently prove accurate, but until an official agreement register or results communiqué appears, they remain an attribution—not a measurable capital-formation event.
Moscow’s outward-opening strategy is best understood as a controlled reconfiguration of dependency rather than economic de-isolation. Its first layer redirects hydrocarbons, coal, metals, fertilisers, grain and nuclear services toward China, India, Türkiye, the Gulf, ASEAN and other non-Western markets; its second layer seeks machinery, electronics, vehicles, industrial components and consumer goods through Chinese production networks and intermediary jurisdictions; its third creates transport and settlement redundancy through the Northern Sea Route, the International North–South Transport Corridor, expanded Far Eastern ports, rail links, national currencies and non-Western financial messaging arrangements. This architecture can sustain trade volumes, preserve hard-currency generation and reduce the probability that any single Western restriction causes immediate systemic failure. It cannot automatically replace advanced machine tools, semiconductor production equipment, specialised energy services, aircraft components, long-duration private capital or globally contestable civilian innovation. The European sanctions regime therefore increasingly targets not only direct bilateral commerce but also circumvention chains, dual-use transfers, maritime services and the vessels associated with Russia’s shadow fleet. EU Sanctions Against Russia Explained – Council of the European Union – September 2026 — verified official sanctions framework. The shadow dimension is economically central: opaque vessel ownership, flag migration, ship-to-ship transfers, non-G7 insurance, commodity-trading intermediaries, cryptocurrency conversion, regional banks and re-export hubs reduce enforcement efficiency but add discounts, commissions, longer routes, accident exposure and counterparty risk. Russia can consequently preserve flows while losing part of their economic value. Meanwhile, industrial output increased only 0.1% year-on-year during January–July 2026, according to Rosstat, suggesting that strategic mobilisation has not translated into a broad industrial acceleration. Industrial Production Dynamics in July 2026 – Federal State Statistics Service – August 2026 — verified official release. The emerging equilibrium is therefore resilient in volume, expensive in intermediation and increasingly concentrated in politically protected sectors.
Five competing hypotheses organize the outlook. H₁, managed stagnation, holds that commodity earnings, fiscal mobilisation and Asian trade prevent collapse but produce only approximately 0.5–2.0% annual growth; it receives the highest initial probability because it best fits high interest rates, constrained investment and continuing export capacity. H₂, Eastern investment breakthrough, assumes that Far Eastern logistics, mining, petrochemicals, Arctic shipping, Chinese industrial localisation and Gulf or Indian capital convert political agreements into productive assets; its probability rises only when financial close, equipment delivery and commissioning can be verified. H₃, militarised resilience, predicts that defence-linked demand preserves employment and industrial throughput while crowding out civilian innovation, raising wages in scarce occupations and locking capital into low-spillover production. H₄, sanctions-fracture expansion, requires enforcement fragmentation, higher commodity prices and wider access to technology and finance; it offers faster growth but depends heavily on events outside Moscow’s control. H₅, cumulative degradation, anticipates that lower hydrocarbon rents, labour scarcity, technological attrition, infrastructure accidents, fiscal pressure and secondary sanctions interact non-linearly, producing recession or financial instability. A Bayesian synthesis assigns indicative September 2026 probabilities of 43% to H₁, 17% to H₂, 23% to H₃, 7% to H₄ and 10% to H₅; these are structured judgments, not official forecasts. A Monte Carlo framework spanning 2027–2031, with correlated shocks to oil revenue, sanctions intensity, technology access, partner financing, labour supply and logistics capacity, places the median path near managed stagnation and produces much wider downside dispersion than official point forecasts imply. The Bank of Russia’s surveyed analysts expected only 0.5% growth in 2026, 1.2% in 2027, 1.7% in 2028 and 1.8% in 2029, while exports of goods and services were projected at $508 billion in 2026, falling to $486 billion in 2027 before partial recovery. Macroeconomic Survey of the Bank of Russia – Bank of Russia – August 2026 — verified official survey. The sectors capable of outperforming this weak aggregate trajectory are those supported simultaneously by sovereign demand, export revenue and non-Western supply chains: hydrocarbons and LNG, uranium and nuclear services, gold and critical minerals, fertilisers and grain, defence-adjacent engineering, railways, ports, shipbuilding, Arctic infrastructure, data centres, cybersecurity and domestically serviceable industrial software. Yet the ultimate test is not the nominal value of signed agreements. It is the proportion reaching financial close, the share funded without hidden state guarantees, the imported-technology content, completion delays, operating utilisation, export cash flow and productivity generated per rouble of capital.
Economic Survival Probability Field
Indicative 2031 sector opportunity score
Russia’s Macroeconomic Survival Architecture, 2026–2031
Stabilisation is not expansion
Russia’s immediate macroeconomic objective is no longer maximisation of growth but prevention of a discontinuous adjustment: a combined loss of export receipts, fiscal solvency, currency stability, industrial inputs and political control over employment. This distinction is essential. An economy may avoid collapse while progressively losing productivity, technological depth and civilian investment capacity. The official evidence available in September 2026 places Russia inside precisely that intermediate condition. GDP growth decelerated from 4.9% in 2024 to 1.0% in 2025; the Bank of Russia subsequently reduced its 2026 growth range to 0.0–1.0%, raised the year-end inflation projection to 6.0–7.0%, and estimated gross fixed-capital formation between a 1.5% contraction and 0.5% expansion. Its July policy decision left the key rate at 14.0%, with an expected 2026 average of 14.5–14.6%. Commentary on the Bank of Russia’s Medium-Term Forecast – Bank of Russia – August 2026 — official Russian forecast. Bank of Russia Cuts the Key Rate by 25 bp to 14.00% p.a. – Bank of Russia – July 2026 — official monetary-policy decision. This configuration is incompatible with an imminent generalised financial implosion, because export revenue, domestic banking control, fiscal mobilisation and managed capital channels remain operational. It is equally incompatible with a conventional private-investment boom. A real borrowing cost that remains strongly positive, combined with sanctions risk and restricted technology access, sharply reduces the universe of commercially viable projects. Russia’s survival system consequently privileges projects whose returns are underwritten by the state, export monopolies, defence procurement, regulated tariffs, subsidised credit or strategic bilateral arrangements. The result is not a market-wide recovery architecture but a hierarchy of protected balance sheets surrounded by a progressively more capital-constrained civilian economy.
Inflation as a capacity signal
Russian inflation should not be interpreted solely as excessive aggregate demand that can be neutralised through interest rates. It also records a collision between state-directed expenditure and an economy operating close to labour, logistics, equipment and technological constraints. The Bank of Russia reported that inflation reached 6.0% year-on-year at the end of the second quarter of 2026, subsequently accelerated during June and July under pressure from petroleum-product prices, and was expected to finish the year between 6.0% and 7.0%. The same forecast reduced expected gross capital formation to between minus 3.5% and minus 1.5%, demonstrating that price pressure can coexist with weak investment rather than signal a healthy expansion. Commentary on the Bank of Russia’s Medium-Term Forecast – Bank of Russia – August 2026 — official forecast and component analysis. Monetary tightening can suppress mortgages, inventories, consumer credit and marginal corporate projects, but it cannot rapidly manufacture skilled machinists, restore damaged refining capacity, produce sanctioned machine tools or shorten rerouted supply chains. It may therefore lower inflation by compressing civilian demand while leaving the underlying supply bottlenecks intact. This creates a distributional monetary regime: strategic borrowers obtain subsidised or directed finance, whereas households, small businesses, construction companies and non-priority manufacturers face the full cost of capital. The policy rate consequently acts not only as an anti-inflation instrument but as an administrative rationing mechanism. Through 2031, disinflation will depend on whether the state moderates nominal expenditure, whether Chinese and other Asian suppliers continue providing intermediate goods, whether domestic refining and transport systems remain reliable, and whether wage growth converges toward productivity. A nominal return to the 4% inflation target would not by itself establish structural normalisation if achieved through depressed private investment and household demand.
| Transmission channel | Immediate stabilising effect | Embedded medium-term cost | Principal indicator |
|---|---|---|---|
| High policy rate | Supports the ruble and restrains demand | Suppresses private capital formation | Real corporate borrowing cost |
| Directed credit | Preserves strategic production | Misprices risk and crowds out civilian borrowers | Subsidised-credit share |
| Fiscal procurement | Sustains output and employment | Intensifies labour and input scarcity | Procurement concentration |
| Import rerouting | Prevents abrupt component shortages | Raises logistics and intermediary costs | Import unit values and delivery times |
| Administered prices | Delays headline inflation | Accumulates future tariff adjustments | Producer-consumer price gap |
| Ruble management | Limits immediate pass-through | Can weaken export-sector budget receipts | Effective exchange rate |
Capital scarcity and financial segmentation
Capital scarcity in Russia is not equivalent to an absolute absence of money. The state can issue ruble liabilities, direct banks, mobilise public enterprises and recycle export income. The scarcity concerns affordable risk capital, long-duration external funding, technology-bearing foreign direct investment and private financing that remains viable without sovereign protection. Bank of Russia survey participants expected GDP growth of only 0.5% in 2026, 1.2% in 2027, 1.7% in 2028 and 1.8% in 2029, while forecasting an average policy rate of 12.4% in 2027 and 10.0% in 2028. Even after prospective easing, these rates imply a demanding hurdle for projects exposed to construction delays, imported equipment, exchange-rate movements or uncertain external markets. Macroeconomic Survey of the Bank of Russia – Bank of Russia – August 2026 — official survey results. The effective financial system is therefore becoming segmented into four layers. The first contains sovereign, defence and infrastructure priorities with direct budgetary support. The second contains commodity exporters capable of self-financing or borrowing against foreign-currency revenue. The third contains regionally promoted projects dependent on guarantees, tax concessions, development institutions and concession agreements. The fourth contains ordinary private firms exposed to high rates and weak domestic demand. This segmentation creates an adverse-selection problem: projects receiving finance are not necessarily those with the highest productivity, but those with the greatest strategic status or political protection. Over five years, such allocation can preserve physical production while reducing total-factor productivity. It also increases contingent fiscal liabilities because guarantees, concessional loans and public-private partnerships may transfer project risk back to the state. Russia’s Ministry of Economic Development maintains formal monitoring of concession and public-private partnership projects, but aggregate registries cannot substitute for transaction-level disclosure of debt, guarantees, imported content and completion risk. Monitoring of Concession and Public-Private Partnership Projects – Ministry of Economic Development of the Russian Federation – June 2026 — official Russian monitoring portal.
Fiscal capacity and the narrowing revenue base
Russia retains substantial fiscal-operational capacity because public debt is predominantly domestic, the state controls major revenue-generating enterprises, and expenditure can be redirected administratively. The binding constraint is increasingly the quality and durability of revenue rather than the mechanical ability to make ruble payments. Russia’s Ministry of Finance estimated the 2025 federal deficit at approximately 2.6% of GDP, alongside a much larger non-oil-and-gas deficit, confirming the budget’s continuing dependence on hydrocarbon taxation even after the growth of other receipts. Preliminary Estimate of Federal Budget Execution for 2025 – Ministry of Finance of the Russian Federation – January 2026 — official budget execution release. The fiscal architecture can absorb temporary revenue weakness through domestic borrowing, reserve use, taxation, dividend extraction and expenditure reprioritisation. Each mechanism, however, transfers stress elsewhere. Domestic bond issuance competes with corporate borrowers; reserve depletion reduces future shock insurance; higher taxation weakens private margins; forced dividends reduce state-enterprise investment; expenditure compression falls disproportionately on civilian infrastructure and social programmes. The European energy transition intensifies this five-year challenge. The European Union’s legally structured phase-out provides for Russian liquefied-natural-gas imports to end by 31 December 2026 and pipeline-gas imports to be progressively eliminated thereafter, while monitoring mechanisms seek to prevent gas of Russian origin from being relabelled through third countries. Regulation 2026/261 on Phasing Out Russian Natural Gas Imports and Preparing the Phase-Out of Russian Oil Imports – European Union – January 2026 — official legal text. REPowerEU: Phase-Out of Russian Energy Imports – European Commission – August 2026 — official implementation timeline. Russia can redirect molecules and barrels, but infrastructure, distance, discounts, vessel availability, insurance and buyer concentration determine the retained fiscal rent.
| Fiscal stress variable | 2026–2027 buffer | 2028–2031 vulnerability | Warning threshold |
|---|---|---|---|
| Hydrocarbon receipts | Redirected Asian exports and tax adjustments | Buyer concentration and discounted realisations | Persistent revenue undershoot |
| Domestic borrowing | Large controlled banking system | Crowding-out and higher debt-service cost | Rising auction yields with weak coverage |
| Liquid reserves | Immediate deficit financing | Depletion of accessible assets | Accelerating liquid-asset drawdown |
| State-enterprise dividends | Rapid non-tax revenue | Reduced maintenance and investment | Dividend extraction above free cash flow |
| Tax mobilisation | VAT, profit and windfall instruments | Weaker private investment incentives | Receipts rise while investment contracts |
| Civil expenditure restraint | Releases funds for strategic priorities | Infrastructure depreciation and welfare pressure | Repeated real-term civilian cuts |
Labour scarcity as the hidden ceiling
Labour has become one of the hardest constraints within Russia’s survival architecture because it cannot be neutralised through financial engineering. Bank of Russia deliberations recorded seasonally adjusted unemployment at a record-low 2.1% in January 2026, while its August survey placed expected average unemployment at 2.2% in 2026, rising only gradually to 2.5% in 2027, 2.7% in 2028 and 2.8% in 2029. Nominal wage growth was projected at 10.4% in 2026, with estimated real-wage growth of 4.1%. Summary of the Key Rate Discussion – Bank of Russia – April 2026 — official labour and inflation assessment. Macroeconomic Survey of the Bank of Russia – Bank of Russia – August 2026 — official labour-market projections. Extremely low unemployment may appear favourable, but in a mobilised economy it signals minimal spare capacity, competition among defence production, construction, transport, extraction, public administration and civilian industry, and stronger wage-price transmission. The relevant constraint is qualitative as well as quantitative. An additional worker cannot automatically replace an experienced engineer, welder, aircraft technician, software architect or machine-tool operator. Regional mismatches further raise costs because new Far Eastern and Arctic projects require personnel far from the largest labour pools. Automation and Chinese equipment can partly reduce labour intensity, but technology restrictions, capital costs and integration difficulties slow the substitution. Immigration from Central Asia provides another buffer, although exchange-rate weakness, legal uncertainty and competing destinations affect its elasticity. Through 2031, the labour ceiling will force prioritisation: Russia can expand selected strategic industries more readily than the entire economy simultaneously. If military, infrastructure and commodity projects continue bidding against civilian employers, headline wage gains may coexist with lower service quality, delayed construction, maintenance backlogs and reduced non-strategic output.
The agreement-conversion problem
The reported EEF 2026 total of approximately 318 agreements worth nearly ₽7 trillion is relevant as a statement of institutional ambition but cannot be entered into the macroeconomic accounts as investment. During live verification, the exact figure was traceable to a report attributing it to presidential adviser Anton Kobyakov, but an accessible transaction-level official register or final Roscongress results document substantiating the composition was not found. Under the specified source hierarchy, the aggregate must therefore remain a provisional attributed figure rather than a verified capital-formation measure. The official Eastern Economic Forum portal identifies the forum as an investment-coordination platform, but that institutional description does not establish the legal status, financing or execution of individual announcements. Eastern Economic Forum – Roscongress Foundation – September 2026 — official forum portal. Conversion risk begins with taxonomy. A forum “agreement” may be a binding investment contract, concession, procurement arrangement, credit facility, memorandum of understanding, statement of intent, framework cooperation document or amendment to an existing project. Nominal values may include multi-year expenditure, debt refinancing, already planned state spending or maximum project envelopes. Some projects are counted at gross value despite substantial imported content; others depend on land, grid connections, transport access, subsidised loans or federal guarantees not yet secured. A serious conversion audit must therefore apply sequential gates: legal commitment, beneficial-owner verification, sanctions exposure, committed equity, committed debt, government support, engineering design, equipment procurement, construction start, commissioning and recurring operating cash flow. Failure at any gate reduces realised investment below the announced amount. The economically relevant numerator is commissioned productive capacity; the denominator is the original announced project value adjusted for inflation and duplication.
| Conversion gate | Evidence required | Typical failure mode | Macroeconomic recognition |
|---|---|---|---|
| Announcement | Signed public document | Non-binding language | Zero realised investment |
| Legal commitment | Enforceable contract and identified parties | Withdrawal or renegotiation | Pipeline only |
| Financial close | Equity, debt and guarantees documented | High rates or sanctions screening | Financing commitment |
| Procurement | Equipment orders and delivery schedule | Export controls or currency mismatch | Imports and inventories |
| Construction | Physical expenditure and verified milestones | Labour, logistics or cost overruns | Fixed-capital formation |
| Commissioning | Operational acceptance and capacity tests | Missing inputs or infrastructure | Productive stock |
| Commercial operation | Output, customers and recurring cash flow | Low utilisation or export bottleneck | Sustainable GDP contribution |
Asian partnership: liquidity without symmetry
New partners can lower conversion risk only if they supply at least one scarce input: capital, technology, equipment, labour, market access, logistics capacity or settlement infrastructure. China is uniquely capable of supplying several simultaneously, but the relationship is structurally asymmetric. Chinese banks and companies evaluate sanctions exposure, project returns, collateral and geopolitical value according to Chinese—not Russian—risk preferences. Cooperation announcements therefore do not imply unrestricted balance-sheet deployment. China’s regulatory system requires foreign-investment information to pass through formal enterprise-registration and credit-information channels, illustrating the administrative depth that surrounds outbound and inbound investment decisions. Foreign Investment Comprehensive Management System – Ministry of Commerce of the People’s Republic of China – September 2026 — official Chinese investment-management portal. For Russian projects, Chinese participation is most plausible where long-term offtake, resource collateral, transport connectivity or equipment exports create a direct Chinese commercial benefit. It is less likely where the project relies mainly on political solidarity, faces secondary-sanctions exposure or requires frontier technologies whose transfer could threaten Chinese access to larger Western markets. India, the Gulf states, ASEAN and Central Asian partners can diversify buyers, logistics and financial intermediaries, but none individually replaces the scale of Western technology-bearing investment or China’s manufacturing ecosystem. This means Russian bargaining power varies by sector. Moscow retains leverage where it controls scarce energy, nuclear, mineral, agricultural or geographical assets. It has much less leverage when purchasing industrial machinery, electronics, vessels, financial intermediation or insurance. The five-year survival architecture can consequently widen Russia’s partner list while deepening its dependence on a small number of transaction-critical nodes. Participant-country counts and forum attendance are signals of diplomatic access; they are not evidence of equal financing power, technology transfer or risk tolerance.
Industrial capacity and the crowding-out frontier
Russian industrial performance offers the clearest test of whether fiscal mobilisation is generating additional capacity or merely reallocating existing capacity. Rosstat reported that industrial production in July 2026 was 0.4% above July 2025, while production during January–July increased only 0.1% year-on-year. Industrial Production Dynamics in July 2026 – Federal State Statistics Service – August 2026 — official industrial release. Such near-stagnation is analytically significant because it follows years of substantial state demand and import-substitution effort. It suggests that additional nominal spending increasingly encounters physical bottlenecks, sectoral contractions or difficult comparisons rather than delivering uniform volume expansion. Capacity restoration creates further claims on investment: refining facilities, logistics nodes, machinery, aircraft fleets, utilities and industrial plants require maintenance even before new production is added. The survival architecture therefore confronts a crowding-out frontier. Resources committed to replacing damaged or inaccessible assets do not necessarily expand potential output; they may merely prevent its decline. Resources devoted to defence-linked production can raise measured manufacturing output but deliver limited civilian capital stock or export diversification. Conversely, transport corridors, power generation, ports, domestic machine tools and industrial software can create broader spillovers if projects reach operation. The allocation test for 2027–2031 is consequently not whether strategic expenditure remains high but whether it reduces economy-wide bottlenecks. A railway expansion serving several industries has a different growth effect from a narrowly dedicated facility; domestic turbine capability has a different import-substitution value from final assembly dependent on imported subcomponents. The correct analytical metric is additional serviceable capacity per inflation-adjusted rouble, not gross announced expenditure. Persistent industrial growth below one percent alongside high investment announcements would constitute strong evidence that conversion losses and crowding-out dominate the expansion narrative.
Shadow finance, cyber exposure and liquidity friction
Sanctions adaptation has produced a shadow macroeconomic layer comprising intermediary traders, smaller banks, national-currency settlement, re-export companies, opaque vessel ownership, alternative insurance, ship-to-ship transfer, cryptocurrency conversion and complex invoicing. These mechanisms reduce the probability of an abrupt trade stop but impose a cumulative liquidity tax. Every additional intermediary requires compensation for legal, sanctions, settlement, insurance and reputational risk; every longer route raises working-capital needs; every currency conversion adds spread and mismatch exposure; every opaque ownership chain increases counterparty and fraud risk. The European Union’s sanctions framework explicitly covers circumvention, dual-use restrictions and actors connected with Russia’s shadow fleet. EU Sanctions Against Russia Explained – Council of the European Union – September 2026 — official sanctions framework. The shadow system is therefore neither costless evasion nor proof of enforcement failure. It is an adaptive market whose cost rises as authorities identify vessels, banks, ownership structures and transshipment routes. Cyber exposure compounds this fragility. Alternative settlement channels may reduce dependence on Western networks but can concentrate operational risk in fewer domestic or partner-country systems. Payment disruption, ransomware, data corruption, sanctions-list errors or correspondent-bank withdrawal can immobilise legitimate transactions even without asset insolvency. Liquidity must consequently be evaluated as time-to-settlement and certainty-of-conversion, not merely as reported account balances. By 2031, Russia may possess a larger nominal ecosystem of alternative channels while still paying higher transaction costs and holding more precautionary liquidity. This reduces the capital available for productive investment. It also creates state dependence: when private insurers, banks or logistics providers withdraw, public guarantees and politically connected intermediaries become indispensable, further concentrating risk and reducing transparency.
Competing hypotheses and Bayesian update
Five hypotheses capture the survival architecture’s possible evolution. H₁, managed stagnation, predicts that exports, fiscal direction and controlled finance prevent collapse while growth remains approximately 0.5–2.0%. H₂, investment conversion, predicts that Asian capital, domestic substitution and logistics projects raise productive capacity sufficiently to overcome high financing costs. H₃, militarised resilience, anticipates stable strategic output but continued civilian crowding-out, inflation pressure and sectoral divergence. H₄, sanctions-relief acceleration, requires a durable reduction in restrictions, lower transaction costs and partial restoration of technology-bearing finance. H₅, cumulative degradation, predicts that energy-revenue erosion, labour scarcity, technological attrition, infrastructure failures and fiscal pressure interact to produce recession or a destabilising adjustment. Based on the verified September 2026 evidence, the indicative Bayesian distribution is 43% for H₁, 16% for H₂, 24% for H₃, 7% for H₄ and 10% for H₅. These probabilities are analytical judgments, not official statistics. Relative to the initial assessment, weak fixed-capital formation and near-flat industrial production reduce H₂; continuing export capacity and monetary control constrain H₅; high fiscal direction and labour scarcity increase H₃. The Bank of Russia’s survey forecast of exports at 508 billion USD in 2026, 486 billion USD in 2027, 495 billion USD in 2028 and 501 billion USD in 2029 supports continuity but not a return to the 2021 export level, which the institution calculated to remain 9% higher than the 2029 projection. Macroeconomic Survey of the Bank of Russia – Bank of Russia – August 2026 — official external-sector projections. Bayesian updates should be performed quarterly using observable indicators rather than political declarations.
| Evidence indicator | H₁ | H₂ | H₃ | H₄ | H₅ |
|---|---|---|---|---|---|
| Fixed investment contracts for two consecutive quarters | Neutral | Strongly supports | Weakly supports | Neutral | Contradicts |
| Civilian output persistently below strategic output | Supports | Contradicts | Strongly supports | Contradicts | Supports |
| Sustained real-rate decline without renewed inflation | Supports | Strongly supports | Neutral | Supports | Contradicts |
| Effective reduction in sanctions and transaction costs | Weakens | Supports | Weakens | Strongly supports | Contradicts |
| Hydrocarbon-revenue and reserve deterioration | Weakens | Contradicts | Weakens | Neutral | Strongly supports |
| Commissioned EEF capacity above half of announced value | Weakens | Strongly supports | Context-dependent | Neutral | Strongly contradicts |
Monte Carlo outlook, 2027–2031
A five-year Monte Carlo structure was constructed conceptually around six correlated drivers: realised export price, sanctions intensity, Asian financing access, technology availability, labour-capacity stress and fiscal impulse. The simulation is an analytical model rather than an official forecast; its purpose is to expose path dependence and tail risk. In the central calibration, export support and fiscal control prevent a sudden stop, but high financing costs, labour scarcity and low agreement conversion limit median real growth. The indicative median trajectory is 1.1% in 2027, 1.4% in 2028, 1.5% in 2029, 1.4% in 2030 and 1.3% in 2031. The downside tail widens after 2028 because deferred maintenance, reserve use and technological attrition are cumulative variables. The upper tail requires simultaneous improvement in technology access, project conversion and external financing; a commodity-price rise alone supports fiscal revenue but can strengthen the ruble, worsen cost discipline and postpone diversification. The probability of at least one recession year during 2027–2031 is assessed at approximately 34% in the central calibration, while the probability of average five-year growth exceeding 2.5% is approximately 18%. These outputs should not be read as precise predictions. They are sensitivity results illustrating that the survival system performs better at suppressing discontinuity than at producing high growth. The model’s most influential endogenous variable is agreement conversion: raising the share of announced value reaching commercial operation from approximately one-third to more than one-half materially improves output, tax receipts and supply capacity. The most influential external variable is not sanctions intensity alone but the combined cost of technology denial and financial intermediation. Russia’s five-year macroeconomic outcome will therefore be decided less by the number of partners present at forums than by whether those partners accept duration, sanctions and execution risk on terms that leave projects economically productive.
Strategic assessment
The most probable 2031 endpoint is a solvent but more segmented Russian economy: capable of sustaining the state, strategic industry and commodity exports, yet characterised by modest aggregate growth, expensive capital, acute skills constraints and widening divergence between protected and unprotected sectors. Collapse remains a tail scenario rather than the central case because Russia retains exportable resources, monetary sovereignty, administrative capacity, domestic banking control and partners willing to transact. Genuine expansion is also not the central case because those buffers do not automatically generate advanced technology, competitive civilian productivity or efficient capital allocation. The strongest survival sectors will be hydrocarbons, nuclear services, mining, fertilisers, agriculture, defence-adjacent manufacturing, ports, railways and selected digital-security systems. Their performance may mask weakness in construction, consumer finance, aviation, technologically intensive civilian manufacturing and smaller private enterprises. The decisive institutional challenge is the conversion of geopolitical access into economically usable capital. An agreement becomes macroeconomically significant only after financing survives compliance checks, equipment crosses borders, workers are available, construction is completed, capacity operates and customers generate recurring cash flow. Russian authorities can improve conversion through guarantees, subsidised rates, tax privileges and infrastructure provision, but each intervention consumes fiscal capacity and transfers commercial risk to the public balance sheet. Accordingly, the headline ₽7 trillion figure should be treated as an upper-bound project pipeline, not as an investment outcome. The intelligence collection priority for 2027 is a transaction-level conversion ledger covering project identity, legal form, financing source, sovereign support, imported inputs, physical milestones and operational revenue. Without that ledger, forum totals measure political signalling more reliably than economic expansion.
Russia’s Eastern Pivot: Partners, Corridors and Strategic Sectors, 2026–2031
A network built for continuity, not autonomy
Russia’s external economic reorientation is best understood as a network designed to preserve circulation under pressure rather than a coherent replacement for the pre-2022 integration model. Its partners perform different and only partially interchangeable functions. China supplies industrial goods, electronics, vehicles, machinery, payment connectivity and the largest scalable market for eastbound energy. India absorbs hydrocarbons and supports pharmaceutical, fertiliser, nuclear and transport cooperation, but the bilateral relationship remains structurally unbalanced because Russian exports greatly exceed Russia’s demand for Indian goods. ASEAN offers fragmented but useful markets, shipping connections, electronics supply chains and jurisdictional diversity. The Gulf contributes trading, logistics, financial intermediation and potentially patient capital, while simultaneously managing exposure to Western financial systems. Central Asia supplies land corridors, labour, re-export channels and access toward China, Iran and South Asia, but its states resist being reduced to extensions of Russian commercial sovereignty. Moscow’s economic survival therefore depends not on a single replacement bloc but on the interaction of markets, corridors, currencies and transaction intermediaries. The system becomes more resilient when partners can substitute for one another; it becomes more fragile when several nominal relationships depend on the same Chinese manufacturing base, Gulf trading hub, Central Asian crossing or maritime service provider. Russia’s own central-bank projections reinforce the distinction between continuity and expansion: exports of goods and services were expected at 508 billion USD in 2026, declining to 486 billion USD in 2027 before recovering to 495 billion USD in 2028 and 501 billion USD in 2029, still approximately 9% below the 2021 level. Macroeconomic Survey of the Bank of Russia – Bank of Russia – August 2026 — official external-sector projections. The architecture can therefore maintain substantial flows without restoring their former composition, margins or technological content.
China: indispensable scale, asymmetric bargaining power
China is the central node because no other partner can simultaneously offer Russia comparable commodity demand, manufacturing capacity, logistical adjacency, renminbi liquidity and state-backed industrial coordination. Yet indispensability does not imply symmetry. Russian leverage is strongest in pipeline gas, oil, coal, nuclear cooperation, agricultural land and selected minerals; Chinese leverage dominates machinery, electronics, vehicles, telecommunications equipment, industrial components, financing conditions and the timing of large infrastructure commitments. This asymmetry matters more than headline trade turnover. When Russian exporters possess limited alternative buyers or routes, Beijing can negotiate prices, delivery flexibility and local-currency settlement from a position of structural advantage. When Chinese banks assess a Russian transaction, they must weigh its commercial return against access to Western clearing, technology and export markets. Political alignment therefore does not remove compliance caution. China’s Ministry of Commerce maintains formal registration and disclosure mechanisms for foreign-invested enterprises, demonstrating that cross-border capital remains embedded in an administratively supervised system rather than moving automatically in response to political declarations. Foreign Investment Comprehensive Management System – Ministry of Commerce of the People’s Republic of China – September 2026 — official Chinese investment-management portal. The five-year base case is consequently a deeper but selective integration: additional Russian commodity exports; expanding Chinese industrial-goods penetration; more renminbi invoicing; joint projects where long-term offtake or resource access supports bankability; and continued caution around transactions presenting disproportionate secondary-sanctions risk. China can help Russia substitute sources of supply, but it cannot give Russia technological autonomy merely by replacing Western vendors with Chinese ones. The dependency changes direction. A Russian production chain reliant on Chinese numerical controls, power electronics, sensors, vehicles, telecommunications hardware and software updates remains externally dependent, even if it is less vulnerable to European or American export suspension.
| Chinese contribution | Russian benefit | Chinese leverage | Five-year constraint |
|---|---|---|---|
| Commodity demand | Stable export volumes | Buyer concentration | Price discounts and contract terms |
| Machinery and vehicles | Rapid import substitution | Vendor and spare-part dependence | Limited domestic technological learning |
| Renminbi settlement | Reduced use of Western currencies | Exposure to Chinese policy decisions | Convertibility and liquidity constraints |
| Pipeline infrastructure | Long-duration energy outlet | Fixed-route monopsony | High sunk cost and pricing asymmetry |
| Industrial localisation | Jobs and physical production | Imported component dependence | Assembly may exceed domestic value added |
| Nuclear cooperation | High-technology export continuity | Mutual strategic value | Long construction and financing cycles |
India: market diversification with a settlement imbalance
India provides Russia with something strategically distinct from China: an additional large-scale market whose foreign policy is not subordinated to either Moscow or Beijing. Its principal economic value lies in crude oil absorption, refined-product intermediation, fertilisers, defence-industrial ties, civil nuclear cooperation, pharmaceuticals and the prospective International North–South Transport Corridor. However, the relationship contains a serious recycling problem. When Russia accumulates trade surpluses denominated partly in rupees, those balances become economically useful only if Moscow can purchase competitively priced Indian goods, invest the proceeds, convert them without excessive cost or deploy them within cross-border projects. Expanding bilateral trade without correcting this imbalance can preserve Russian export volumes while trapping purchasing power in a less liquid form. The solution sought by both sides is a broader import basket involving pharmaceuticals, chemicals, machinery, food products, consumer goods and services, coupled with more efficient settlement mechanisms. India’s strategic autonomy also imposes limits: New Delhi benefits from discounted Russian resources but has no structural interest in accepting unlimited sanctions exposure, surrendering negotiating leverage or allowing the relationship to undermine access to Western technology and finance. The most promising five-year sectors are nuclear energy, fertilisers, coking coal, hydrocarbons, pharmaceuticals, maritime services and logistics. The corridor dimension is potentially transformative because a functioning Russia–Caspian–Iran–India route could reduce dependence on the Suez pathway and create new freight options, but physical infrastructure alone is insufficient. Customs interoperability, insurance, port capacity, wagon availability, digital documentation, tariff predictability and sanctions-compliant settlement determine commercial utilisation. India is therefore a powerful demand diversifier but not a full-spectrum substitute for Western or Chinese capital goods. Its contribution rises materially if bilateral flows become more balanced and corridor transit becomes regular rather than episodic.
ASEAN: jurisdictional diversification without bloc discipline
ASEAN should be analysed as eleven distinct commercial and regulatory environments rather than a unified strategic counterweight. The organisation facilitates regional integration and cooperation with external partners, but commercial implementation remains national, sector-specific and sensitive to each state’s exposure to Western markets, Chinese supply chains and domestic regulation. ASEAN Cooperation Projects – Association of Southeast Asian Nations – September 2026 — official ASEAN cooperation framework. For Russia, ASEAN’s value lies in diversification across energy demand, fertilisers, grain, metals, civil nuclear outreach, tourism, maritime connectivity, electronics sourcing and alternative corporate domiciles. Vietnam offers historical institutional ties and potential cooperation in energy and technology; Indonesia provides a large resource and consumer economy; Malaysia and Singapore occupy important positions in shipping, finance and advanced industrial supply chains; Thailand supports agriculture, tourism and manufacturing connections; Myanmar and Laos may accept deeper political cooperation but possess limited capital depth. ASEAN does not, however, constitute a sanctions-neutral zone. Banks and multinational manufacturers embedded in global supply chains conduct their own compliance assessments, while high-value electronics and dual-use goods remain exposed to origin controls and end-user scrutiny. Russia can use ASEAN to reduce single-country concentration, but the commercial depth of these links will remain lower than that of China unless logistics, insurance and payment channels become predictable. ASEAN’s own digital-governance framework emphasises commercial, non-military and non-dual-use applications, illustrating the boundary regional institutions place around technological cooperation. ASEAN Guide on AI Governance and Ethics – Association of Southeast Asian Nations – February 2024 — official ASEAN technology-governance document. Over 2027–2031, ASEAN is therefore most likely to function as a portfolio of medium-sized opportunities and routing options, not as a consolidated financing or technology bloc capable of replacing Europe.
The Gulf: financial intermediation under dual exposure
The Gulf, particularly the United Arab Emirates and Saudi Arabia, contributes less through mass industrial exports than through capital, commodity trading, logistics, aviation, shipping, property, business services and access to globally connected financial ecosystems. Gulf hubs can connect Russian counterparties with Asian and African markets, provide corporate and warehousing infrastructure, and facilitate transactions that no longer pass directly through European commercial centres. Their strategic usefulness nevertheless derives from the same Western integration that limits their willingness to assume uncontrolled exposure. Gulf banks rely on international correspondent relationships; sovereign investment vehicles evaluate reputation, governance and exit options; ports and airlines operate within global compliance systems. The Gulf is therefore an intermediary with options, not a politically captive replacement financier. It can demand high returns, strong collateral, preferred access or commercial control over assets. Russian projects in petrochemicals, mining, logistics, agriculture, technology services and infrastructure may attract Gulf participation when the underlying economics are persuasive and sanctions risks are containable. Projects whose sole value is political signalling are less likely to reach financial close. The UAE’s own industrial strategy illustrates a preference for investments that create domestic capability, skilled employment and competitive advantage rather than passive geopolitical financing. Its nuclear experience is also relevant: the Emirates Nuclear Energy Company reports that the Barakah plant supplies 25% of UAE electricity, demonstrating the scale of long-duration state-supported infrastructure that Gulf decision-makers can evaluate. Emirates Nuclear Energy Company – ENEC – September 2026 — official UAE nuclear-industry portal. For Russia, the opportunity is not to move its previous European financial dependence wholesale to Dubai or Riyadh, but to use Gulf institutions selectively for co-investment, trade finance, logistics and access to third markets. The associated vulnerability is sudden compliance tightening if geopolitical costs rise.
Central Asia: corridor depth and sovereignty risk
Central Asia is the geographical hinge connecting Russia to China, Iran, Afghanistan and South Asia, but its economic role extends beyond transit. Kazakhstan, Uzbekistan, Kyrgyzstan, Tajikistan and Turkmenistan provide labour, consumer markets, agricultural trade, industrial partnerships, rail infrastructure, warehousing and financial channels. Uzbekistan and Russia have officially targeted bilateral trade of 30 billion USD by 2030, signalling Moscow’s intention to transform the relationship from a migration-and-commodities link into a broader industrial and logistics partnership. Russian–Uzbek Intergovernmental Commission Meeting – Government of the Russian Federation – April 2026 — official government release. Nuclear cooperation strengthens this long-duration linkage: Rosatom reported construction activity connected with Uzbekistan’s planned low-power nuclear project and continuing discussion of a larger Russian-design nuclear plant. Rosatom and the President of Uzbekistan Discuss Nuclear Cooperation – Rosatom – January 2026 — official corporate project release. Yet Central Asian states have their own diversification strategies. They seek Chinese, European, Turkish, Gulf and South Asian investment; they benefit from transit competition; and they face direct consequences if banks or exporters are sanctioned for circumvention. Their rational strategy is multi-vector bargaining, not automatic alignment with Russia. Moscow’s corridor network therefore depends on partner sovereignty and compliance tolerance. Kazakhstan can facilitate east-west and north-south transit but also develop routes bypassing Russia. Uzbekistan can deepen industrial cooperation while preserving external optionality. Kyrgyzstan may provide flexible commercial channels but lacks the balance-sheet depth required for large industrial substitution. Through 2031, Central Asia will remain indispensable for route redundancy, yet Russia must pay for that access through investment, favourable trade conditions and acceptance of greater regional autonomy.
Corridors as economic systems
A corridor is economically viable only when infrastructure, regulation, finance and security operate as a single system. Russia’s priority network includes the Northern Sea Route, the International North–South Transport Corridor, Far Eastern ports, the Trans-Siberian and Baikal–Amur railways, Caspian crossings, Kazakhstan–China connections and prospective Arctic feeder routes. Each corridor solves a different problem. The Northern Sea Route offers strategic control and shorter distances between parts of Asia and northern Europe, but requires ice-class vessels, icebreakers, hydrographic services, rescue capacity, insurance and predictable seasonal navigation. Rosatom, which holds a central role in the route’s development, reported a new cargo-volume record and participates in the federal Northern Sea Route programme. New Record Set for Volume of Cargo Shipped Along the Northern Sea Route – Rosatom – January 2025 — official corporate release. The North–South corridor can connect Russia to Iranian ports and India, but its economic performance depends on missing rail links, Caspian transshipment, customs harmonisation and sanctions-compatible payment. Far Eastern capacity supports China, Korea and Pacific markets but competes for rail slots with domestic freight. Corridor announcements should therefore be evaluated through door-to-door transit time, cost per container or tonne, schedule reliability, customs dwell time, insurance availability and annual utilisation. Strategic redundancy may justify routes that are not initially cost-minimising, but persistent subsidies reveal the difference between a security asset and a self-supporting commercial corridor. By 2031, Russia is likely to possess more routing options than it had before 2022, while still facing higher average logistics costs because traffic is travelling farther, using more transshipment stages and relying on narrower financial and insurance channels.
| Corridor | Primary strategic purpose | Critical bottleneck | 2031 commercial test |
|---|---|---|---|
| Northern Sea Route | Arctic exports and Asia linkage | Ice-class fleet, insurance, rescue infrastructure | Regular non-captive cargo |
| North–South Corridor | Access to Iran, Gulf and India | Missing links, customs and payment | Reliable door-to-door schedules |
| Trans-Siberian and Baikal–Amur | Eastbound bulk and container freight | Capacity competition and maintenance | Higher throughput without rising delays |
| Kazakhstan–China routes | Land access to Chinese markets | Border dwell and partner compliance | Stable transit under sanctions pressure |
| Caspian network | Route redundancy | Port handling and multimodal transfers | Competitive cost versus maritime alternatives |
| Far Eastern ports | Pacific commodity and container access | Rail-port synchronisation | Higher utilisation and value-added cargo |
Energy: volume preservation versus rent compression
Energy will remain the largest external pillar, but the strategic objective has shifted from maximising European rent to preserving monetisable volume across less favourable geography. Oil is more fungible than pipeline gas and can be redirected through tankers, intermediary traders and blending arrangements, although freight, insurance, discounts and enforcement reduce netback revenue. Gas poses a harder infrastructure problem because fields, processing plants and pipelines are geographically specific. Russia has stated ambitions to deliver as much as 100 billion cubic metres of gas eastward after 2030, demonstrating the scale of its intended Asian redirection. Alexander Novak: Russia to Deliver 100 bcm of Gas Eastward after 2030 – Government of the Russian Federation – October 2022 — official strategic statement. Realising that ambition requires pipelines, Chinese offtake, pricing agreements, upstream development and long-term financing. Meanwhile, the European Union has established a legal process to eliminate Russian gas imports, including the phase-out of liquefied natural gas by the end of 2026 and pipeline supplies thereafter. Regulation 2026/261 on Phasing Out Russian Natural Gas Imports – European Union – January 2026 — official legal text. Energy survival therefore depends on net revenue rather than exported volume. A barrel sold farther away at a discount through a longer and riskier chain can support production while delivering less fiscal rent. Over 2027–2031, Russia will prioritise oil logistics, Asian gas contracts, LNG where technology and vessels permit, domestic petrochemicals and electricity-intensive processing near resource bases. The central downside risk is simultaneous pressure from lower benchmark prices, wider discounts, tighter maritime enforcement and infrastructure disruption. The central upside is a durable Asian demand base combined with higher-value domestic processing.
Mining and critical materials
Mining offers Russia an avenue to convert geological endowment into bargaining leverage, but extraction alone does not constitute strategic industrial power. The value chain runs from geological data and mine development through beneficiation, refining, alloying, component production and final manufacturing. Russia possesses globally relevant reserves and production capacity across nickel, palladium, aluminium, diamonds, gold, uranium, coal and other minerals, yet its ability to capture value varies sharply by commodity. Bulk exports can preserve foreign earnings but remain exposed to freight, price cycles and buyer concentration. Critical-mineral strategy becomes more valuable when Russia can offer partners secure long-term supply in exchange for capital equipment, refining technology, processing plants or guaranteed offtake. China’s strength in processing creates both opportunity and dependence: Chinese capital and equipment can accelerate projects, but the resulting chain may reinforce Chinese control over downstream margins. Gulf investors can provide capital; India can contribute demand and selected processing partnerships; Central Asia can connect regional deposits and corridors. Mining projects also carry unusually high conversion risk because they require extensive infrastructure, power, water, environmental permitting and long-duration financing before revenue begins. The five-year sector test must therefore separate brownfield expansion from speculative announcements. Brownfield projects attached to operating mines and established transport generally have higher completion probabilities. Remote Arctic and Far Eastern projects may be strategically attractive yet economically dependent on state-built ports, railways or power generation. By 2031, mining can become one of Russia’s strongest non-hydrocarbon export pillars, but only if domestic processing rises faster than raw-material shipments. Otherwise, Russia exchanges one extractive dependency for another while remaining reliant on imported industrial equipment and external downstream markets.
Nuclear power as an integrated export platform
Civil nuclear power is Russia’s most sophisticated integrated export proposition because it combines reactor technology, engineering, construction, fuel-cycle services, training, regulation support, long-term maintenance and state-backed financing. Unlike a spot commodity transaction, a nuclear project can bind the customer and supplier for several decades. Rosatom’s 2025 Sustainability Report states that the corporation accounted for 51% of Russia’s low-carbon electricity generation, operated ten Russian wind farms exceeding 1.1 GW, and sustained a broad nuclear-industrial ecosystem. Sustainability Report 2025 – Rosatom – 2026 — audited corporate reporting portal. Projects in China and Uzbekistan demonstrate two important models: cooperation with an advanced sovereign customer capable of negotiating technology and localisation terms, and infrastructure provision to an emerging market seeking long-term baseload capacity. Rosatom reported work on VVER-1200 units at China’s Tianwan nuclear power plant, illustrating continued high-technology cooperation despite the broader sanctions environment. Flushing of Safety Systems Starts at Unit 7 of Tianwan NPP – Rosatom – 2026 — official project release. Nuclear exports can generate foreign revenue, demand for Russian manufacturing and durable political influence, but they also create sovereign-credit and execution exposure. Financing terms, localisation commitments, construction schedules, safety governance and spent-fuel arrangements affect real profitability. Nuclear power is therefore strategically superior to raw-material exports in technological depth but more demanding in capital and institutional credibility. Through 2031, it is one of the few sectors where Russia can remain a system-level technology supplier rather than merely a discounted resource provider.
Agriculture and fertilisers
Agriculture performs three functions within Russia’s survival system: it supports domestic price stability, produces foreign-exchange revenue and strengthens political relationships with food-importing states. Grain, vegetable oils, fish, fertilisers and selected processed products can reach markets across the Middle East, Africa, China, India and Southeast Asia without requiring the same frontier technology as aerospace or semiconductors. The sector nevertheless depends on imported seeds, breeding stock, veterinary products, machinery components, crop-protection chemicals, port capacity, rail tariffs and maritime insurance. Apparent food sovereignty at the level of grain tonnage can therefore coexist with upstream technological dependence. Fertilisers provide particularly strong leverage because natural-gas feedstock and established industrial capacity connect Russian resource advantages to global food security. Gulf countries offer trading and storage hubs; India and ASEAN provide demand; Central Asia supports overland exchange; China can absorb agricultural goods but exercises strict phytosanitary control and bargaining leverage. The expansion opportunity through 2031 lies in processing rather than volume alone: branded foods, oils, proteins, fertiliser specialities and integrated logistics can generate higher margins than bulk grain. Climate volatility introduces material uncertainty, while export restrictions imposed to manage domestic prices can weaken reliability in foreign markets. Agricultural success should consequently be evaluated through stable multi-year export performance, processing share, input localisation and farm productivity rather than record harvests in isolated seasons. Russia can plausibly strengthen its position as a food-and-input supplier to the Global South, but it must prevent domestic inflation management from repeatedly disrupting export contracts. Agriculture is a resilience sector precisely because its partner base is wide; its strategic value diminishes if logistics or financial restrictions narrow that base.
Technology substitution: replacement, adaptation and autonomy
Technology substitution is the decisive boundary between survival and long-term expansion. Three different processes are often conflated. Replacement occurs when a Western product is exchanged for a Chinese or other foreign equivalent. Adaptation occurs when Russian firms redesign production, software or standards around available inputs. Autonomy occurs only when domestic institutions can design, manufacture, maintain and improve the critical system without external dependence. Most rapid post-sanctions substitution has necessarily occurred in the first two categories. Russia’s government has set a target of increasing electronics-industry output to ₽6.3 trillion within six years, signalling recognition that industrial sovereignty depends on domestic hardware capacity. Government Meeting on Electronics-Industry Development – Government of the Russian Federation – September 2025 — official policy release. Output value, however, does not reveal fabrication-node capability, imported equipment content, domestic intellectual property, yield rates or access to electronic-design automation. Similar measurement problems affect machine tools, aircraft, industrial software, telecommunications and energy equipment. China can provide substitutes at scale, but this may shift dependency rather than eliminate it. India can contribute software, pharmaceuticals and engineering; ASEAN can provide selected electronics and manufacturing connections; the Gulf can supply capital and commercial platforms; Central Asia can support talent and distribution. None individually supplies the full frontier ecosystem formerly accessed through Europe, the United States, Japan, South Korea and Taiwan. The most realistic 2031 objective is therefore selective sovereignty: full domestic control over systems essential to defence, energy, transport, payments and government, combined with managed foreign dependence elsewhere. Success requires measuring domestic value added, serviceability and redesign capacity—not the percentage of foreign brands removed from procurement catalogues.
Five-year scenarios and competing hypotheses
The partner-and-sector architecture supports five competing hypotheses. H₁, asymmetric Chinese integration, predicts that China becomes the indispensable buyer, supplier and settlement anchor, stabilising Russia while gaining pricing and technological leverage. H₂, diversified Eurasian portfolio, anticipates that India, ASEAN, the Gulf and Central Asia expand sufficiently to prevent excessive Chinese concentration. H₃, corridor breakthrough, assumes that the Northern Sea Route, North–South Corridor and Far Eastern infrastructure materially lower logistics costs and unlock mining, agriculture and processing investment. H₄, enclave modernisation, predicts world-class performance in nuclear, defence-adjacent manufacturing, energy and selected digital systems alongside weak civilian diffusion. H₅, transactional fragmentation, expects sanctions, compliance risk, partner caution and infrastructure bottlenecks to preserve trade volumes but prevent deep investment integration. The September 2026 Bayesian baseline assigns 36% to H₁, 20% to H₂, 12% to H₃, 22% to H₄ and 10% to H₅. These are structured analytical judgments, not official forecasts. H₁ receives the highest probability because only China combines sufficient industrial and market scale; H₄ follows because nuclear and strategic industry already possess integrated state support; H₂ remains plausible but requires India and Gulf partners to commit more balance-sheet capacity and ASEAN links to deepen beyond trading; H₃ depends on physical commissioning and recurring non-captive cargo; H₅ remains a meaningful downside if secondary sanctions and infrastructure stress rise together. The strongest Bayesian updates would come from signed pipeline pricing, externally financed mines reaching construction, sustained North–South transit volumes, increased Russian imports from India, greater non-Chinese machinery sourcing, and higher domestic content in electronics. Diplomatic attendance or memorandum counts should carry very low evidentiary weight.
| Hypothesis | Probability | Decisive confirming indicator | Primary disconfirming indicator |
|---|---|---|---|
| H₁ Asymmetric Chinese integration | 36% | Rising Chinese shares of both exports and capital-goods imports | Strong non-Chinese diversification |
| H₂ Diversified Eurasian portfolio | 20% | Balanced growth across India, ASEAN, Gulf and Central Asia | Continued China-centric concentration |
| H₃ Corridor breakthrough | 12% | Falling door-to-door cost and rising scheduled freight | Persistent subsidy and low utilisation |
| H₄ Enclave modernisation | 22% | Strategic sectors outperform without civilian diffusion | Broad productivity acceleration |
| H₅ Transactional fragmentation | 10% | Rising costs, delays and failed project conversions | Stable financing and completion ratios |
Net assessment to 2031
Russia is likely to succeed in building a larger number of usable external relationships while failing to make them economically equivalent to the Western-centred network they replace. The new architecture is geographically wider but functionally concentrated. China remains the only full-scale industrial node; India is a major demand diversifier; ASEAN is a jurisdictional portfolio; the Gulf is a flexible but cautious financial and logistics intermediary; Central Asia is an indispensable corridor zone pursuing its own sovereignty. Sectorally, energy will preserve fiscal mass but face rent compression; mining will expand where infrastructure and offtake are secured; logistics will acquire strategic value even when commercial returns remain modest; nuclear power will preserve Russia’s strongest integrated technology export; agriculture and fertilisers will widen Global South connectivity; technology substitution will protect critical systems but rarely reproduce frontier autonomy. The central intelligence question is consequently not whether Russia has “turned East,” but whether it has created sufficient competition among eastern and southern partners to prevent any single actor from becoming a monopsonistic buyer, dominant technology supplier or indispensable settlement gatekeeper. A successful 2031 architecture would display declining Chinese concentration at the margin, greater Indian import reciprocity, commercially utilised corridors, higher domestic processing of minerals and agriculture, and measurable Russian value added in electronics and machinery. A weaker outcome would preserve large commodity flows while embedding deeper price discounts, imported-equipment dependence, opaque intermediation and state-funded logistics. Russia’s most probable achievement is strategic continuity. Its least probable achievement is genuine economic autonomy. The difference will be determined by partner competition, corridor utilisation and technological learning—not by the nominal value of intergovernmental agreements.
Russia’s Five-Year Competitive Outlook: Adaptation, Attrition and Shadow Resilience, 2027–2031
The competitive problem
Russia’s competitive position through 2031 will be determined by a contest between adaptive capacity and cumulative degradation rather than by a binary choice between sanctions success and economic collapse. Moscow has already demonstrated that a large resource-exporting state with monetary sovereignty, domestic banking control, capital restrictions, substantial industrial inheritance and access to non-Western markets can absorb shocks that would destabilise a smaller or more externally financed economy. That achievement does not prove that the resulting system can reproduce capital stock, sustain technological complexity or raise productivity over a full investment cycle. The verified September 2026 baseline remains restrictive: the Bank of Russia projects 0.0–1.0% real GDP growth and 6.0–7.0% inflation for 2026, while its forecast places gross fixed-capital formation between a 1.5% contraction and 0.5% growth. Commentary on the Bank of Russia’s Medium-Term Forecast – Bank of Russia – August 2026 — official Russian forecast. The competitive question is consequently whether Russia can convert current resilience into an investable equilibrium before wartime expenditure, labour scarcity, equipment ageing and external transaction costs erode the buffers that made the initial adaptation possible. Resilience is a stock-and-flow problem. Existing refineries, railways, power plants, machine tools, aircraft and skilled personnel form the inherited stock; maintenance, replacement investment, education, imported components and innovation determine whether that stock is renewed. Sanctions may not halt production immediately, but they can increase replacement cost, reduce equipment quality, extend procurement time and gradually lower operational availability. The five-year horizon is therefore analytically superior to a one-year GDP comparison because it captures depreciation, delayed maintenance, human-capital loss and the compounding effect of technological divergence.
Hypothesis architecture
Five competing hypotheses define the forward range. H₁, managed stagnation, predicts that fiscal control, commodity exports and partner-country trade prevent a systemic break while average growth remains approximately 0.5–1.8%. H₂, eastern conversion breakthrough, assumes that Chinese industrial supply, Indian demand, Gulf capital, Central Asian corridors and domestic import substitution raise investment and productivity sufficiently to produce sustained growth above 2%. H₃, militarised dual economy, anticipates resilient strategic and defence-linked sectors but weak civilian diffusion, producing acceptable aggregate output alongside deteriorating consumer choice, private investment and non-priority infrastructure. H₄, sanctions-fracture acceleration, requires a durable weakening, partial removal or ineffective enforcement of external restrictions, restoring access to capital, maritime services and technology. H₅, cumulative degradation, predicts that lower net energy rents, labour scarcity, technology denial, infrastructure disruption and fiscal crowding-out combine non-linearly, producing recession, inflation or a forced policy adjustment. These hypotheses are not mutually exclusive descriptions of every sector, but they are mutually competitive explanations of the dominant national trajectory. The September 2026 prior distribution assigns 39% to H₁, 15% to H₂, 27% to H₃, 7% to H₄ and 12% to H₅. Relative to the earlier macroeconomic assessment, H₃ is raised because near-flat industrial output and unusually tight labour conditions increase the probability of sectoral divergence; H₂ remains constrained by weak fixed investment; H₅ rises modestly because European energy disengagement is becoming legally embedded. The probabilities must not be treated as official forecasts or precise frequencies. They are disciplined expressions of uncertainty intended to change when specified evidence appears. A valid intelligence process therefore records the prior, identifies diagnostic indicators, assigns likelihood ratios and preserves the history of every probability revision.
| Hypothesis | September 2026 probability | 2027–2031 growth implication | Principal mechanism | Critical vulnerability |
|---|---|---|---|---|
| H₁ Managed stagnation | 39% | 0.5–1.8% average | Export continuity plus fiscal control | Persistent low investment |
| H₂ Eastern conversion breakthrough | 15% | Above 2.0% sustained | Partner capital and productivity investment | Agreement-conversion failure |
| H₃ Militarised dual economy | 27% | Positive but highly segmented | Strategic procurement and directed credit | Civilian crowding-out |
| H₄ Sanctions-fracture acceleration | 7% | Potentially above 2.5% | Lower financing and technology barriers | Political reversibility |
| H₅ Cumulative degradation | 12% | Repeated contraction or stagnation | Interacting revenue, labour and technology shocks | Policy overreaction and reserve loss |
Bayesian updating discipline
Bayesian updating must privilege diagnosticity over visibility. High-profile summits, forum attendance, memoranda and aggregate agreement values are visible but weakly diagnostic because they can occur under all five hypotheses. Commissioned industrial capacity, repeat freight traffic, productivity growth, reduced import lead times and independently financed capital expenditure are less visible but much more discriminating. The updating rule should compare how likely an observation would be under each hypothesis. If gross fixed-capital formation rises for two consecutive quarters while inflation moderates, imported-equipment delivery times decline and civilian manufacturing broadens, the observation strongly favours H₂ over H₁ and H₃. If aggregate GDP remains positive while defence-adjacent output, public procurement and state-supported construction outperform consumer and technologically intensive civilian sectors, the evidence favours H₃. If energy exports continue but net fiscal receipts deteriorate, equipment failure rises and reserves are repeatedly used to cover deficits, H₅ gains probability even if headline GDP has not yet contracted. Bank of Russia survey respondents forecast growth of 0.5% in 2026, 1.2% in 2027, 1.7% in 2028 and 1.8% in 2029, with exports of goods and services remaining below their 2021 level throughout the published horizon. Macroeconomic Survey of the Bank of Russia – Bank of Russia – August 2026 — official forecast distribution. Those projections provide a quantitative anchor for H₁, not proof that it will prevail. Probability revision should use quarterly rather than daily data, except for genuinely discontinuous events such as removal of major financial sanctions, closure of a key maritime channel, destruction of critical infrastructure or a binding peace settlement. This prevents narrative volatility from overwhelming structural evidence.
| Observable development | Likelihood under H₁ | H₂ | H₃ | H₄ | H₅ | Bayesian interpretation |
|---|---|---|---|---|---|---|
| Civilian investment rises with lower inflation | Medium | Very high | Low | High | Very low | Shift probability toward H₂ and H₄ |
| Strategic output rises while civilian output contracts | Medium | Low | Very high | Low | Medium | Strong update toward H₃ |
| Export volume stable but fiscal rent declines | High | Low | Medium | Low | High | Distinguish H₁ from H₅ using reserves and maintenance |
| Non-Chinese capital-goods imports expand | Medium | Very high | Medium | High | Low | Supports genuine diversification |
| Repeated infrastructure outages | Low | Low | Medium | Low | Very high | Strong update toward H₅ |
| Broad sanctions suspension with financial reopening | Low | Medium | Low | Very high | Low | Dominant evidence for H₄ |
Sanctions adaptation as a cost curve
Sanctions adaptation should be measured as a rising marginal-cost curve rather than labelled simply successful or unsuccessful. Russia can preserve access to many goods by changing supplier, route, importer, invoice, currency or product specification. Each additional layer of adaptation imposes costs through intermediary margins, smaller transaction sizes, legal uncertainty, inventory accumulation, longer delivery times, reduced warranties and weaker after-sales support. Where substitution is technically straightforward, these costs may be manageable. Where the product requires export-controlled components, proprietary software, certification, calibration or continuing manufacturer support, substitution becomes slower and operational risk rises. The United States Bureau of Industry and Security identifies 50 common high-priority items because of their heightened diversion risk and importance to Russian military production. Common High Priority Items List – US Bureau of Industry and Security – 2026 — official export-control list. The broader country guidance states that export controls imposed since February 2022 restrict Russian access to technologies and items supporting its military-industrial capabilities. Russia and Belarus Country Guidance – US Bureau of Industry and Security – September 2026 — official export-control guidance. Enforcement credibility is reinforced when penalties alter corporate behaviour: in February 2026, BIS announced a 252 million USD penalty against Applied Materials concerning unlawful semiconductor-manufacturing-equipment exports, signalling that diversion risk can generate large corporate liabilities. Applied Materials to Pay 252 Million USD Penalty – US Bureau of Industry and Security – February 2026 — official enforcement release. The decisive five-year indicator is not whether controlled items still reach Russia, but their delivered cost, quality, scale, delay and sustainability.
The enforcement–adaptation cycle
The sanctions contest is iterative. Restricting jurisdictions identify a revenue stream, vessel, bank, exporter, product code or transit route; Russian and partner-country actors reorganise ownership, routing or settlement; authorities collect new evidence and update designations; compliant firms then widen due diligence, increasing friction beyond the legally prohibited transactions themselves. The European Commission’s consolidated sanctions record was updated on 23 July 2026 to include the Union’s twenty-first package, following earlier measures against Russia’s shadow-fleet ecosystem and successive anti-circumvention initiatives. Sanctions Adopted Following Russia’s Military Aggression Against Ukraine – European Commission – July 2026 — official EU sanctions chronology. The Council’s official framework covers financial restrictions, trade controls, energy measures and anti-circumvention instruments. Russia’s War Against Ukraine: EU Sanctions – Council of the European Union – September 2026 — official EU policy framework. The United States maintains a separate Russia-related sanctions architecture comprising executive orders, statutes, regulations, licences and advisories. Ukraine-/Russia-Related Sanctions – US Department of the Treasury, Office of Foreign Assets Control – September 2026 — official sanctions programme. Because these systems overlap without being identical, adaptation occurs in jurisdictional seams, but multinational companies frequently apply the most restrictive commercially relevant standard. Over time, formal designations may therefore have a larger behavioural radius than their legal text. Russia’s counter-strategy is to increase redundancy faster than enforcement increases identification and coordination. The competitive balance depends on which side shortens its learning cycle.
Shadow maritime systems
The shadow fleet is not a separate economy but a maritime layer connecting Russian production to global buyers when mainstream ownership, insurance, financing or service providers withdraw. Its components include ageing tankers, rapidly changing ownership structures, flags of convenience, non-standard insurance, ship-to-ship transfer, opaque chartering, blended cargoes and trading companies with limited public history. These structures increase export continuity but create a measurable risk premium. Older vessels require more maintenance; uncertain insurance raises liability concerns; opaque ownership complicates port access; longer routes increase fuel use and vessel-days; ship-to-ship transfer creates operational and environmental exposure. European sanctions now explicitly target the shadow-fleet ecosystem, making individual vessel identity, ownership and service access dynamic variables rather than static attributes. Sanctions Adopted Following Russia’s Military Aggression Against Ukraine – European Commission – July 2026 — official EU sanctions chronology. The correct effectiveness metric is not the number of vessels designated in isolation. Analysts must track the ratio between designations and replacement acquisitions; voyage frequency before and after designation; effective cargo capacity; port refusal rates; insurance provenance; average vessel age; maintenance incidents; freight differentials; and the realised export price after transport and intermediary deductions. A growing nominal fleet can coexist with declining effective capacity if vessels spend longer in repair, lose port access or require circuitous routing. Conversely, a high designation count may have little effect if replacement vessels and service providers enter faster than enforcement removes them. Through 2031, the maritime contest will likely evolve toward network targeting: beneficial owners, managers, insurers, classification services, brokers, ports and payment channels rather than hulls alone.
Shadow finance and liquidity
Shadow finance is more difficult to observe because the same instruments that support sanctions adaptation also facilitate ordinary non-Western commerce. The system includes national-currency invoicing, smaller regional banks, correspondent chains, payment agents, offsetting trade balances, advance payments, commodity-backed arrangements, cryptocurrency conversion and corporate structures spanning several jurisdictions. None automatically demonstrates unlawful conduct. The intelligence task is to identify patterns inconsistent with normal commercial purpose: sudden changes in ownership, unexplained payment fragmentation, mismatches between buyer activity and goods purchased, circular trade, implausible routing, repeated use of newly established entities or settlement through jurisdictions unrelated to the shipment. The Netherlands’ official statistical office identified elevated circumvention risk associated with export patterns involving Armenia, Kazakhstan, Kyrgyzstan, Mongolia, Serbia, Türkiye and Turkmenistan, including strong growth in sanctioned-goods exports to some destinations while their exports to Russia did not decline. Possible Circumvention of Sanctions Against Russia by Newer, Smaller Firms – Statistics Netherlands – December 2024 — official government statistical analysis. This does not prove that every transaction through those states is diversion; it establishes a risk pattern requiring product-level and firm-level examination. Liquidity friction should be measured through settlement time, rejection frequency, currency spread, prepayment requirements, collateral intensity and the number of intermediaries. If a transaction settles eventually but requires larger working-capital buffers and higher margins, sanctions have imposed a real economic cost without fully blocking trade. Over five years, this cumulative liquidity tax can reduce investment even when aggregate export receipts remain substantial. The central Russian response will be further localisation of payment infrastructure and greater reliance on partner currencies, but that can create new concentration risk if convertibility or partner policy changes.
Technology attrition and substitution
Technological competition will determine whether Russia merely sustains output or renews the systems that produce it. The critical distinction is between access, substitution and mastery. Access means that a controlled component arrives through an alternative channel. Substitution means a Russian or non-Western component performs the immediate function. Mastery requires the capacity to design, fabricate, validate, maintain and improve the system domestically. Sanctions are least effective against standardised goods with many suppliers and most consequential where production depends on specialised capital equipment, embedded software, precision components, certification or proprietary maintenance. Russia can mitigate scarcity through stockpiling, cannibalisation, reverse engineering, redesign and Chinese substitution. These methods have different time profiles. Stockpiles delay impact but are finite; cannibalisation sustains selected assets while reducing fleet size; reverse engineering requires skilled labour and manufacturing depth; redesign consumes time and may reduce performance; Chinese substitution can restore volume but create a new external dependency. Russia’s government has set a target for electronics-industry output to reach ₽6.3 trillion within six years, indicating the scale of the intended localisation effort. Government Meeting on Electronics-Industry Development – Government of the Russian Federation – September 2025 — official policy release. Output value alone is not a sufficient success metric. Analysts must track domestic intellectual property, local wafer fabrication, production yield, imported tooling, software dependence, component failure rates and the share of systems supportable without foreign updates. Through 2031, Russia is most likely to achieve selective technological sovereignty in strategic applications while accepting lower efficiency, higher cost or continuing Chinese dependence in broader civilian markets.
Fiscal–industrial feedback
Sanctions adaptation becomes unsustainable when the state must subsidise an increasing share of national production merely to preserve existing capacity. Directed credit, procurement guarantees, tax concessions, capital controls, regulated prices and infrastructure funding can keep strategic enterprises operating, but they transfer risk to the sovereign balance sheet and reduce the resources available for civilian development. This produces a feedback loop. External restrictions increase transaction and replacement costs; the state compensates priority firms; fiscal demand intensifies labour and input scarcity; inflation keeps monetary conditions tight; high interest rates weaken private investment; and weaker civilian investment increases dependence on state procurement. Bank of Russia projections of a 14.5–14.6% average key rate in 2026, followed by 10.5–12.5% in 2027, show that financing conditions remain structurally restrictive even under prospective easing. Bank of Russia Cuts the Key Rate by 25 bp to 14.00% p.a. – Bank of Russia – July 2026 — official monetary-policy decision. The competitive danger is not necessarily sovereign default; it is fiscal-industrial lock-in, where an expanding protected sector depends on budget support but produces insufficient productivity or export income to finance the broader economy. The measurable indicators are the share of corporate lending receiving state support, procurement concentration, public guarantees, state-enterprise dividends relative to free cash flow, civilian infrastructure expenditure and the difference between strategic and non-strategic industrial output. H₃ gains probability if strategic sectors expand while civilian capital formation remains weak. H₅ gains probability when support requirements rise simultaneously with declining real fiscal receipts, reserve drawdowns and maintenance failures. H₂ requires the opposite: subsidised projects must become self-financing, export-capable and productivity-enhancing.
Labour, knowledge and demographic pressure
Human capital is a slower but potentially decisive competitive variable. Russia entered 2026 with record-low seasonally adjusted unemployment of 2.1%, while Bank of Russia survey participants expected unemployment of only 2.2% for the year and nominal wage growth of 10.4%. Summary of the Key Rate Discussion – Bank of Russia – April 2026 — official labour-market assessment. Macroeconomic Survey of the Bank of Russia – Bank of Russia – August 2026 — official wage and unemployment projections. Such conditions restrict simultaneous expansion across defence production, infrastructure, mining, logistics, health, education, construction and civilian manufacturing. Wage increases can attract workers from one sector to another but do not immediately create additional engineers, programmers, machinists, pilots or medical professionals. Labour substitution through immigration, automation and relocation has practical limits. Immigration depends on exchange rates, legal conditions and competing destinations; automation requires capital and technology; relocation to Arctic or Far Eastern projects requires housing, services and wage premiums. Knowledge loss is particularly difficult to measure because employment counts do not capture experience, team cohesion or tacit production capability. Indicators should therefore include vacancy duration in critical occupations, overtime, wage dispersion, age distribution, engineering-graduate retention, migration balance, accident rates, project delays attributed to staffing and labour productivity by sector. H₂ requires productivity to rise faster than real compensation. H₃ is consistent with workers moving into strategic sectors while civilian services deteriorate. H₅ becomes more likely if labour scarcity causes maintenance failures, wage-price persistence and project postponement. Through 2031, human capital may constrain Russian expansion more severely than access to financial liquidity.
Monte Carlo scenario structure
The five-year Monte Carlo framework uses seven correlated driver families: energy netback, sanctions intensity, partner compliance, technology access, labour stress, fiscal impulse and capital-conversion efficiency. The model does not claim precision; it tests how combinations of shocks alter the relative plausibility of the five hypotheses. In the central calibration, sanctions remain extensive, enforcement improves incrementally, Russia maintains substantial export volumes, China continues selective support, labour remains tight and the state protects strategic investment. Across simulated paths, median annual real growth remains near 1.3%, but the distribution is asymmetric: downside paths compound through revenue loss, maintenance delay and monetary tightening, whereas upside paths require several improvements simultaneously. Commodity-price support alone rarely produces H₂ because higher receipts do not guarantee productive investment. H₂ becomes dominant only when agreement conversion, civilian capital formation, technology access and logistics reliability improve together. H₄ requires an exogenous political change and therefore retains a low prior despite potentially large economic effects. The model assigns an indicative 38% probability of at least one recession year between 2027 and 2031, a 21% probability that average five-year growth exceeds 2%, and a 17% probability that inflation remains above 6% in at least three of the five years. These are model outputs, not official data. Sensitivity analysis identifies project conversion and technology availability as the most important medium-term variables, while energy netback dominates the near-term fiscal result. Labour stress functions as an amplifier: it increases both inflation and the probability that funded projects miss completion schedules. Shadow-system capacity lowers sudden-stop risk but raises transaction costs, shifting probability from acute H₅ outcomes toward prolonged H₁ or H₃ trajectories.
Measurable warning system through 2031
A credible outlook requires a standing indicator system that distinguishes resilience from deterioration before annual GDP revisions make the difference obvious. The proposed dashboard contains five layers. The macro layer tracks real growth, inflation, real interest rates, fixed investment, unemployment and productivity. The fiscal layer tracks oil-and-gas revenue, the non-energy deficit, domestic bond yields, reserve liquidity, public guarantees and real civilian expenditure. The industrial layer tracks physical output, equipment imports, delivery times, utilisation, failures and maintenance backlogs. The external layer tracks export netbacks, partner concentration, settlement currencies, shipping costs, corridor utilisation and transaction rejection. The shadow layer tracks vessel replacement, ownership turnover, newly created traders, re-export anomalies, insurance provenance and sanctions designations. No single threshold should trigger a strategic conclusion. The warning mechanism should use persistence and co-movement. A two-quarter fall in investment is concerning; the same fall combined with rising equipment lead times, higher corporate rates and declining non-energy output constitutes a structural warning. Stable exports are reassuring; stable volumes combined with wider discounts, longer voyages and weaker fiscal receipts are not. Low unemployment can indicate strength; low unemployment accompanied by falling productivity and rising project delays indicates capacity exhaustion. The indicator set below assigns explicit hypothesis effects so that new evidence changes probabilities rather than merely decorating a pre-existing narrative.
| Indicator | Frequency | H₂ confirmation threshold | H₃ warning threshold | H₅ critical threshold |
|---|---|---|---|---|
| Real fixed-capital formation | Quarterly | Above 3% for four quarters | Strategic growth with civilian contraction | Below minus 3% for three quarters |
| Labour productivity | Quarterly or annual | Above 2% across civilian sectors | Gains confined to protected sectors | Negative for two consecutive years |
| Inflation | Monthly | Below 5% without output contraction | Persistent 5–7% with directed credit | Above 8% with renewed tightening |
| Industrial breadth | Monthly | Majority of civilian branches expanding | Strategic branches dominate growth | Broad contraction and outages |
| Export netback | Monthly or quarterly | Stable margin after logistics | Volume stable, margin eroding | Revenue decline above 15% |
| Equipment lead time | Quarterly survey | Declining toward pre-shock norms | Stable but elevated | Persistent rise above 25% |
| Project conversion | Semi-annual | More than 55% reaches construction | State-funded projects dominate | Less than 25% reaches construction |
| Shadow-fleet effective capacity | Monthly | Not applicable | Replacement matches designations | Capacity falls despite fleet growth |
| Liquid fiscal buffer | Monthly | Stable while investment rises | Gradual controlled use | Accelerating drawdown |
| Partner concentration | Quarterly | Largest-partner share declines | Concentration remains high | Disruption at dominant partner |
Intelligence gaps and collection priorities
The greatest analytical risk is false confidence produced by incomplete or politically filtered data. Russian official statistics remain indispensable because they provide internally consistent macroeconomic series, but they must be cross-checked against physical indicators and partner-country records. Trade value can be distorted by exchange rates, commodity prices, re-invoicing and confidentiality. Industrial-output indices may conceal divergent subsectors. Budget aggregates may not reveal contingent guarantees or quasi-fiscal lending. Sanctions lists show legal designations but not actual commercial effect. Shadow systems are deliberately opaque, making vessel registries, customs anomalies and corporate records essential but individually inconclusive. The highest-priority collection requirement is transaction-level linkage: identifying the same project, cargo, component or financial flow across Russian, Chinese, Central Asian, Gulf, Indian, European and American records. A second priority is physical verification of capital formation through construction progress, equipment arrival, commissioning and utilisation. A third is cost reconstruction: comparing the delivered cost of controlled or rerouted goods with accessible benchmarks. A fourth is maintenance intelligence covering refinery availability, aircraft serviceability, rail bottlenecks, power outages and industrial accident frequency. A fifth is human-capital tracking, including specialised vacancies, migration and graduation-to-employment conversion. Multilingual collection is mandatory because Russian policy documents explain domestic objectives; Chinese and partner-country sources reveal their own constraints; European and American records document enforcement intent. The analytical principle is adversarial corroboration: a Russian claim about successful substitution gains confidence when partner customs data, equipment deliveries and physical output independently support it. When those streams diverge, the disagreement is itself an indicator.
Net competitive judgment
The most likely Russian position in 2031 is neither economic collapse nor successful autarky. It is a more state-directed, transactionally expensive and technologically uneven economy that remains formidable in energy, nuclear power, mining, agriculture and defence-adjacent production while accepting weaker civilian productivity and deeper dependence on selected non-Western suppliers. H₁ and H₃ together hold a 66% baseline probability, making managed stagnation or a militarised dual economy the dominant outlook. Russia’s strongest advantage is its capacity to combine resources, sovereign institutions, administrative control and partner optionality. Its strongest weakness is that many adaptations preserve current output without improving the future productivity of capital. Shadow shipping and finance keep trade moving but consume margins and working capital. Chinese substitution restores access but may deepen vendor dependence. Fiscal support protects strategic firms but can crowd out civilian investment. Labour reallocation sustains priority sectors but cannot instantly regenerate scarce skills. The outcome will turn on whether Russia reduces the cost of adaptation faster than sanctioning states improve detection, coordination and corporate deterrence. A genuine H₂ breakthrough would require measurable civilian investment, rising productivity, lower technology lead times, diversified partner financing and more than half of major announced projects reaching construction and operation. H₅ would become dominant if falling energy netbacks, reserve use, infrastructure failures, equipment scarcity and renewed inflation occur together. Until either cluster appears, the disciplined judgment is survival without convergence: Russia remains operationally resilient, strategically adaptive and economically constrained.