













Executive Summary
- BLUF: China’s 15th Five-Year Plan is an execution architecture for technological sovereignty, industrial resilience and systemic security—not merely a growth programme.
- Beijing enters 2026–2030 with formidable manufacturing capacity but weakening investment transmission, constrained local-government balance sheets and insufficient household demand.
- The central contradiction is capital allocation: simultaneously funding technological substitution, industrial upgrading, social protection, debt stabilisation and energy security.
- Export strength supplies near-term macroeconomic oxygen but increases exposure to trade defence, market-access restrictions and supply-chain diversification.
- Technology policy will generate measurable industrial gains; its aggregate productivity payoff remains conditional on competition, private-sector confidence and capital discipline.
- Fiscal centralisation, household-income reform and orderly restructuring of non-viable local liabilities constitute the decisive implementation variables.
- The base case is controlled deceleration with selective technological success—not systemic collapse and not frictionless fulfilment.
- Five-year outcome: 68% probability of partial strategic fulfilment, 19% of accelerated transformation, and 13% of severe implementation stress.
China’s 2030 Test: The State Can Mobilise Capital—Can It Still Create Growth?
China has opened its 15th Five-Year Plan with an extraordinary concentration of fiscal power, industrial ambition and technological urgency. Yet the decisive contest is no longer between China and the West alone. It runs through China itself: between production and consumption, central command and local solvency, technological sovereignty and commercial productivity. Beijing can finance laboratories, factories, grids and strategic supply chains. It cannot administratively manufacture household confidence, profitable demand or infinite foreign-market tolerance. The outcome of the 2026–2030 plan will determine whether China converts industrial scale into sustainable national power—or merely transfers the costs of property, debt and demographic decline onto the state balance sheet.
The Command Architecture
On 12 March 2026, the National People’s Congress approved both the 15th Five-Year Plan and China’s first National Development Planning Law, giving legal structure to a system that links Communist Party priorities, national plans, annual budgets, ministerial programmes and provincial implementation.
The plan’s eighteen parts place the modern industrial system, technological self-reliance, digitalisation, domestic demand, environmental transformation and national security inside one hierarchy. Outline of the 15th Five-Year Plan – National Development and Reform Commission – March 2026.
This is not conventional economic planning. It is a national-power architecture. Integrated circuits, artificial intelligence, quantum technology, aerospace, future energy, embodied robotics and 6G are treated simultaneously as growth sectors, security assets and instruments of geopolitical autonomy.
The advantage is coordination. The central government can combine public research, procurement, technical standards, industrial parks, state-bank credit and infrastructure. The weakness lies in transmission: each national objective must pass through ministries, provinces, municipalities, banks and enterprises whose fiscal positions and incentives differ sharply.
Fiscal Power
Finance Minister Lan Fo’an presented an exceptionally expansionary 2026 configuration. The official deficit is CNY 5.89 trillion, approximately 4% of GDP. General public-budget expenditure is expected to exceed CNY 30 trillion. Beijing authorised CNY 4.4 trillion in new local special-purpose bonds, CNY 1.3 trillion in ultra-long special treasury bonds and CNY 300 billion to recapitalise major state-owned commercial banks. Total new government-bond issuance is planned at CNY 11.89 trillion, while central transfers to local governments reach CNY 10.42 trillion. 2026 Fiscal Policy Briefing – Ministry of Finance – 6 March 2026.
These figures demonstrate capacity, not unlimited space. China finances policy across multiple accounts: the ordinary public budget, government funds, special treasury securities, local bonds, policy banks and state-owned enterprises. The headline deficit consequently understates the state’s effective intervention, but gross issuance overstates the resources available for new development. Refinancing, interest, unfinished projects, bank support and social obligations absorb an increasing share.
The Investment Fracture
The first six months of 2026 reveal the central contradiction. Fixed-asset investment fell 5.7% to CNY 22.637 trillion. Even excluding real estate, it declined 2.7%. Infrastructure investment fell 2.4%, manufacturing 1.2%, and private investment 8.5%—or 4.9% excluding property.
Yet high-technology investment increased 4.6%. Intellectual-property-product investment rose 9.4%; aerospace-equipment investment 23.3%; information services 15.5%; computer and office-equipment manufacturing 8.1%. First-Half 2026 Economic Results – National Bureau of Statistics – 15 July 2026.
China is therefore not suffering from a uniform shortage of capital. It is dividing into a strategic economy, where administrative priorities continue to mobilise investment, and a broader market economy, where expected returns remain weak.
That distinction will define the plan. Beijing can enlarge production capacity by decree-supported finance. It cannot prove that capacity is productive unless firms generate operating cash flow, private investors contribute without state guarantees and new technologies reduce unit costs across the economy.
Property’s Long Shadow
Real estate remains China’s most important domestic transmission mechanism. During the first half of 2026, development investment fell 18%. The floor area of newly built commercial property sold declined 11.6% to 401.4 million square metres; sales value dropped 13.6% to CNY 3.7945 trillion.
The effects extend far beyond construction. Weaker housing transactions reduce developer liquidity and household wealth expectations. Lower land demand cuts local-government revenue. Suppliers wait longer for payment. Banks carry property and local-public-sector exposure. Households save more because their principal asset and future employment appear less secure.
Restoring the former property model would reproduce the imbalance. The rational objective is narrower: complete viable presold housing, restructure insolvent developers, convert suitable inventory to rental or social use, allow unproductive capacity to exit and protect the financial system from disorderly contagion. Success by 2030 would mean a smaller but financeable housing sector—not another debt-driven construction cycle.
The Consumption Gap
Household income is rising, but demand is responding more slowly. During the first half of 2026, per-capita disposable income reached CNY 22,981, up 5.2% nominally and 4.2% in real terms. Per-capita consumption expenditure was CNY 14,836, increasing only 3.7% nominally and 2.7% in real terms.
The median disposable income, CNY 19,036, was only 82.8% of the average. Urban per-capita income reached CNY 30,126, against CNY 12,699 in rural areas. Food and residence absorbed 51.7% of reported household expenditure. Household Income and Consumption, First Half 2026 – National Bureau of Statistics – 16 July 2026.
Retail sales consequently grew only 1.3%, despite online sales of goods and services increasing 5.2%. Product subsidies can advance the purchase of appliances, vehicles and electronics, but they cannot replace durable household purchasing power.
The strategic reform is social, not promotional. Credible pensions, healthcare, unemployment insurance, childcare, affordable housing and portable benefits would reduce precautionary saving. Without that shift, “dual circulation” will remain production-heavy: China will generate advanced goods that domestic households cannot absorb in sufficient volume.
The Local-Debt Trap
Official local-government debt stood at CNY 54.823 trillion at the end of 2025: CNY 17.512 trillion in general debt and CNY 37.311 trillion in special debt. Local bonds carried an average remaining maturity of 10.5 years and an average interest rate of 2.83%. Interest payments reached approximately CNY 1.484 trillion during 2025. Local Government Debt Balance – Ministry of Finance – January 2026.
This official perimeter excludes part of the economic exposure associated with local financing vehicles, guarantees, arrears and local state-owned enterprises. Beijing identified CNY 14.3 trillion in hidden local debt at the end of 2023 and authorised CNY 6 trillion of additional debt limits over 2024–2026 to replace such obligations.
Swaps reduce interest and extend maturities. They do not transform an unproductive asset into a profitable one. Genuine resolution requires some combination of central transfers, asset sales, project restructuring, creditor losses and clearer division of responsibilities between Beijing and local governments.
Without reform, fiscal risk will not necessarily appear as a spectacular default. It will emerge as delayed payments, repeated refinancing, weak public services and bank credit trapped in politically protected projects.
The Demographic Bill
In 2025 China registered 7.92 million births and 11.31 million deaths. Natural population growth fell to −2.41 per thousand. The population aged 60 and over approached 323 million, while the 15–59 age group declined to about 868 million. 2025 Statistical Communiqué – National Bureau of Statistics – February 2026.
The demographic constraint operates through several channels simultaneously: fewer workers, higher pension and healthcare expenditure, weaker household formation and uneven regional housing demand. Beijing has begun raising the male statutory retirement age from 60 to 63 over fifteen years, with staged increases for women. The reform can slow labour-force contraction; it cannot rapidly reverse fertility.
Automation becomes essential, but only productivity can turn fewer workers into higher incomes and adequate fiscal revenue. Robots installed in loss-making factories do not solve ageing. Capital must migrate from low-return property and redundant capacity toward enterprises capable of generating more value per worker and per unit of debt.
Europe’s Exposure
China’s export machine provides the demand that its domestic economy still lacks. In the first half of 2026, exports increased 13.4% to CNY 14.731 trillion. Mechanical and electrical products grew 20.1% and represented 63.5% of exports. Private companies generated 57% of total goods trade.
Europe is the most sensitive external pressure point. In 2025 the EU imported EUR 559.4 billion in goods from China and exported EUR 199.6 billion, producing a deficit of EUR 359.8 billion. EU exports fell 6.5%, while imports from China rose 6.4%. Trade in Goods with China in 2025 – Eurostat – 10 April 2026.
The relationship is not reducible to European dependence. China requires Europe’s market, industrial machinery, chemicals, capital and regulatory acceptance. The EU increasingly possesses instruments to investigate foreign subsidies, restrict procurement, screen investment and impose trade remedies.
For Beijing, overseas production may preserve access, but it also transfers employment, capital and part of the value chain abroad. The more China relies on localisation to bypass trade barriers, the less of each export euro remains inside its domestic industrial system.
The Technology Chokepoint
China dominates many manufacturing ecosystems but remains exposed at selected technological bottlenecks. On 2 December 2024, the US Bureau of Industry and Security imposed new controls on 24 categories of semiconductor-manufacturing equipment, three categories of software and high-bandwidth memory, while adding 140 entities to its restricted list. The controlled technologies include etching, deposition, lithography, ion implantation, annealing, metrology and inspection. Advanced-Semiconductor Export Controls – US Department of Commerce – December 2024.
Washington adjusted—not abandoned—the strategy on 13 January 2026, moving exports of Nvidia H200, AMD MI325X and comparable processors to case-by-case review under security conditions. The objective is selective containment: deny military and frontier capabilities without surrendering the commercial market entirely.
China’s answer is substitution. But obtaining a prototype is not equivalent to achieving reliable yield, scale, maintenance and frontier performance. The decisive indicators are domestic-tool penetration in operating fabrication plants, high-bandwidth-memory availability, advanced-packaging output and the share of AI workloads supported by indigenous hardware.
Reciprocal Leverage
Beijing also controls strategic nodes. In April 2025, the Ministry of Commerce imposed licensing controls on specified medium and heavy rare-earth products. In 2025, China supplied 92% of EU magnesium imports, 77% of gallium imports and 68% of ferro-tungsten import value.
This gives China short-term leverage over automotive, electronics, defence and clean-energy supply chains. Yet coercive use accelerates diversification, recycling, alternative chemistry and new processing outside China. The most durable leverage is therefore not an outright embargo, but licensing authority that preserves uncertainty while continuing compliant civilian trade.
The technological contest is becoming reciprocal: the West controls selected frontier tools; China controls critical processing stages. Each side can impose pain. Neither can do so without accelerating the other’s search for substitutes.
The Energy Hedge
China’s energy transition is also a security strategy. Clean-energy investment exceeded USD 625 billion in 2024. By March 2026, renewable capacity had reached 2.395 billion kilowatts, or 60.4% of total installed generating capacity.
But capacity is not guaranteed output. Wind and solar require storage, flexible grids and interprovincial transmission. Oil, gas, petrochemicals, aviation and heavy industry retain substantial external exposure. Coal therefore remains Beijing’s strategic backup: domestically available and dispatchable, but environmentally and economically costly.
The optimal structure is not fossil or renewable. It is redundancy: renewables, nuclear, coal backup, strategic fuel inventories, pipelines, diversified maritime suppliers and a grid capable of transferring electricity across provincial borders.
The Decision
China is unlikely to become externally autonomous by 2030. It can, however, become harder to coerce. That distinction captures the plan’s true purpose.
The state has the instruments to prevent an uncontrolled property or local-debt collapse. It has the capital to accelerate strategic technology and energy infrastructure. What it cannot indefinitely do is protect every local balance sheet, subsidise every emerging industry, replace every foreign technology and depend on foreign consumers—all at once.
The decisive reforms are uncomfortable: allow non-viable projects to fail, restructure local liabilities transparently, protect private investment, strengthen household security and accept that technological sovereignty carries an efficiency cost.
China’s 2030 test will not be measured by the number of factories built or bonds issued. It will be measured by whether those factories generate productivity, whether households become confident enough to consume, and whether the rest of the world remains willing to absorb the output.
Navigational Index
- The Execution State — Planning hierarchy, fiscal command, industrial policy and administrative transmission.
- The Domestic Constraint System — Investment, consumption, property, demographics, productivity and local liabilities.
- The External Strategic Envelope — Export dependence, technology access, European exposure, energy security and geopolitical fragmentation.
Master Abstract
China’s 15th Five-Year Plan for 2026–2030 should be interpreted as an integrated state-capacity programme designed to convert industrial scale into technological autonomy, domestic resilience and strategic freedom of action. Its structure places the modern industrial system, advanced scientific capability, digitalisation, a stronger domestic market, institutional reform, external opening, demographic policy, decarbonisation and national security inside a single implementation hierarchy. The plan therefore does not separate economic development from geopolitical security: semiconductor capacity, artificial intelligence, advanced machinery, energy systems, transport networks, data infrastructure, food supply and military modernisation become mutually reinforcing components of national power. The official outline comprises eighteen thematic parts and defines 2030 as an intermediate threshold on the route toward the 2035 modernisation objective. Outline of the 15th Five-Year Plan for National Economic and Social Development – National Development and Reform Commission – March 2026 — Verified official plan. The strategic logic is internally coherent: preserve a complete industrial base, automate and digitise traditional production, expand emerging industries, reduce critical foreign dependencies and develop a domestic market capable of absorbing higher-value output. Yet coherence at the central-planning level does not guarantee transmission through provinces, municipalities, state-owned enterprises, commercial banks and private firms. The operative intelligence question is therefore not whether Beijing possesses policy instruments—it possesses an unusually dense combination of planning authority, credit guidance, procurement power, regulatory control, public ownership and infrastructure coordination—but whether those instruments can produce commercially sustainable productivity gains without multiplying debt, redundant capacity and local protectionism. This report’s initial Bayesian assessment assigns a 68% probability to partial strategic fulfilment: substantial sectoral advances combined with persistent macroeconomic imbalances. Accelerated transformation receives 19%, conditional on fiscal rebalancing and stronger household income formation; severe implementation stress receives 13%, requiring a compound shock across property, local finance, exports and confidence.
The domestic starting position exposes the central execution paradox. Official statistics record 5.0% real GDP growth in 2025, retail sales of CNY 50.12 trillion, and fixed-asset investment of CNY 48.52 trillion, but investment declined 3.8%, infrastructure investment declined 2.2%, and real-estate development investment contracted 17.2%. Statistical Communiqué on the 2025 National Economic and Social Development – National Bureau of Statistics of China – February 2026 — Verified official statistics. The first half of 2026 did not establish a durable reversal: fixed-asset investment reached CNY 22.637 trillion and declined 5.7%, even as investment in intellectual-property products increased 9.4%. National Economy Operated within an Appropriate Range in the First Half of 2026 – National Bureau of Statistics of China – July 2026 — Verified official release. These figures indicate a widening distinction between strategically prioritised investment and broad capital formation. Beijing can direct additional resources toward laboratories, advanced manufacturing, computing infrastructure and industrial substitution, but the macroeconomic multiplier will remain restricted if property adjustment suppresses household wealth, local fiscal pressure delays expenditure, private firms defer expansion, or industrial margins deteriorate through excess supply. The International Monetary Fund identifies state-led debt-financed investment, weakening productivity, financial vulnerabilities, excess supply in tradable sectors and population ageing as interconnected medium-term constraints. People’s Republic of China: 2025 Article IV Consultation – International Monetary Fund – February 2026 — Verified institutional assessment. The decisive reform variable is consequently the distribution of national income and fiscal responsibility. If social insurance, pensions, healthcare, childcare and central transfers reduce precautionary saving, household consumption can become a genuine demand engine. If policy continues primarily to stimulate production and subsidised replacement purchases, domestic absorption may improve selectively while industrial output continues to outrun final demand. The constraint is not an absence of savings or productive capability; it is the institutional conversion of savings into sustainable consumption and productivity-enhancing investment.
The external environment simultaneously extends and narrows China’s strategic runway. Customs data place China’s 2025 merchandise exports at approximately USD 3.772 trillion, imports at USD 2.583 trillion, and the recorded goods balance at about USD 1.141 trillion. China’s Total Export and Import Values, December 2025 – General Administration of Customs – January 2026 — Verified official customs table. This surplus supplies production, employment, foreign-exchange and scale advantages, but it also externalises the consequences of insufficient domestic absorption and raises the probability of countervailing measures, anti-dumping action, procurement restrictions and sector-specific market barriers. The European Union imported EUR 559.4 billion in goods from China during 2025, exported EUR 199.6 billion, and registered a EUR 359.8 billion goods deficit; China represented 22.3% of total extra-EU goods imports. Trade in Goods with China in 2025 – Eurostat – April 2026 — Verified EU statistical release. China must therefore manage a dual external problem through 2030: maintaining access to affluent markets while preventing foreign controls from obstructing critical technological inputs. Russia and other politically aligned or non-aligned markets can provide energy, commodities, settlement channels and incremental demand, but they cannot automatically reproduce the combination of market depth, advanced equipment, intellectual property and commercial discipline available through the largest developed economies. The Bank of Russia’s external-sector reporting documents the continuing reconfiguration of cross-border settlement and trade conditions under financial restrictions, demonstrating both the adaptability and the transaction costs of alternative financial circuits. Balance of Payments, International Investment Position and External Debt, First Quarter 2026 – Bank of Russia – June 2026 — Verified Russian-language official report. The five-year geopolitical judgement is therefore conditional: fragmentation gives Beijing opportunities to construct parallel networks, but deeper fragmentation also increases duplication, compliance costs, technological bottlenecks and inventory requirements. Strategic autonomy can improve while economic efficiency deteriorates; whether China reconciles those outcomes will define the plan’s real success.
China Plan Execution Simulator
Structural Inputs
Scores are analytical assumptions, not official forecasts. Move each control to test alternative pathways.
Probabilistic Output
Bayesian priors update through correlated fiscal, demand, productivity, debt and external-shock channels.
Five-Year Execution Trajectory
Synthetic composite index: industrial upgrading, technology substitution, domestic absorption and fiscal sustainability.
Priority Warning Signals
Indicators that would materially update the five-year probability distribution.
The Execution State: China’s Planning Command System, 2026–2030
From political doctrine to legally structured execution
China’s 15th Five-Year Plan transforms strategic intent into a vertically organised system of legally sanctioned objectives, annual programmes, sectoral plans, territorial plans, fiscal appropriations, credit channels and performance controls. The critical institutional development is not simply the adoption of another planning document: on 12 March 2026, the National People’s Congress approved both the plan outline and the new National Development Planning Law, thereby codifying the procedures through which national plans are formulated, coordinated, implemented, monitored and adjusted. China Adopts Law on National Development Planning – State Council of the People’s Republic of China – March 2026 — verified official source. The law strengthens the juridical status of a system that already operated through political authority, administrative hierarchy and cadre accountability. The result is an execution state in which policy transmission follows several overlapping chains rather than a single command line. The Communist Party establishes strategic direction; the National People’s Congress legitimises the plan and budget; the State Council converts the programme into annual administrative priorities; the National Development and Reform Commission coordinates national-development targets and major projects; the Ministry of Finance determines fiscal envelopes and transfers; sectoral ministries convert objectives into technical programmes; provincial and municipal governments localise targets; state-controlled financial institutions allocate credit; and state-owned or politically responsive enterprises execute projects. The formal plan contains eighteen parts spanning industrial modernisation, scientific self-reliance, digitalisation, domestic-market integration, institutional reform, external opening, demographic policy, green transformation and national security. Outline of the 15th Five-Year Plan for National Economic and Social Development – National Development and Reform Commission – March 2026 — verified Chinese-language official plan. This architecture maximises mobilisation capacity, but it also creates an analytical problem: compliance with administrative targets can coexist with weak commercial returns, because the system can successfully deliver physical assets while failing to generate proportional productivity, household income or debt-service capacity.
Integrated Planning & Output System
Party Strategic Direction
National plan + planning law + NPC approval
NDRC
target/project coordination
Ministry of Finance
budget/transfer
Sectoral ministries
standards/plans
Financial regulators
credit rules
Provinces and municipalities
local plans · quotas · projects
- Translate national plan into specific local realities.
- Receive targets/quotas and allocate local budget.
- Oversee primary implementation and local firms.
SOEs
private firms
policy/state banks
Physical and financial outputs
Monitoring → inspection → correction → refinancing
- Systematic tracking of progress against targets.
- Inspection (Party/State) to verify results.
- Correction of deviations/failures.
- Refinancing or shifting funding to successful projects.
The hierarchy is strong at mobilisation and weaker at selection
The planning hierarchy possesses four distinctive execution advantages: it can establish long-duration priorities, coordinate complementary infrastructure, tolerate extended investment horizons and mobilise institutions that do not evaluate projects solely through short-term profitability. These characteristics are especially powerful in electricity grids, railways, industrial parks, computing infrastructure, aerospace programmes, semiconductor ecosystems and advanced manufacturing, where fragmented private investment may underprovide foundational capacity. The hierarchy nevertheless encounters a recurring selection problem. Central directives such as “new quality productive forces,” technological self-reliance or industrial upgrading are intentionally broad enough to mobilise multiple institutions, but their breadth permits provinces to label heterogeneous projects as nationally strategic. Local officials can rationally favour visible construction, subsidised factories and industrial clusters because these projects support employment, taxable activity, land development, political evaluation and regional prestige. The centre, meanwhile, wants experimentation but also seeks to prevent redundant capacity, local protectionism and so-called image projects. This tension explains the simultaneous promotion of strategic industrial investment and a unified national market. The January 2025 unified-market guideline established prohibitions addressing discriminatory market access, local protectionism, regional barriers, irregular procurement practices and local interference in competitive allocation. Guideline for Building a Unified National Market – State Council of the People’s Republic of China – January 2025 — verified official source. The policy implicitly recognises that administrative decentralisation can divide the national economy even while central political authority remains concentrated. The execution state therefore operates through a controlled contradiction: Beijing encourages local competition to accelerate industrial formation, but must subsequently suppress the duplication, protectionism and fiscal risk generated by that competition. Over 2026–2030, central success will depend less on issuing additional industrial priorities than on imposing project-selection discipline, permitting non-viable ventures to exit, preventing provincial subsidies from preserving structurally uncompetitive capacity, and measuring outcomes through productivity and cash generation rather than nominal investment or installed capacity.
| Command layer | Principal instrument | Intended transmission | Primary execution failure | 2026–2030 diagnostic |
|---|---|---|---|---|
| Party leadership | Strategic priorities and cadre direction | Align state institutions with national-security objectives | Political salience overwhelms economic selectivity | Frequency of priority changes and emergency campaigns |
| National legislature | Plan, law and budget approval | Formalise targets and funding authority | Legal hierarchy does not ensure commercial viability | Publication of implementation and adjustment rules |
| State Council/NDRC | Annual plans, project lists and coordination | Convert strategy into measurable programmes | Excessive target proliferation and inter-ministerial overlap | Number of targets linked to auditable outcome metrics |
| Ministry of Finance | Deficit, transfers, bonds and expenditure rules | Finance national priorities and stabilise local execution | Debt refinancing substitutes for liability resolution | Transfer dependence, interest burden and project cash flow |
| Provinces and cities | Local plans, land, subsidies and procurement | Adapt priorities to regional industrial systems | Duplication, protectionism and prestige investment | Cross-provincial consolidation and project cancellations |
| State financial system | Credit guidance, bond absorption and refinancing | Lower capital costs for strategic investment | Risk pricing becomes subordinate to policy compliance | Loan quality, maturity extension and bank recapitalisation |
| Enterprises | Capital expenditure, R&D and production | Deliver technology and industrial capacity | Output expansion without adequate profitability | Productivity, margins, patents used commercially and exports |
Fiscal command is large, but fiscal space is not unlimited
The 2026 budget demonstrates that China intends to open the 15th Plan with maximum fiscal mobilisation. The official deficit was set at approximately 4% of GDP, corresponding to CNY 5.89 trillion; general public-budget expenditure was programmed to exceed CNY 30 trillion; new local-government special-purpose bonds were set at CNY 4.4 trillion; ultra-long special treasury bonds at CNY 1.3 trillion; special sovereign bonds for recapitalising large state-owned commercial banks at CNY 300 billion; and central transfers to local governments at CNY 10.42 trillion. Aggregate new government bond financing was projected at CNY 11.89 trillion. Finance Minister Lan Fo’an at the Economic-Themed Press Conference of the Fourth Session of the 14th National People’s Congress – Ministry of Finance of the People’s Republic of China – March 2026 — verified Chinese-language official source. These instruments perform different functions and should not be analytically collapsed into the headline deficit. The general public budget supports administration, public services, transfers and policy expenditure; special-purpose local bonds finance authorised projects; ultra-long sovereign issuance supports major strategic programmes, equipment renewal and consumer trade-ins; bank recapitalisation protects credit-transmission capacity; and central transfers prevent local fiscal stress from disrupting essential services. This layered design gives Beijing more usable fiscal command than the headline deficit alone suggests. It also disperses liabilities across central budgets, local budgets, government funds, financial institutions and project entities, making consolidated risk more difficult to assess from any single account. The central government can extend maturities, reduce refinancing costs, exchange opaque liabilities for recognised bonds and recapitalise banks, thereby lowering immediate default probability. It cannot, however, manufacture project income or permanently eliminate losses through refinancing. The five-year fiscal test is whether debt instruments fund assets that raise taxable activity, productivity or household income, or merely preserve investment volume and postpone loss recognition. A high issuance capacity should therefore be interpreted as a stabilisation advantage, not evidence that fiscal constraints have disappeared.
| 2026 fiscal channel | Official amount | Operational function | Transmission dependency | Principal risk |
|---|---|---|---|---|
| Recorded government deficit | CNY 5.89tn | Macroeconomic support and budget balancing | Revenue performance and bond absorption | Structural deficit persistence |
| General public-budget spending | More than CNY 30tn | Public services, administration, transfers and policy programmes | Local implementation capacity | Rigid expenditure commitments |
| Local special-purpose bonds | CNY 4.40tn | Project finance and infrastructure | Eligible-project quality and revenue | Weak project cash flow |
| Ultra-long special treasury bonds | CNY 1.30tn | Strategic capacity, equipment renewal and national programmes | Central project selection | Long-duration capital misallocation |
| Bank recapitalisation bonds | CNY 0.30tn | Reinforce core Tier 1 capital | Bank governance and asset quality | Recapitalisation without balance-sheet repair |
| Central-to-local transfers | CNY 10.42tn | Equalisation and basic-service protection | Rules-based allocation and local discipline | Permanent transfer dependence |
| Total new government bonds | CNY 11.89tn | Combined fiscal expansion | Interest-cost control and market liquidity | Contingent-liability migration |
Administrative transmission depends on local fiscal survival
Local governments remain the indispensable middle layer of Chinese execution because they manage much of the country’s infrastructure, public services, industrial parks, land development, local state enterprises and project approvals. Their administrative importance exceeds their autonomous fiscal capacity, creating a vertical imbalance that central transfers and authorised borrowing must continuously bridge. The Ministry of Finance reported that nationwide general public-budget revenue during 2025 amounted to approximately CNY 21.604 trillion, while expenditure reached approximately CNY 28.740 trillion before final account adjustments. Report on the Execution of the Central and Local Budgets for 2025 and Draft Budgets for 2026 – Ministry of Finance of the People’s Republic of China – March 2026 — verified Chinese-language official report. This national aggregate does not establish the solvency of individual jurisdictions, but it demonstrates the scale of expenditure supported through deficits, transfers, carried balances and other fiscal channels. During the first half of 2026, national general public-budget revenue reached CNY 12.105 trillion, increasing 4.7%, according to the Ministry of Finance. Fiscal Revenue and Expenditure in the First Half of 2026 – Ministry of Finance of the People’s Republic of China – July 2026 — verified official source. That improvement provides near-term support, but aggregate revenue growth cannot reveal whether heavily indebted, property-dependent or industrially weaker localities possess sufficient discretionary funds for new policy mandates. The transmission risk is therefore heterogeneous. Wealthier coastal jurisdictions can co-finance laboratories, digital infrastructure and industrial upgrading; weaker jurisdictions may prioritise payroll, pensions, debt service and basic services, leaving strategic projects dependent on bond quotas or transfers. When local fiscal survival becomes the overriding objective, administrators may accelerate asset sales, increase fees, pursue aggressive revenue collection, pressure local enterprises, delay contractor payments or seek projects that maximise immediate financing rather than long-term returns. Beijing’s 2026–2030 challenge is to maintain local delivery capacity while preventing fiscal desperation from damaging the private sector the plan needs for innovation.
Debt conversion lowers liquidity risk but does not resolve solvency
The distinction between liquidity management and solvency repair is fundamental to assessing Chinese fiscal command. A debt swap can replace short-maturity, high-cost or opaque liabilities with longer-dated, lower-cost government bonds, improving cash flow and reducing immediate refinancing pressure. It does not automatically remove the underlying economic loss when the associated project cannot generate sufficient revenue. The International Monetary Fund’s 2025 Article IV assessment records a multiyear Chinese programme to exchange hidden local liabilities for official local-government debt and states that unsustainable local-government financing vehicle obligations require restructuring, including the use of insolvency frameworks. People’s Republic of China: 2025 Article IV Consultation – International Monetary Fund – February 2026 — [verified institutional report](https://
The Execution State: China’s Command Architecture, Fiscal Transmission and Industrial Control, 2026–2030
From political doctrine to legally structured execution
China’s 15th Five-Year Plan must be analysed as a vertically integrated system of political direction, legal planning, budgetary authorisation, administrative decomposition, financial mobilisation and local implementation. The plan is not a single expenditure programme and does not automatically appropriate every resource required for its objectives. It establishes the national hierarchy within which annual plans, ministerial programmes, provincial plans, sectoral regulations, public procurement, state-bank lending, special-purpose bonds, central transfers and state-owned-enterprise investment decisions are subsequently aligned. The institutional sequence begins with the Chinese Communist Party, whose recommendations define political priorities; proceeds through the State Council and the National Development and Reform Commission, which convert those priorities into a national planning architecture; and acquires formal legislative authority through approval by the National People’s Congress. In March 2026, China reinforced this hierarchy by adopting the National Development Planning Law alongside the 15th Five-Year Plan, formally codifying the formulation and execution of national development plans. China Adopts Law on National Development Planning – State Council of the People’s Republic of China – March 2026 — verified official source. The resulting structure transforms the 2026–2030 outline into the apex of a planning family rather than an isolated document. National special plans govern sectors or functions; regional plans translate priorities spatially; provincial and municipal plans identify projects and implementation instruments; annual economic plans establish shorter-cycle targets; and budgets determine the resources that can actually be committed. The official outline contains eighteen major parts addressing the industrial system, technological self-reliance, digitalisation, the domestic market, institutional reform, external opening, rural modernisation, regional development, population, welfare, environmental transformation, security and military modernisation. Outline of the 15th Five-Year Plan for National Economic and Social Development – National Development and Reform Commission – March 2026 — verified Chinese-language plan. The analytical implication is fundamental: execution failure can occur without formal policy reversal because each transition—from political objective to plan, plan to budget, budget to project, project to credit and credit to productive output—introduces a distinct transmission risk.
Systemic Planning Hierarchy
Strategic Direction, Capital Catalyst, & Implementation Loops
CCP Strategic Recommendations
National planning law + 15th Five-Year Plan
National special plans
- Industrial Modernization
- Green Transition Path
Regional plans
- Territorial Development
- Economic Zone Focus
Sectoral standards
- Technical Specifications
- Regulatory Programming
Annual national plans
Economic & Social Objectives
Financial Vector Convergence
- Central Budget Disbursements
- Monetary & Credit Guidance
- Policy-Bank Directed Lending
Local Administration Nodes
Provinces → counties → entities
SOEs
Private Firms
Research Inst.
Capacity, productivity, employment and security
The planning hierarchy and its enforcement mechanisms
Administrative transmission operates through overlapping mechanisms that are more powerful than a simple top-down order but also more vulnerable to distortion. The first mechanism is cadre accountability: national priorities are converted into measurable local responsibilities, inspections, reporting requirements and performance evaluations. The second is budgetary classification, through which expenditures for science, education, industrial transformation, transport, energy, agriculture, social protection and defence are assigned across central and subnational accounts. The third is project eligibility: central budgetary investment, special treasury bonds and local special-purpose bonds can be directed only toward categories authorised by national policy and implementing regulations. The fourth is regulatory mobilisation, including market-access rules, environmental requirements, technical standards, data governance and procurement conditions. The fifth is financial coordination, under which public banks, commercial banks, policy funds and state-owned capital are encouraged to support designated industries. The sixth is demonstration-zone governance: central authorities create pilots, industrial clusters, innovation centres, computing hubs and specialised development zones whose policies may later be replicated nationally. This produces an implementation state capable of concentrating resources rapidly, yet it also creates incentives for local governments to relabel conventional construction as strategic investment, compete to host identical emerging industries, exaggerate project readiness or preserve weak enterprises that satisfy employment and political objectives. Beijing’s unified-national-market policy therefore draws explicit red lines against local protectionism, regional market barriers, discriminatory procurement and inconsistent market-access practices. Guidelines for Building a Unified National Market – State Council of the People’s Republic of China – January 2025 — verified official source. This intervention is itself diagnostic evidence: the centre would not need repeated anti-fragmentation measures if provincial competition and local administrative protection were trivial. The five-year execution problem consequently involves two simultaneous imperatives. Beijing must preserve decentralised experimentation because provinces and municipalities identify projects, coordinate land and infrastructure, and respond to local industrial conditions; it must also prevent that decentralisation from producing duplicated capacity, subsidy races and administrative barriers. Central control and local initiative are therefore complementary in the design but potentially contradictory in operation.
| Planning layer | Principal authority | Primary instrument | Execution evidence | Main transmission risk |
|---|---|---|---|---|
| Political direction | CCP Central Committee | Recommendations, central commissions, cadre priorities | Inclusion in central strategic vocabulary | Objectives become excessively broad or politically non-negotiable |
| Legal-national planning | NPC, State Council, NDRC | Planning law and national outline | Legally structured plan hierarchy | Formal consistency without resource sufficiency |
| Annual macro execution | State Council, NDRC, Ministry of Finance | Annual plan, work report and budget | Annual targets and appropriations | Short-term stabilisation displaces structural reform |
| Sectoral decomposition | Ministries and commissions | Special plans, standards, catalogues, regulation | Sector-specific targets and eligible projects | Ministerial overlap and policy fragmentation |
| Financial mobilisation | Ministry of Finance, PBOC, financial regulators, policy banks | Bonds, transfers, refinancing and directed credit | Funding issuance and loan allocation | Credit reaches administratively favoured but low-return projects |
| Territorial delivery | Provinces, municipalities and counties | Local plans, land, procurement, industrial parks | Construction, operating assets and local KPIs | Duplication, hidden liabilities and protectionism |
| Enterprise execution | Central SOEs, local SOEs and private firms | Capital expenditure, R&D and production decisions | Commercial output, patents, productivity and exports | Capacity expansion without adequate final demand |
Fiscal command: scale, composition and the hidden constraint
The 2026 fiscal configuration demonstrates both the strength and the limits of China’s execution state. The official deficit was set at approximately 4% of GDP, corresponding to CNY 5.89 trillion; national general public-budget expenditure was planned to exceed CNY 30 trillion; newly authorised local-government special-purpose bonds totalled CNY 4.4 trillion; ultra-long special treasury bonds totalled CNY 1.3 trillion; special treasury bonds for replenishing the core Tier 1 capital of major state-owned commercial banks totalled CNY 300 billion; total newly added government bonds were expected to reach CNY 11.89 trillion; and central transfers to local governments were set at CNY 10.42 trillion. Minister Lan Fo’an’s Press Conference on the 2026 Fiscal Programme – Ministry of Finance of the People’s Republic of China – March 2026 — verified Chinese-language source. These figures reveal that fiscal command operates through several balance sheets rather than the headline deficit alone. General public-budget expenditure finances ordinary government functions and policy priorities; the government-fund budget contains significant land-related revenues and special-bond operations; special treasury securities fund centrally prioritised programmes; policy banks and state-owned banks enlarge the effective financing envelope; and SOEs undertake capital expenditure that does not appear as conventional government spending. The architecture creates considerable surge capacity because Beijing can combine bonds, transfers, bank capital injections, procurement and regulatory direction. Its weakness lies in the distribution of implementation obligations. Local governments deliver most public services and much infrastructure, but their revenues remain sensitive to property activity, land transactions, enterprise profitability and intergovernmental transfers. Central transfers can prevent abrupt expenditure contraction, but they cannot automatically repair every structural mismatch between local recurrent obligations and locally generated revenue. Special-purpose bonds can sustain investment, yet projects expected to generate repayment cash flows may prove insufficiently remunerative. Debt swaps can reduce near-term interest and refinancing pressure while leaving the underlying operating economics unchanged. Fiscal power must therefore be measured not only by gross issuance but by net resource availability after interest, refinancing, social obligations, unfinished projects and contingent support for financial institutions.
| 2026 fiscal instrument | Official scale | Intended execution function | Analytical limitation |
|---|---|---|---|
| Headline government deficit | CNY 5.89tn | General counter-cyclical support and expenditure financing | Excludes important activity in other fiscal accounts |
| General public-budget expenditure | More than CNY 30tn | Public services, welfare, science, administration and policy programmes | Large recurrent commitments reduce discretionary space |
| Local special-purpose bonds | CNY 4.4tn | Infrastructure, strategic projects and approved capital uses | Repayment quality depends on project cash flows |
| Ultra-long special treasury bonds | CNY 1.3tn | Major strategies, security capacity, equipment upgrading and trade-ins | Central prioritisation can crowd out lower-profile needs |
| Bank-capital special bonds | CNY 300bn | Core Tier 1 capital for major state-owned banks | Strengthens lending capacity but does not create bankable demand |
| Central-to-local transfers | CNY 10.42tn | Equalisation, basic services and local fiscal support | May preserve operations without resolving revenue assignment |
| Total newly added government bonds | CNY 11.89tn | Composite fiscal mobilisation | Gross funding overstates usable incremental stimulus |
Fiscal transmission under local-government and financial-system stress
The principal fiscal vulnerability is not an immediate inability of the sovereign centre to issue domestic-currency liabilities; it is the deterioration of transmission quality between central authorisation and local economic return. In the first half of 2026, national general public-budget revenue reached CNY 12.105 trillion, increasing 4.7%, according to the Ministry of Finance. Fiscal Revenue and Expenditure in the First Half of 2026 – Ministry of Finance of the People’s Republic of China – July 2026 — verified Chinese-language source. Revenue recovery improves the opening position, but fiscal sustainability depends on expenditure composition, local variation and liabilities outside the narrow budget perimeter. The International Monetary Fund’s financial-system assessment identified materialising risks from the property downturn and highly leveraged local-government financing vehicles, with smaller banks particularly vulnerable because of weaker business models and concentrated exposures. People’s Republic of China Financial Sector Assessment Program: Financial System Stability Assessment – International Monetary Fund – April 2025 — verified institutional report. The subsequent Article IV assessment called for restructuring unsustainable LGFV debt rather than relying exclusively on maturity extensions or accounting reclassification. People’s Republic of China: 2025 Article IV Consultation – International Monetary Fund – February 2026 — verified institutional report. The implementation risk can be expressed as a four-stage degradation chain. First, declining land and property-related income reduces local discretionary capacity. Second, local entities prioritise wages, social services, debt service and completion of existing projects. Third, new strategic programmes receive slower co-financing or depend more heavily on local SOEs and banks. Fourth, banks refinance politically important borrowers, thereby postponing recognition of weak assets and reducing capital available for commercially stronger private firms. None of these stages requires a nationally visible default. Administrative rollover can suppress acute volatility while progressively lowering the productivity of credit. The critical 2026–2030 indicator is consequently not merely outstanding debt; it is the proportion of new financing that generates sufficient operating cash flow, tax revenue or measurable productivity to service itself without renewed fiscal support.
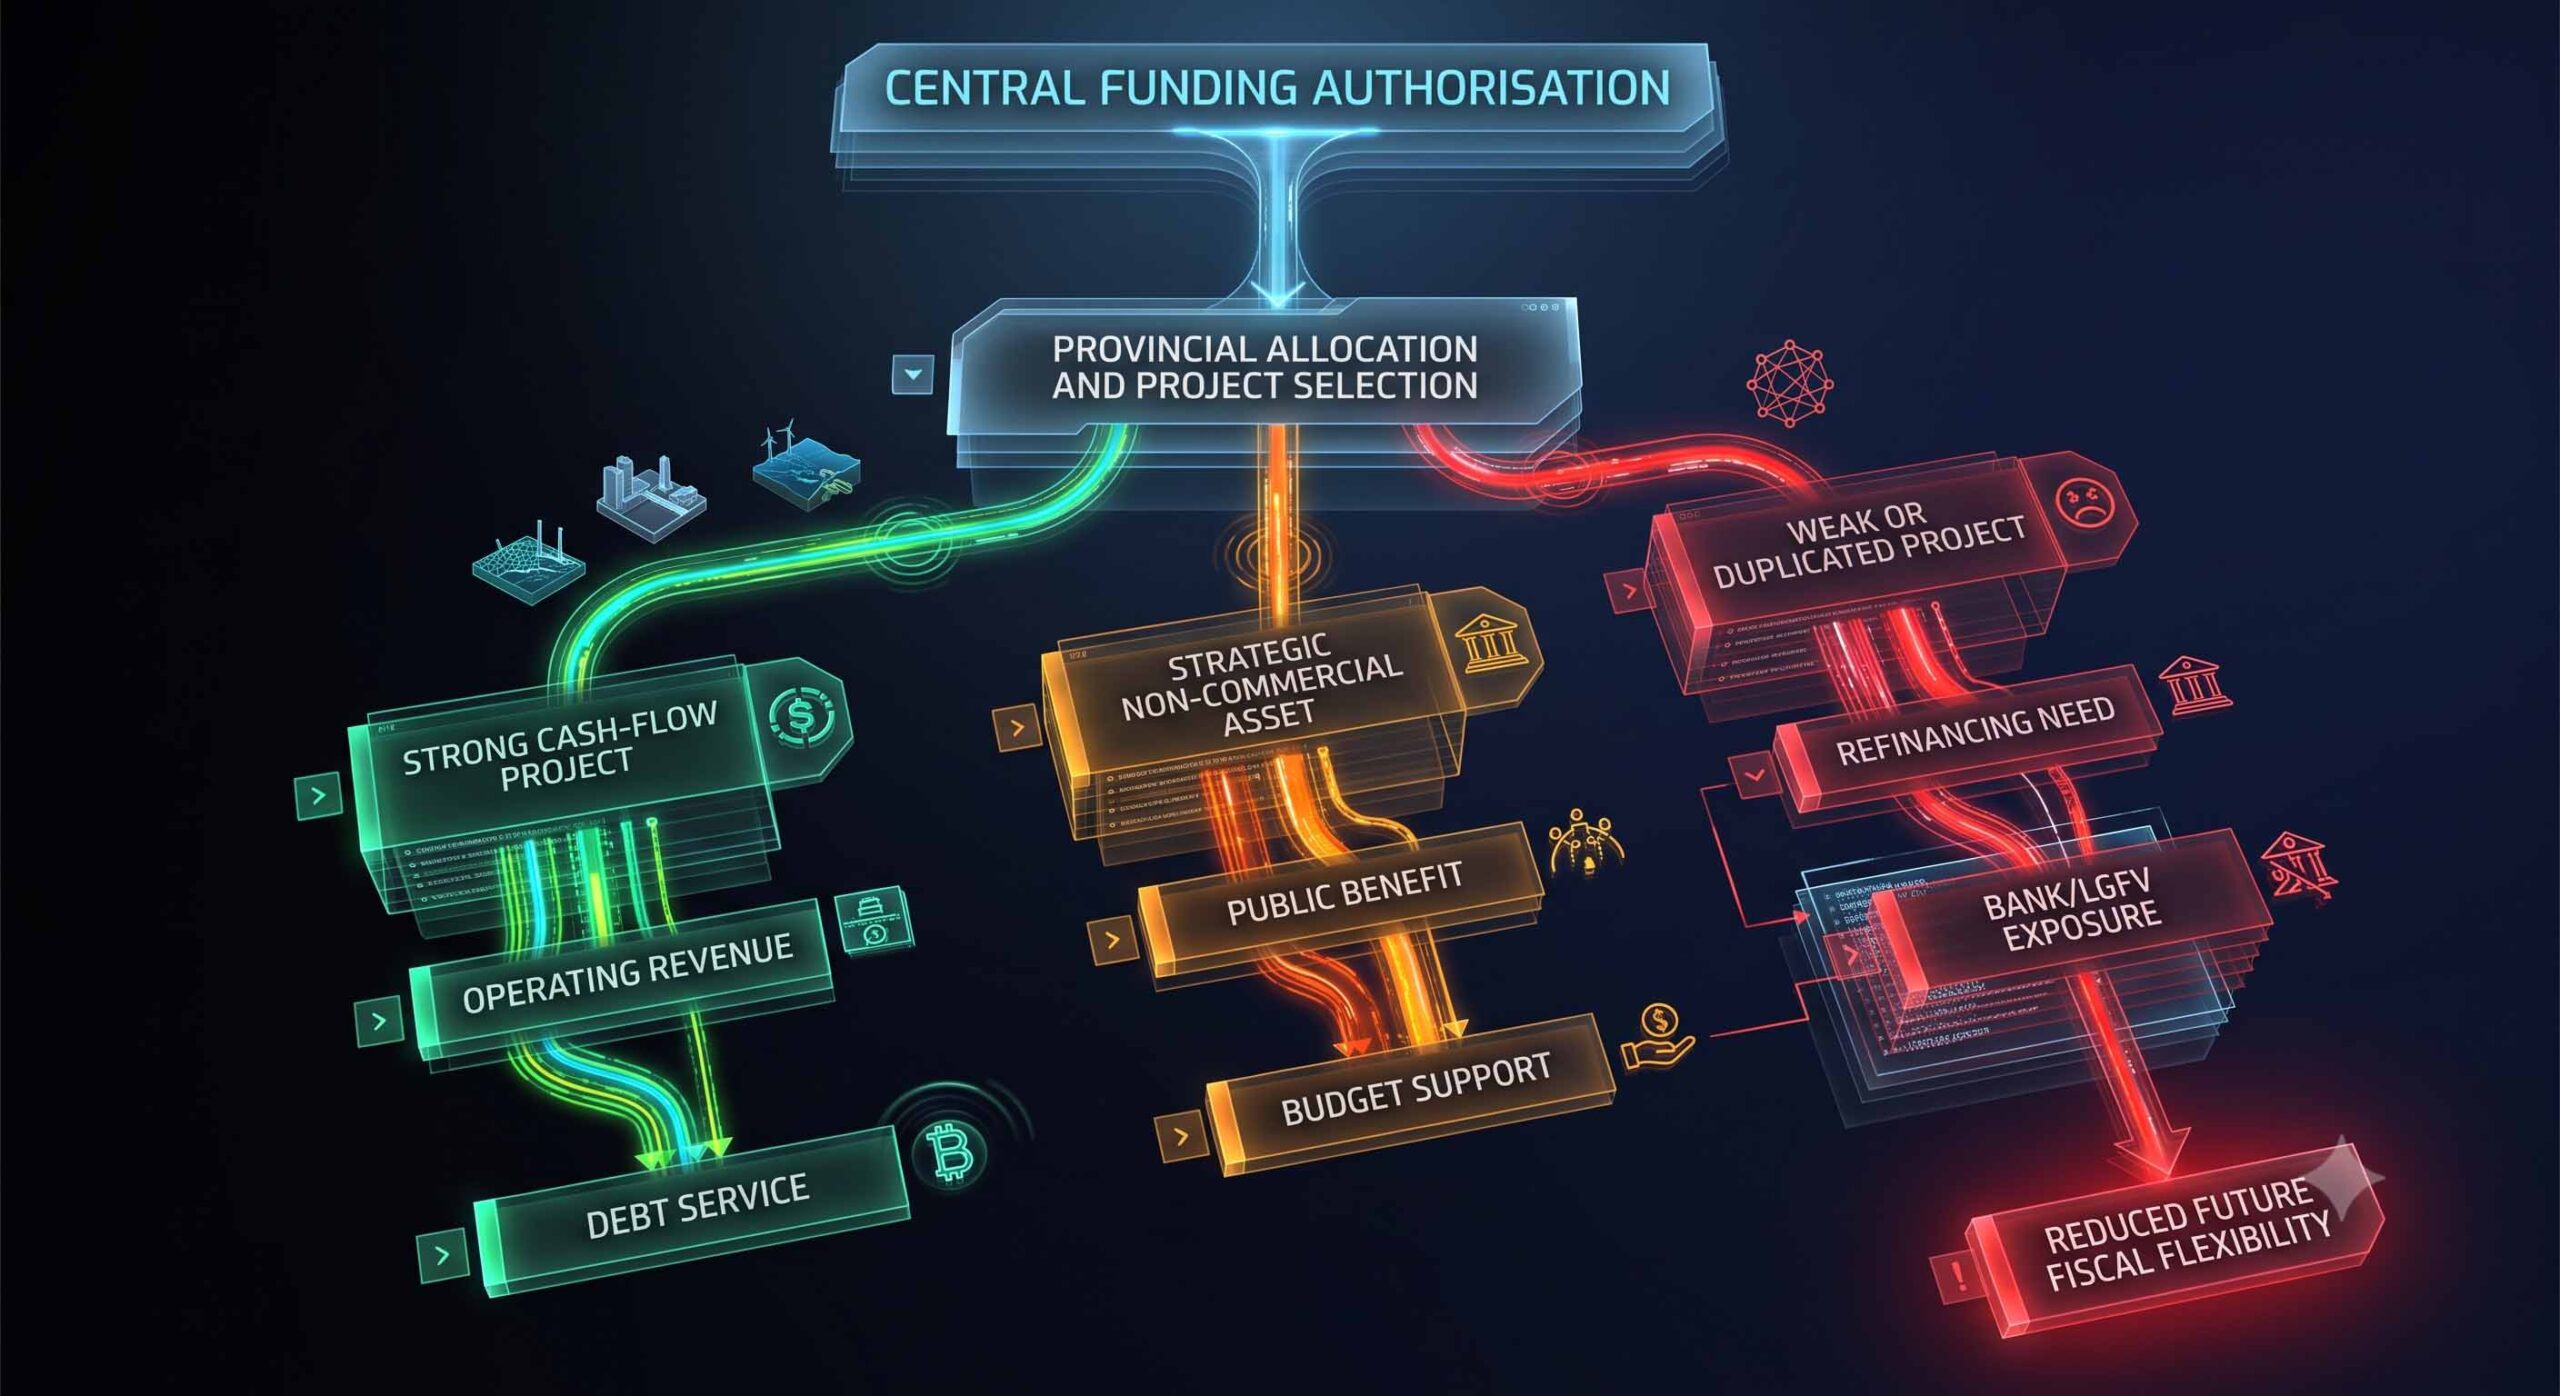
Provincial Allocation and Project Selection Overview
PROVINCIAL ALLOCATION AND PROJECT SELECTION
STRONG CASH-FLOW PROJECT
OPERATING REVENUE
DEBT SERVICE
STRATEGIC NON-COMMERCIAL ASSET
PUBLIC BENEFIT
BUDGET SUPPORT
WEAK OR DUPLICATED PROJECT
REFINANCING NEED
BANK/LGFV EXPOSURE
REDUCED FUTURE FISCAL FLEXIBILITY
Industrial policy as a portfolio of command channels
Industrial policy under the 15th Five-Year Plan is not reducible to subsidies. It consists of mission selection, public research, state laboratories, industrial standards, procurement, tax incentives, concessional finance, government-guided funds, infrastructure provision, data access, land allocation, cluster formation and controlled market creation. The state can generate early demand for technologies that private markets would adopt more slowly, coordinate complementary infrastructure and tolerate long development horizons in strategically important sectors. The 2026 work programme places integrated circuits, aerospace, biomedicine, the low-altitude economy, future energy, quantum technology, embodied artificial intelligence, brain-computer interfaces and 6G within the priority portfolio, while the continuing AI Plus initiative is intended to diffuse artificial intelligence across traditional and emerging industries. Highlights of the 2026 Government Work Report – Shanghai Municipal People’s Government – March 2026 — verified official government source. The national government projects AI-related industries exceeding CNY 10 trillion by 2030. China Details 2026 Policy Mix to Bolster Growth and Innovation – State Council of the People’s Republic of China – March 2026 — verified official source. That figure should be treated as an official policy objective, not an independently validated forecast, because broad definitions of AI-related activity can include enabling hardware, software, platforms, industrial applications and downstream services. The execution challenge is portfolio discipline. Successful missions require technical milestones, competitive procurement, failure recognition and exit mechanisms. Administrative systems often excel at capital mobilisation but face greater difficulty terminating politically sponsored projects, closing loss-making firms or allowing one locality’s industrial ambition to fail. A credible 2030 assessment must therefore separate four outputs: installed capacity, technologically autonomous capability, commercially competitive production and economy-wide productivity. China can increase the first two while failing to secure the latter two. Conversely, some redundancy may constitute deliberate security insurance rather than economic waste. The analytical task is to identify the point at which resilience spending becomes persistently value-destructive.
| Industrial-policy channel | Execution mechanism | Valid output metric | Misleading substitute |
|---|---|---|---|
| Public R&D | Laboratories, grants, national projects | Demonstrated technical performance and reproducibility | Patent counts without commercial application |
| Government-guided capital | Equity funds and co-investment | Private follow-on capital and sustainable returns | Fund size or announced commitments |
| Strategic procurement | Public and SOE demand | Competitive operating performance | Purchase volume protected from competition |
| Industrial clusters | Infrastructure and supplier concentration | Productivity, supplier depth and export competitiveness | Number of parks or occupied land area |
| Standards policy | Technical and interoperability rules | Adoption, quality and international compatibility | Quantity of standards issued |
| Credit guidance | Policy-bank and commercial-bank lending | Cash flow, productivity and repayment capacity | Loan growth alone |
| Equipment upgrading | Automation, robotics and digital systems | OEE, quality yield, energy intensity and unit cost | Gross equipment expenditure |
| Import substitution | Domestic alternatives for critical inputs | Reliability, yield, scale and lifecycle cost | Nominal domestic-content percentage |
Administrative transmission and the private-sector confidence problem
The most consequential implementation divergence is emerging between targeted strategic activity and broad private investment. During the first half of 2026, fixed-asset investment declined 5.7%, manufacturing investment declined 1.2%, infrastructure investment declined 2.4%, real-estate development investment declined 18.0%, and private investment declined 8.5%. In contrast, high-technology investment increased 4.6%, including growth of 23.3% in aerospace vehicle and equipment manufacturing, 15.5% in information services and 8.1% in computer and office-device manufacturing. National Economy Operated within an Appropriate Range in the First Half of 2026 – National Bureau of Statistics of China – July 2026 — verified official statistical release. This pattern demonstrates that administrative selection is still capable of producing capital expansion in favoured domains, but it also raises the risk of an increasingly bifurcated economy. If private investment contracts while state-directed strategic investment expands, technological projects may remain financially dependent on public demand, state banks and protected procurement. The policy objective should not be interpreted as replacing private firms with SOEs: private companies remain essential across advanced manufacturing, platforms, consumer technology, export supply chains and specialised components. The execution problem is instead the credibility of the operating environment. Firms make long-duration investments when expected returns are protected by predictable regulation, fair procurement, reliable property rights, access to finance and credible exit mechanisms. Local governments may publicly support private enterprises while simultaneously favouring local SOEs, extracting fees, delaying payments or conditioning market access on local investment. The unified-market programme seeks to suppress precisely these behaviours. By 2030, the most informative measure of administrative quality will be whether strategically important private firms invest without requiring continuous state risk absorption. A system in which private capital follows public capital voluntarily exhibits strong transmission. A system in which private capital participates mainly because downside risk has been socialised exhibits apparent mobilisation but weaker economic validation.
External feedback: Europe, Russia and the administrative cost of fragmentation
China’s domestic execution state now operates inside an external policy environment that increasingly evaluates the financing origin, subsidy structure, technology content and security implications of Chinese industrial expansion. The European Union’s Foreign Subsidies Regulation has applied since July 2023 and authorises the Commission to address distortions caused by subsidies granted by non-EU governments to firms active in the Single Market. Foreign Subsidies Regulation – European Commission, Directorate-General for Competition – July 2023 — verified EU source. The Commission also asked member states to review outbound investments in semiconductors, artificial intelligence and quantum technologies, explicitly identifying these areas as carrying elevated economic-security risk. Investment Screening and Outbound-Investment Review – European Commission, Directorate-General for Trade and Economic Security – January 2026 — verified EU source. These instruments feed back into China’s internal execution architecture because provincial governments, SOEs and supported private companies must anticipate investigations, disclosure requirements, procurement exclusions, technology restrictions and localisation demands. External friction can therefore change the optimal form of industrial policy: direct exports may give way to overseas production, joint ventures, licensing, regional supply chains or greater concentration on domestic and emerging markets. Russia provides a different external channel. Its financial system has expanded alternative settlement practices and adapted external accounts under sanctions and trade restrictions, but the Bank of Russia’s documentation also records the macroeconomic and transaction effects of a constrained external environment. Balance of Payments, International Investment Position and External Debt, First Quarter 2026 – Bank of Russia – June 2026 — verified Russian-language official report. For Beijing, Russia offers energy, commodities, strategic depth and experience with non-Western settlement mechanisms; it does not eliminate China’s exposure to advanced-equipment bottlenecks, major consumer markets or globally accepted technical standards. The five-year implication is that geopolitical fragmentation strengthens the political rationale for self-reliance while simultaneously raising the fiscal cost of achieving it.
| External feedback vector | Domestic transmission channel | Likely Chinese administrative response | 2030 risk |
|---|---|---|---|
| EU subsidy investigations | Provincial support, SOE finance, overseas procurement | Greater subsidy traceability and overseas localisation | Supported firms lose market access or tender eligibility |
| Outbound-investment review | Foreign technology and venture-capital access | Domestic capital replacement and third-country structures | Slower access to frontier knowledge |
| Export controls | Equipment, design software and specialised inputs | Stockpiling, substitution and indigenous standards | Costly duplication and delayed technological convergence |
| Sanctions-related settlement fragmentation | Bank compliance and cross-border liquidity | RMB settlement and alternative payment channels | Higher transaction and counterparty risk |
| Supply-chain de-risking | Export demand and supplier location | Overseas manufacturing and diversified trade corridors | Domestic overcapacity if external absorption weakens |
| Foreign procurement restrictions | SOE and supported-firm export strategy | Local production, partnerships or market redirection | Lower returns on subsidised capacity |
Shadow dimensions: liquidity, cyber-governance and overseas security
Three shadow dimensions require explicit monitoring because conventional fiscal and industrial statistics do not fully capture them. The first is liquidity migration: when local financing vehicles, property developers or smaller banks face stress, obligations can be shifted across maturity profiles, public entities, bank balance sheets and government accounts without appearing as an immediate fiscal shock. This reduces observable volatility while increasing contingent claims and weakening the informational value of headline debt figures. The second is cyber-governance transmission. Industrial digitalisation and AI diffusion expand productivity opportunities, but they also increase dependency on trusted data, secure cloud infrastructure, model governance, industrial control systems and nationally approved cybersecurity standards. A severe cyber incident affecting grids, logistics, banks or advanced manufacturing could transform a technological-modernisation programme into a security-driven compliance programme, increasing costs and slowing diffusion. The third concerns overseas physical security, including private security providers, state-linked contractors and host-country protection of infrastructure. Under the user-mandated source hierarchy, no sufficiently comprehensive and auditable official series was located that would permit a quantified estimate of Chinese “mercenary dynamics.” This variable is therefore retained as a sentinel indicator, not assigned a direct numerical weight in the base model. Relevant warning events would include formal expansion of armed contractor mandates, changes in host-country status agreements, repeated attacks on Chinese infrastructure, or the transfer of project security costs onto state-owned enterprises and policy insurers. This conservative treatment prevents absence of admissible data from being converted into false precision. Across all three shadow dimensions, the common mechanism is off-budget or weakly visible risk transmission: liquidity obligations move between entities, cyber costs appear through compliance and operational disruption, and overseas security expenses enter project economics indirectly. The monitoring architecture must therefore integrate financial accounts, bank-capital measures, project delays, cybersecurity rules, insurance costs and overseas operating disruptions rather than treating each domain independently.
| Shadow indicator | Observable proxy | Base-model treatment | Escalation trigger |
|---|---|---|---|
| LGFV liquidity migration | Debt swaps, maturity extensions, bank exposures and arrears | High weight | Refinancing without operating-cash-flow improvement |
| Smaller-bank stress | Capital injections, mergers, deposit pressure and asset-quality deterioration | High weight | Repeated public intervention across multiple provinces |
| Industrial cyber exposure | Mandatory standards, incident reporting and control-system disruptions | Medium weight | Cross-sector operational interruption |
| Cross-border settlement fragmentation | RMB invoicing, correspondent access and payment delays | Medium weight | Persistent trade-payment bottlenecks |
| Overseas security contractors | Official mandates, procurement and host-state agreements | Sentinel only | Formal armed role or material project-security escalation |
| Policy-insurance concentration | Claims, country exposure and project restructuring | Medium weight | Synchronous losses across multiple corridors |
Analysis of Competing Hypotheses
The structured Analysis of Competing Hypotheses produces five distinct execution pathways. H₁, “disciplined managed execution,” predicts that the centre will maintain sufficient fiscal control to deliver strategic infrastructure, technological substitution and industrial upgrading while containing local instability through transfers, debt swaps and selective restructuring. H₂, “technology-first acceleration,” predicts exceptional results in AI, advanced manufacturing, aerospace, robotics, energy systems and selected semiconductor segments, but only moderate improvement in household demand and aggregate productivity. H₃, “fiscal recentralisation and domestic rebalancing,” requires a stronger transfer of revenue capacity and social expenditure toward households and local basic services, thereby reducing precautionary saving and allowing domestic demand to absorb a larger share of industrial output. H₄, “debt-constrained administrative drift,” predicts continued formal plan compliance but deteriorating project quality, repeated refinancing, delayed local payments and growing dependence on state-directed credit. H₅, “compound external-domestic disruption,” requires simultaneous escalation in market-access restrictions, critical-technology controls, property losses, local fiscal pressure and private-investment contraction. The evidence available in August 2026 most strongly supports H₁ and H₂ because high-technology investment continues to expand despite broad fixed-investment weakness, while the fiscal programme retains substantial mobilisation capacity. H₄ remains materially plausible because local liabilities and private-investment contraction can reduce transmission efficiency without producing a dramatic national crisis. H₃ has the greatest long-term macroeconomic value but presently requires stronger evidence of durable household-income redistribution, expanded social protection and fiscal reassignment. H₅ remains the least probable individual hypothesis, although its consequences would be nonlinear. The ACH framework therefore rejects both deterministic success and imminent collapse: the most probable outcome is uneven execution in which strategic sectors outperform the underlying domestic economy.
| Hypothesis | Prior probability | Evidence through July 2026 | Updated probability | Principal disconfirming indicator |
|---|---|---|---|---|
| H₁ Disciplined managed execution | 38% | Large fiscal envelope; legal planning hierarchy; selective investment resilience | 42% | Persistent failure of central funding to stabilise local delivery |
| H₂ Technology-first acceleration | 22% | High-tech and intellectual-property investment outperform broad FAI | 25% | Falling technical yields or sustained collapse in private follow-on capital |
| H₃ Fiscal recentralisation and demand rebalancing | 17% | Transfers and household-support measures expanding, but reform depth uncertain | 13% | Household consumption and disposable income remain structurally weak |
| H₄ Debt-constrained administrative drift | 17% | LGFV, property and smaller-bank risks remain material | 16% | Transparent restructuring and improving project cash flows |
| H₅ Compound disruption | 6% | External controls and domestic stress coexist but remain containable | 4% | Stable market access and successful local-debt resolution |
Monte Carlo model and five-year outlook
The five-year simulation treats implementation capacity as the joint product of fiscal transmission, project quality, private-capital participation, technological productivity, domestic-demand absorption and external access. The model uses 20,000 synthetic paths from 2026 through 2030, with bounded annual shocks and explicit correlations: property stress increases local fiscal stress and weakens smaller-bank asset quality; stronger private investment improves productivity conversion; external restrictions reduce technology access but increase domestic substitution expenditure; central transfers suppress short-term local stress but do not automatically raise project returns; and household-support reform improves demand with a lag. The output is analytical, not an official forecast. Under the central assumptions, the median execution index rises from 47 in 2026 to 66 in 2030 on a synthetic 0–100 scale. The 2030 interquartile range is 57–74, while the stress tail falls below 45 in approximately 11% of model paths. Strategic technology capability reaches or exceeds an index of 75 in roughly 36% of paths, but broad fiscal-productivity convergence reaches that threshold in only 18%, illustrating the likelihood that sectoral technological success will precede aggregate rebalancing. The strongest positive sensitivity is a combined improvement in private investment and project cash-flow discipline; the strongest negative sensitivity is correlated property, LGFV and external-market stress. The model assigns a 67% probability that China achieves substantial but incomplete plan execution, a 21% probability of accelerated execution with meaningful rebalancing, and a 12% probability of severe underperformance. These values update the previous initial assessment because the July 2026 fiscal-revenue data improve near-term capacity, while the first-half fixed-investment and private-investment data weaken the transmission outlook. Probability estimates should be revised quarterly rather than defended as static forecasts.
| Year | Median execution index | 25th percentile | 75th percentile | Dominant implementation task | Highest-risk bottleneck |
|---|---|---|---|---|---|
| 2026 | 47 | 41 | 54 | Establish legal, fiscal and sectoral implementation architecture | Broad investment and private confidence |
| 2027 | 52 | 45 | 61 | Convert bond issuance into operating projects | Local co-financing and project selection |
| 2028 | 58 | 49 | 67 | Scale industrial substitution and AI diffusion | Overcapacity and weak commercial validation |
| 2029 | 63 | 53 | 72 | Consolidate clusters and remove non-viable capacity | Resistance to closure and debt recognition |
| 2030 | 66 | 57 | 74 | Demonstrate measurable productivity and domestic absorption | Technology success without macro rebalancing |
Indicators that would force a Bayesian update
The execution-state assessment should be updated through a disciplined indicator set rather than through political announcements alone. Positive updates would follow a sustained recovery in private fixed investment excluding property, higher central transfers directed toward portable social benefits, transparent restructuring of non-viable LGFVs, falling local payment arrears, stronger industrial profit margins, increased private follow-on investment in government-seeded technologies, and evidence that AI and equipment-upgrade expenditure improves unit costs, energy intensity, quality and total-factor productivity. Negative updates would follow accelerating special-bond issuance without operating-revenue growth, repeated capital support for regional banks, rising dependence on non-tax fines or asset disposals, proliferation of near-identical provincial industrial clusters, widening divergence between output and final demand, or expanding foreign restrictions on Chinese subsidised firms. The official fiscal report records CNY 5.4 trillion trillion in national fiscal science-and-technology expenditure during the preceding five-year period, with average annual growth of 5.7%. Report on the Execution of the 2025 Central and Local Budgets and the Draft 2026 Budgets – Ministry of Finance of the People’s Republic of China – March 2026 — verified Chinese-language source. That historical mobilisation confirms capacity to fund science, but the 2026–2030 question is whether expenditure yields autonomous technical capability and commercially sustainable productivity. The intelligence system should therefore assign separate scores to funding input, physical completion, technical performance, commercial adoption and macroeconomic return. Conflating them would systematically overstate execution. By 2030, China is likely to possess more advanced industrial capacity, stronger domestic alternatives and deeper administrative control over strategic supply chains. Whether it also possesses a healthier allocation system will depend on the willingness of the centre to impose losses, eliminate redundant projects, protect private investment and transfer a larger portion of national resources toward household security and consumption.
China Execution-State Projection, 2026–2030
The Domestic Constraint System: China’s Investment, Consumption, Property, Demography, Productivity and Local-Liability Nexus, 2026–2030
The constraint is a system, not a collection of weaknesses
China’s domestic constraint is best represented as a self-reinforcing balance-sheet system rather than six independent macroeconomic problems. The property adjustment reduces housing transactions, developer investment and land demand; weaker land-related revenue constrains local governments; constrained local governments defer payments, reduce discretionary expenditure and rely more heavily on refinancing; delayed payments and weaker public demand reduce corporate cash flow; uncertain employment, property wealth and social-security costs raise household precautionary saving; weak household demand then lowers the commercial return on new investment, while state-directed investment continues to increase production in selected sectors. The resulting gap between production capacity and final domestic absorption pushes firms toward exports, price competition or additional borrowing. This mechanism explains why strong industrial output, rapid growth in selected high-technology industries and large fiscal mobilisation can coexist with weak private investment, property contraction and subdued household consumption. The first half of 2026 supplies direct evidence of this divergence: fixed-asset investment declined 5.7%, manufacturing investment declined 1.2%, infrastructure investment declined 2.4%, real-estate development investment declined 18.0%, and private investment declined 8.5%; high-technology investment nevertheless increased 4.6%, investment in intellectual-property products rose 9.4%, and investment in aerospace vehicle and equipment manufacturing increased 23.3%. National Economy Operated within an Appropriate Range with New Growth Drivers Developing Rapidly in the First Half Year – National Bureau of Statistics of China – July 2026 — verified official source. These figures do not describe an economy uniformly starved of capital. They describe an economy in which administrative and strategic channels still mobilise resources, while market-based investment signals remain substantially weaker. The critical 2026–2030 question is therefore whether China can repair household, property and local-government balance sheets quickly enough for new productive capacity to generate commercially sustainable returns.
Economic Transmission Matrix
Dynamic Property Sector Default and Structural Contraction Loops
Property sales and prices weaken
Developer cash flow contracts
- Construction and land purchases fall
- Suppliers, banks and homebuyers absorb losses
Household expectations weaken
- Household wealth expectations weaken
- Precautionary saving rises
Land-related revenue declines
- Local investment and services weaken
- Arrears and refinancing requirements rise
- Banks carry more public-sector exposure
Private investment and demand weaken
Capacity seeks exports or policy-supported demand
Investment: strategic acceleration inside aggregate contraction
The investment data reveal three separate economies operating within the same national system. The first is the contracting property economy, where falling construction, sales and developer funding remove a formerly powerful source of fixed-capital formation. The second is the weakening broad market economy, reflected in declining private investment even after excluding property. The third is the strategic investment economy, where aerospace, computing, information services, artificial intelligence, advanced machinery and intellectual-property products continue to receive capital. During the first half of 2026, total fixed-asset investment excluding rural households amounted to CNY 22.637 trillion, but fell 5.7% year on year. Excluding real estate, it still declined 2.7%. Private investment contracted 8.5%, or 4.9% after excluding property, while secondary-sector investment fell 1.1% and tertiary-sector investment fell 8.4%. National Economy Operated within an Appropriate Range with New Growth Drivers Developing Rapidly in the First Half Year – National Bureau of Statistics of China – July 2026 — verified official source. The distinction between gross investment and productive investment is decisive. Spending can support near-term GDP and employment while producing limited future cash flow if it finances redundant infrastructure, duplicative industrial parks or capacity in markets already exposed to falling prices. Conversely, technically successful substitution projects may initially produce low financial returns because their strategic value lies in reducing dependence on foreign suppliers. A rigorous assessment must therefore classify investment through at least five lenses: whether it is commercially demanded; whether it improves unit productivity; whether it generates debt-service capacity; whether it provides a measurable public good; and whether it supplies national-security insurance. China can rationally accept low commercial returns for some security assets, but it cannot classify every low-return project as strategic without weakening fiscal solvency. Through 2030, the most important investment indicator will be not the volume of capital mobilised but the conversion ratio from expenditure to operating revenue, productivity, resilient supply and private follow-on investment.
| H1 2026 investment indicator | Official result | Systemic interpretation | 2030 monitoring relevance |
|---|---|---|---|
| Total fixed-asset investment | CNY 22.637tn; −5.7% | Broad capital formation remains weak | Determines aggregate-demand and employment support |
| FAI excluding real estate | −2.7% | Weakness extends beyond property | Tests whether the non-property economy can absorb capital |
| Private investment | −8.5% | Confidence and expected returns remain impaired | Central measure of market validation |
| Private investment excluding property | −4.9% | Property is not the sole cause | Indicates regulatory, demand and profitability constraints |
| Manufacturing investment | −1.2% | Industrial expansion is no longer uniform | Signals sectoral consolidation or weak margins |
| Infrastructure investment | −2.4% | Local fiscal transmission is constrained | Exposes subnational funding weakness |
| High-technology investment | +4.6% | Administrative selection remains effective | Tests strategic upgrading |
| Intellectual-property-product investment | +9.4% | Capital is shifting toward intangible assets | Potential productivity accelerator |
| Aerospace equipment investment | +23.3% | Security-linked industrial policy is expanding | High strategic value; uncertain commercial multiplier |
| Information-services investment | +15.5% | Digital infrastructure remains prioritised | Supports AI and industrial digitalisation |
Consumption: rising income has not produced equivalent demand transmission
Household data show positive income growth but a weaker conversion of income into expenditure. In the first half of 2026, national per-capita disposable income reached CNY 22,981, rising 5.2% nominally and 4.2% in real terms. Per-capita consumption expenditure reached CNY 14,836, rising 3.7% nominally and only 2.7% in real terms. The median disposable income was CNY 19,036, equivalent to 82.8% of the average, demonstrating that the mean income level materially exceeds the income received by the person at the centre of the distribution. Urban per-capita disposable income was CNY 30,126, while rural disposable income was CNY 12,699; urban consumption was CNY 18,071, compared with CNY 10,180 in rural areas. Households’ Income and Consumption Expenditure in the First Half of 2026 – National Bureau of Statistics of China – July 2026 — verified official source. A simple ratio derived from these official values places reported per-capita consumption expenditure at approximately 64.6% of average disposable income and 77.9% of median disposable income; these ratios are descriptive, not equivalent to national-accounts consumption shares because the survey definitions and coverage differ. The more important signal is the growth differential: real income grew 1.5 percentage points faster than real consumption, indicating that households retained a larger portion of incremental purchasing power. The mechanism is consistent with uncertainty surrounding employment, housing wealth, education, healthcare, childcare and retirement. Trade-in subsidies can accelerate purchases of appliances, vehicles and electronics, but they primarily change the timing or composition of expenditure. Durable consumption rebalancing requires households to expect that future medical, pension, education and unemployment costs will be manageable without maintaining large liquid buffers. By 2030, the success criterion is therefore not higher retail sales during subsidy campaigns; it is a durable decline in precautionary saving supported by portable and credible social insurance.
| H1 2026 household indicator | Absolute value | Nominal growth | Real growth or share |
|---|---|---|---|
| Per-capita disposable income | CNY 22,981 | 5.2% | 4.2% real |
| Median disposable income | CNY 19,036 | 4.7% | 82.8% of average |
| Urban disposable income | CNY 30,126 | 4.4% | 3.4% real |
| Rural disposable income | CNY 12,699 | 6.4% | 5.5% real |
| Per-capita consumption | CNY 14,836 | 3.7% | 2.7% real |
| Urban consumption | CNY 18,071 | 3.0% | 2.0% real |
| Rural consumption | CNY 10,180 | 4.6% | 3.8% real |
| Wage income | CNY 13,298 | 5.3% | 57.9% of income |
| Property income | CNY 1,845 | 1.1% | 8.0% of income |
| Transfer income | CNY 4,210 | 5.8% | 18.3% of income |
Consumption composition exposes welfare and confidence constraints
The structure of household expenditure provides more information than the aggregate growth rate. During the first half of 2026, food, tobacco and alcohol absorbed 30.6% of per-capita consumption; residence absorbed 21.1%; transport and communications 13.9%; education, culture and recreation 10.6%; healthcare 9.0%; clothing 5.9%; household equipment and services 5.7%; and miscellaneous goods and services 3.2%. Households’ Income and Consumption Expenditure in the First Half of 2026 – National Bureau of Statistics of China – July 2026 — verified official source. Food and residence together consumed 51.7% of reported expenditure, leaving a narrower discretionary envelope for higher-value services and durable goods. Healthcare expenditure rose only 1.2%, but slow recorded growth should not be interpreted automatically as reduced welfare risk: survey expenditure may reflect access, insurance reimbursement, postponed care or price developments rather than full medical security. Total retail sales reached CNY 24.8722 trillion in the first half and increased only 1.3%; retail sales excluding automobiles rose 2.8%, while online sales of goods and services increased 5.2% to CNY 10.0715 trillion. Total Retail Sales of Consumer Goods in the First Half of 2026 – National Bureau of Statistics of China – July 2026 — verified official source. The divergence between online activity and total retail growth indicates channel migration and service digitisation, not necessarily a broad demand boom. Consumption policy must therefore operate through balance-sheet confidence rather than product supply alone. Childcare subsidies, eldercare coverage, unemployment insurance, affordable rental housing and medical protection have higher potential multipliers when they permanently reduce expected future obligations. Supply-side product upgrading remains valuable, but a better appliance or vehicle does not create purchasing power. The five-year consumption constraint will ease only if social transfers, wages and household wealth become sufficiently predictable to change saving behaviour.
| Consumption category | H1 2026 per-capita spending | Share of consumption | Growth | Constraint signal |
|---|---|---|---|---|
| Food, tobacco and liquor | CNY 4,537 | 30.6% | 4.2% | Large essential-spending burden |
| Residence | CNY 3,135 | 21.1% | 1.4% | Housing remains central despite property weakness |
| Transport and communications | CNY 2,065 | 13.9% | 4.7% | Mobility and digital demand remain resilient |
| Education, culture and recreation | CNY 1,572 | 10.6% | 4.9% | Service consumption has expansion potential |
| Healthcare | CNY 1,330 | 9.0% | 1.2% | Welfare exposure remains strategically important |
| Clothing | CNY 880 | 5.9% | 4.4% | Moderate discretionary recovery |
| Household equipment and services | CNY 847 | 5.7% | 5.3% | Potentially influenced by replacement policies |
| Miscellaneous goods and services | CNY 470 | 3.2% | 9.3% | Fast growth from a small base |
Property: the central balance-sheet transmission mechanism
Property remains the most powerful domestic transmission node because it connects households, developers, construction firms, local governments, banks, suppliers and land markets. During the first half of 2026, real-estate development investment fell 18.0%; the floor area of newly built commercial buildings sold declined 11.6% to 401.40 million square metres; and sales value fell 13.6% to CNY 3.7945 trillion. National Economy Operated within an Appropriate Range with New Growth Drivers Developing Rapidly in the First Half Year – National Bureau of Statistics of China – July 2026 — verified official source. Earlier financing data already showed the depth of the funding contraction: from January through April 2026, developer funds fell 18.4%, domestic loans fell 25.9%, deposits and advance payments fell 17.6%, and individual mortgage lending fell 31.7%; new construction starts declined 22.0%, including a 23.6% decline in residential starts. Investment in Real Estate Development from January to April 2026 – National Bureau of Statistics of China – May 2026 — verified official source. These are not merely construction-sector statistics. Falling advance payments weaken developers’ capacity to finish presold housing; doubts about completion weaken buyer confidence; weaker sales reduce developer liquidity; and lower land demand reduces local government-fund revenue. A policy response focused only on cheaper mortgages cannot solve unfinished projects, excessive inventories in weaker cities or insolvent developers. The resolution architecture requires differentiated treatment: complete viable presold housing, restructure non-viable developers, convert suitable inventory to rental or social uses, allow prices and land supply to adjust geographically, and recapitalise affected financial institutions where necessary. Delaying loss recognition may prevent disorderly liquidation but also locks labour, land and credit inside non-productive assets. By 2030, success means a smaller but financeable housing system—not restoration of property as the dominant growth engine.
| Property transmission channel | Current evidence | Immediate consequence | Secondary consequence |
|---|---|---|---|
| Development investment | −18.0%, H1 2026 | Construction and land demand contract | Local revenue and supplier orders weaken |
| Sales floor area | −11.6%, H1 2026 | Inventory absorption slows | Developer cash recovery weakens |
| Sales value | −13.6%, H1 2026 | Price and volume pressure combine | Household confidence remains fragile |
| New starts | −22.0%, Jan–Apr 2026 | Future construction pipeline contracts | Employment and material demand weaken |
| Developer funds | −18.4%, Jan–Apr 2026 | Liquidity available for completion falls | Presale confidence deteriorates |
| Domestic developer loans | −25.9%, Jan–Apr 2026 | Banks reduce direct exposure | Developers depend on state intervention or asset sales |
| Individual mortgages | −31.7%, Jan–Apr 2026 | Household housing demand remains weak | Transaction recovery is delayed |
| Deposits and advance receipts | −17.6%, Jan–Apr 2026 | Presale model loses financing capacity | Completion risk becomes a public-policy issue |
Local liabilities: debt substitution is not debt resolution
China’s officially recorded local-government debt reached approximately CNY 54.823 trillion at the end of 2025, comprising CNY 17.512 trillion in general debt and CNY 37.311 trillion in special debt. The average remaining maturity of local-government bonds was 10.5 years, and the average interest rate was 2.83%; local governments paid approximately CNY 1.4843 trillion in bond interest during 2025. Local Government Bond Issuance and Debt Balance, December 2025 – Ministry of Finance of the People’s Republic of China – January 2026 — verified Chinese-language source. Official debt does not capture every economically public liability because LGFVs, arrears, guarantees, public-private structures and local SOE obligations may involve varying degrees of implicit support. The government’s 2024 restructuring package authorised CNY 6 trillion of additional local debt limits over 2024–2026 and identified CNY 14.3 trillion of hidden local liabilities at the end of 2023. Policy Briefing on Increasing Local-Government Debt Limits to Replace Existing Hidden Debt – Ministry of Finance of the People’s Republic of China – November 2024 — verified Chinese-language source. The IMF records a broader CNY 10 trillion swap framework and reports that about CNY 4 trillion of the relevant quota had been issued by September 2025, reducing average interest costs by more than 2.5 percentage points for the converted obligations. People’s Republic of China: 2025 Article IV Consultation – International Monetary Fund – February 2026 — verified institutional report. Swaps improve liquidity by replacing shorter, costlier and less transparent obligations with longer, cheaper official bonds. They do not improve the operating economics of the financed assets. Genuine resolution requires project cash flow, asset disposal, central assumption of appropriate functions, creditor loss-sharing or explicit fiscal transfers.
| Local-liability metric | Verified value | What it demonstrates | What it does not demonstrate |
|---|---|---|---|
| Official local debt, end-2025 | CNY 54.823tn | Large recognised subnational liability stock | Full augmented public exposure |
| General local debt | CNY 17.512tn | Ordinary public-service financing burden | Project-specific repayment capacity |
| Special local debt | CNY 37.311tn | Heavy reliance on project-linked bonds | That every project generates adequate revenue |
| Average remaining maturity | 10.5 years | Refinancing pressure is spread over time | Long-term solvency |
| Average interest rate | 2.83% | Funding costs are administratively manageable | Economic return on underlying assets |
| 2025 interest payment | CNY 1.4843tn | Material recurrent fiscal burden | Costs on all hidden or quasi-public liabilities |
| Hidden debt identified at end-2023 | CNY 14.3tn | Official recognition of off-budget exposure | Complete LGFV and contingent-liability perimeter |
| Additional swap limit | CNY 6tn | Capacity to replace hidden obligations | Extinguishment of the underlying economic debt |
The local fiscal-property loop
Local-government stress is inseparable from property because land-use-right revenue historically financed infrastructure, urban development and debt service. The Ministry of Finance reported that national government-fund revenue fell 7% in 2025, principally because local revenue from the transfer of state-owned land-use rights declined. Report on the Execution of the 2025 Central and Local Budgets and the Draft 2026 Budgets – Ministry of Finance of the People’s Republic of China – March 2026 — verified Chinese-language source. This matters because the government-fund budget is a major channel for land transactions, special bonds and infrastructure-related activity. When land sales weaken, a local authority can respond by cutting expenditure, selling other assets, increasing non-tax collections, requesting transfers, issuing authorised bonds, using local SOEs or refinancing existing obligations. Each response has different economic consequences. Expenditure cuts reduce local demand and services; asset sales are finite; aggressive non-tax collection damages the business environment; transfers shift the burden to the centre; additional bonds raise future debt service; and local SOE financing can obscure the public nature of liabilities. In the first five months of 2026, local governments issued CNY 4.7219 trillion in bonds, of which CNY 1.8347 trillion represented new debt and CNY 2.8872 trillion refinancing bonds. Local Government Bond Market Report, May 2026 – Ministry of Finance Government Debt Research and Evaluation Center – July 2026 — verified Chinese-language source. Refinancing exceeded new financing by approximately CNY 1.0525 trillion, illustrating the importance of liability management within gross issuance. This does not prove insolvency; refinancing is normal in sovereign and municipal finance. It does demonstrate that gross bond issuance substantially overstates the quantity of incremental resources reaching new projects. The 2030 resolution depends on reassigning certain expenditure responsibilities, creating more stable local revenue sources, imposing transparent project accounting and separating public-service assets from commercially repayable infrastructure.
Demography: a simultaneous labour, pension and consumption shock
China’s demographic transition constrains the 15th Five-Year Plan through labour supply, household formation, pension expenditure, healthcare demand, housing absorption and regional population redistribution. At the end of 2025, the national population was approximately 1.405 billion. China recorded 7.92 million births and 11.31 million deaths, producing natural population growth of −2.41 per thousand. The population aged 60 and over approached 323 million, while the working-age population aged 15–59 was approximately 868 million. Statistical Communiqué on the 2025 National Economic and Social Development – National Bureau of Statistics of China – February 2026 — verified official source. Demographic decline does not mechanically cause immediate economic contraction: labour quality, automation, urbanisation, retirement policy and female participation can offset part of the numerical decline. It nevertheless changes the investment frontier. Fewer births reduce future demand for family housing, schools and child-related services in many localities; ageing increases demand for healthcare, pensions, assisted living and accessible infrastructure; regional migration concentrates viable demand in productive metropolitan areas while leaving weaker cities with excess housing and infrastructure. China began gradually raising statutory retirement ages in 2025: the male retirement age is scheduled to rise from 60 to 63 over fifteen years, with corresponding staged increases for women. China Implements Gradual Retirement-Age Increase – State Council Information Office – January 2025 — verified official source. Retirement reform slows labour-force contraction and pension outflows but cannot reverse low fertility quickly because fertility decisions reflect housing, education, childcare, employment and gendered care burdens. Through 2030, demographics will operate primarily as a distributional constraint: a smaller share of workers must support more retirees while local governments finance differently ageing populations with unequal fiscal resources.
| Demographic indicator | 2025 official value | Economic channel | Five-year implication |
|---|---|---|---|
| Total population | Approximately 1.405bn | Market size and labour supply | Aggregate size remains enormous but is declining |
| Births | 7.92m | Future labour force and household formation | Lower long-term housing and education demand |
| Deaths | 11.31m | Natural population change | Population contraction becomes structural |
| Natural growth rate | −2.41‰ | Population momentum | Reversal requires more than short-term subsidies |
| Population aged 60+ | Nearly 323m | Pensions, health and care demand | Social expenditure rises |
| Population aged 15–59 | Approximately 868m | Core labour pool | Automation and participation become more important |
| Male retirement-age path | 60 → 63 over 15 years | Labour supply and pension timing | Partial mitigation, not demographic reversal |
Productivity: output growth does not equal efficiency growth
Productivity is the variable capable of reconciling demographic decline, debt stabilisation and income growth, but it is also the least directly controllable by administrative order. Industrial data for January–May 2026 initially appear strong: profits of industrial enterprises above the designated size reached CNY 3.144 trillion, increasing 18.8%; manufacturing profits increased 20.0%; state-holding enterprise profits rose 19.6%; and private-enterprise profits rose 10.7%. Yet the internal balance-sheet indicators require caution. Industrial assets reached CNY 193.55 trillion, liabilities reached CNY 112.69 trillion, and the aggregate asset-liability ratio increased to 58.2%. Accounts receivable rose 7.7% to CNY 28.17 trillion, finished-goods inventories rose 8.8% to CNY 7.14 trillion, inventory turnover lengthened to 21.6 days, and the average collection period for receivables rose to 72.6 days. Revenue generated per CNY 100 of assets fell slightly to CNY 71.1. Profits of Industrial Enterprises above the Designated Size from January to May in 2026 – National Bureau of Statistics of China – June 2026 — verified official source. Profit growth therefore coexists with slower asset turnover, longer payment cycles and inventory accumulation. Sectoral dispersion is extreme: computer and communications-equipment profits rose 103.9%, while automobile profits fell 19.8%, electrical-machinery profits fell 13.7%, ferrous-metal profits fell 37.4%, and non-metallic mineral-product profits fell 48.9%. Productivity policy must consequently distinguish technological frontier gains from economy-wide resource allocation. Robotics, AI and digitalisation can raise factory efficiency, but aggregate productivity will remain weak if capital remains trapped in low-return property, protected local enterprises or duplicate capacity. The decisive metric is not automation expenditure; it is additional value added generated per unit of labour, capital, energy and credit.
| Industrial indicator, Jan–May 2026 | Value or change | Positive interpretation | Constraint interpretation |
|---|---|---|---|
| Total industrial profit | CNY 3.144tn; +18.8% | Profit recovery strengthens internal financing | Growth is sectorally concentrated |
| Manufacturing profit | +20.0% | Industrial upgrading may be gaining traction | Aggregate result conceals severe sector losses |
| Private-enterprise profit | +10.7% | Private production remains viable | Slower than state-holding profit growth |
| Assets | CNY 193.55tn; +5.8% | Industrial capital base is expanding | Larger asset base requires higher returns |
| Liabilities | CNY 112.69tn; +6.5% | Credit remains available | Liabilities outpace assets |
| Accounts receivable | CNY 28.17tn; +7.7% | Higher nominal business volume | Payment chains are lengthening |
| Finished-goods inventory | CNY 7.14tn; +8.8% | Firms hold capacity for future demand | Possible overproduction or weak sales |
| Average collection period | 72.6 days; +1.3 days | — | Working-capital pressure |
| Revenue per CNY 100 of assets | CNY 71.1; −0.1 | Broadly stable | No clear asset-efficiency improvement |
External demand as an escape valve—and a vulnerability
Exports can temporarily compensate for weak domestic absorption, but they cannot permanently resolve the underlying balance-sheet system. During the first half of 2026, China’s merchandise exports reached CNY 14.7314 trillion, increasing 13.4%, while imports reached CNY 10.7372 trillion, increasing 22.1%. National Economy Operated within an Appropriate Range with New Growth Drivers Developing Rapidly in the First Half Year – National Bureau of Statistics of China – July 2026 — verified official source. Export demand supports factory utilisation, employment and corporate cash flow, but a larger external surplus also transmits China’s domestic imbalance to trading partners. The European Union imported EUR 559.4 billion of goods from China in 2025 and exported EUR 199.6 billion, producing an EU goods deficit of EUR 359.8 billion. Trade in Goods with China in 2025 – Eurostat – April 2026 — verified EU source. Russia offers a different outlet through energy, commodity and bilateral-settlement linkages, but the Bank of Russia recorded a decline in its current-account surplus to USD 12.7 billion in the first quarter of 2026, reflecting a smaller trade surplus and larger services deficit. Balance of Payments, International Investment Position and External Debt, First Quarter 2026 – Bank of Russia – June 2026 — verified Russian-language official source. This multilingual cross-check illustrates that alternative trade networks remain exposed to their own macroeconomic and financial constraints. China can diversify export destinations, localise manufacturing abroad and expand renminbi settlement, but external markets cannot absorb unlimited industrial capacity without political response. If Europe tightens trade-defence instruments while other markets weaken, overcapacity returns to the domestic system through falling prices, profits and employment. Stronger consumption is therefore not merely a welfare preference; it is strategic insurance against external market closure.
Competing hypotheses and Bayesian update
Five hypotheses organise the 2026–2030 domestic outlook. H₁, managed balance-sheet repair, assumes Beijing completes presold housing, restructures weaker developers, refinances local liabilities, protects major banks and gradually redirects fiscal resources toward households; it produces controlled deceleration without a systemic crisis. H₂, technology-led offset, assumes advanced manufacturing, AI, robotics and exports generate sufficient income to compensate for property and demographic weakness, but consumption rebalancing remains incomplete. H₃, consumption-centred rebalancing, requires materially stronger pensions, healthcare, unemployment protection, childcare support, hukou-related service portability and household income growth; it delivers the healthiest long-term outcome but demands politically and fiscally difficult redistribution. H₄, debt-deflationary drift, assumes weak property, falling land revenue, refinancing and subdued demand reinforce one another without an acute collapse. H₅, compound domestic rupture, combines deeper property losses, LGFV financing stress, regional-bank problems, private-investment contraction and external-demand weakening. Evidence through July 2026 raises H₁ because income, industrial profits and fiscal revenue remain positive, but it also raises H₄ because private investment, property investment, property sales and broad fixed investment remain weak. H₂ retains high probability because high-technology investment and selected industrial profits are expanding rapidly. H₃ remains a policy possibility rather than the central observed trajectory because real consumption growth still trails real disposable-income growth. H₅ remains a tail scenario because the central government retains considerable fiscal, banking and administrative capacity to suppress disorderly adjustment. The Bayesian result assigns 38% to H₁, 27% to H₂, 12% to H₃, 18% to H₄ and 5% to H₅.
| Hypothesis | Prior | Evidence update | Posterior | Decisive confirming indicator |
|---|---|---|---|---|
| H₁ Managed balance-sheet repair | 36% | Fiscal capacity and profit recovery offset weak property | 38% | Completed housing, stabilised sales and falling local arrears |
| H₂ Technology-led offset | 25% | Strategic investment remains substantially stronger | 27% | High-tech productivity and private follow-on capital |
| H₃ Consumption-centred rebalancing | 15% | Income grows, but expenditure conversion remains weak | 12% | Consumption persistently outgrows disposable income |
| H₄ Debt-deflationary drift | 18% | Private FAI, property and refinancing pressures remain adverse | 18% | Continued weak demand and rising refinancing dependence |
| H₅ Compound domestic rupture | 6% | No evidence yet of uncontrolled systemic transmission | 5% | Simultaneous bank, property and local-fiscal stress |
Monte Carlo five-year constraint outlook
The domestic-constraint model uses 25,000 synthetic annual paths from 2026 through 2030 and six correlated state variables: property adjustment, household-demand conversion, private investment, productivity, demographic burden and augmented local-liability stress. Property weakness is assigned positive correlation with local fiscal stress and negative correlation with consumption confidence; productivity is positively correlated with private investment and technical upgrading; debt swaps reduce near-term liquidity stress but do not directly improve solvency; stronger social transfers improve household demand with a lag; and external-demand shocks feed into industrial profits and employment. The model is analytical rather than official. In the central case, the composite domestic-constraint index declines only modestly from 71 in 2026 to 61 in 2030, where a higher value represents greater constraint. Property stress falls from 84 to 63 as construction and developer exposure contract, but demographic pressure rises from 58 to 70 and local-liability stress remains above 65 throughout the period. Consumption weakness improves from 69 to 55, conditional on continued real-income growth and expanded social support. Productivity weakness improves from 62 to 51, but only if high-technology gains diffuse beyond strategic clusters. Across all paths, the probability that the constraint index remains above 60 in 2030 is approximately 54%; the probability of meaningful rebalancing below 50 is 21%; and the probability of severe deterioration above 75 is 9%. The remaining paths occupy an intermediate zone. Sensitivity analysis identifies private-investment recovery as the strongest positive variable because it simultaneously improves employment, confidence, innovation and the validation of state-supported projects. The strongest negative compound consists of renewed property contraction, lower land revenue and regional-bank asset deterioration.
| Constraint component | 2026 index | 2030 base case | Direction | Principal policy lever |
|---|---|---|---|---|
| Property adjustment | 84 | 63 | Improving but still severe | Completion, restructuring and inventory conversion |
| Household-demand weakness | 69 | 55 | Gradual improvement | Social insurance and disposable-income security |
| Private-investment weakness | 76 | 58 | Conditional improvement | Predictability, market access and payment discipline |
| Productivity constraint | 62 | 51 | Moderate improvement | Capital exit, competition and technology diffusion |
| Demographic burden | 58 | 70 | Deteriorating | Retirement, participation, childcare and automation |
| Local-liability stress | 79 | 66 | Slow improvement | Restructuring, revenue reform and fiscal reassignment |
| Composite constraint | 71 | 61 | Incomplete resolution | Coordinated balance-sheet repair |
The 2030 judgement and warning architecture
China can prevent an uncontrolled domestic balance-sheet crisis more easily than it can restore the former investment model, because the state can refinance liabilities, direct banks, transfer fiscal resources, merge public entities and control the pace of loss recognition. Those instruments reduce tail risk but do not guarantee efficient capital allocation. The 2030 base case is therefore a smaller property contribution, heavier central fiscal involvement, persistent local-debt management, selective industrial leadership, slower population growth and only partial consumption rebalancing. A favourable update would require several signals to occur together: private investment excluding property returns to sustained positive growth; consumption expenditure grows faster than disposable income without excessive household borrowing; newly built housing sales stabilise; developer funding and mortgage activity stop contracting; local refinancing falls relative to new productive borrowing; industrial receivables and inventory grow more slowly than revenue; and productivity gains appear across conventional industries rather than only strategic sectors. An adverse update would be triggered by another substantial fall in housing sales, accelerated local asset disposals, widening payment arrears, repeated bank recapitalisation, rising youth unemployment, falling wage-income growth or a decline in export demand. The critical policy sequence is also clear. Property losses must be recognised and allocated before confidence fully recovers; local liabilities must be restructured before fiscal resources can be redirected; social protection must become more portable and predictable before households lower precautionary saving; and unproductive firms must be allowed to exit before technology investment produces economy-wide productivity. Attempting to expand consumption, preserve every property claim, maintain every local project and finance every strategic industry simultaneously would maximise claims on the same fiscal resources. China’s constraint is therefore not a shortage of administrative capacity. It is the political economy of choosing which balance sheets receive protection and which absorb losses.
China Domestic Constraint Projection, 2026–2030
The External Strategic Envelope: China’s Export Dependence, Technology Access, European Exposure, Energy Security and Geopolitical Fragmentation, 2026–2030
The external envelope is a network of asymmetric interdependence
China’s external strategic envelope is not defined by a binary choice between global integration and autarky. It consists of overlapping dependencies whose direction, substitutability and coercive value differ substantially. China depends on foreign markets to absorb industrial output, on imported energy and commodities to sustain production, on selected foreign technologies and manufacturing tools to reach the technological frontier, on maritime corridors to move goods and fuels, and on international financial infrastructure to settle trade and manage reserves. Simultaneously, foreign economies depend on Chinese manufactured goods, intermediate inputs, processing capacity, batteries, solar products, machinery and critical minerals. This produces asymmetric interdependence: both sides incur costs from separation, but the distribution, timing and political visibility of those costs differ. A restriction on an advanced semiconductor tool may impose a concentrated, delayed constraint on Chinese technological capability; a restriction on processed rare earths can impose a faster operational constraint on foreign manufacturers; tariffs may reduce Chinese export margins gradually; disruption of a maritime energy route can affect physical production rapidly. Beijing’s 2026–2030 strategy must therefore perform five functions at once: preserve access to final markets, replace or route around constrained technologies, diversify energy and raw-material supply, increase control over payment and logistics channels, and retain enough leverage to deter foreign coercion. These objectives are not always compatible. Export competitiveness can require continued access to foreign technology; aggressive export controls can encourage foreign substitution; greater coal reliance can improve short-term energy security while increasing environmental and trade-policy exposure; overseas localisation can protect market access while transferring production and technology outside China. The external envelope should consequently be measured through a dependency matrix rather than a single “decoupling” index.
Integrated Trade Flows & Regulatory Axis
FINAL MARKETS
- US Axis: Primary high-value demand vector.
- EU Axis: Standardized, compliant market block.
- ASEAN Axis: Rapid growth integration point.
- Global South Axis: Developing resource & labor inputs.
Chinese Industrial Output
- Massive manufacturing base.
- Driven by domestic investment & global integration.
- Highly dependent on external input vectors.
Imported technology
chips / tools / EDA
- Critical advanced input.
- Subject to export control blockades.
- Key innovation catalyst.
Imported energy
oil / gas / coal
- Core operational fuel.
- Subject to price volatility & chokepoint risk.
- Massive strategic dependency.
Imported materials
ores / food / inputs
- Fundamental manufacturing input.
- Vulnerable to supply chain disruptions.
- Integrated Global South dependencies.
Maritime and financial channels
ports / chokepoints / insurance / FX
- Operational transmission network.
- Subject to strategic maritime chokepoints.
- Vulnerable to financial clearing & FX controls.
Export controls · sanctions · tariffs · subsidies reviews
- The final systemic feedback loop.
- Defines the regulatory architecture of trade.
- Enforces political and technological blockades.
Export dependence: macroeconomic stabiliser and strategic exposure
China’s 2025 merchandise trade reached approximately USD 6.3548 trillion, consisting of exports of USD 3.7719 trillion and imports of USD 2.5829 trillion. The resulting goods surplus was approximately USD 1.1890 trillion. China’s Total Export and Import Values, December 2025 – General Administration of Customs of the People’s Republic of China – January 2026 — verified official customs source. The scale of the surplus is strategically double-edged. It supports factory utilisation, employment, corporate liquidity, foreign-exchange earnings and economies of scale at a time when domestic property investment and household demand remain weak. It also makes the external market an essential component of China’s internal macroeconomic equilibrium. In the first half of 2026, exports reached CNY 14.7314 trillion, increasing 13.4%, while imports reached CNY 10.7372 trillion, increasing 22.1%; total goods trade rose 16.9% to CNY 25.4686 trillion. National Economy Operated within an Appropriate Range with New Growth Drivers Developing Rapidly in the First Half Year – National Bureau of Statistics of China – July 2026 — verified official source. Strong import growth indicates that China remains deeply integrated into foreign energy, commodity, intermediate-input and equipment markets rather than operating as a self-contained production system. The export dependency is not simply the ratio of exports to GDP. The more relevant intelligence variables are the number of domestic jobs linked to external demand, the share of corporate profit generated abroad, the concentration of export destinations, the substitutability of affected products, the foreign value added embedded in exports and the extent to which low margins depend on scale. A tariff on a highly commoditised product can destroy margins without eliminating volume; a technology restriction can reduce the quality frontier; a procurement exclusion can close a strategically valuable market even when aggregate exports continue rising.
| 2025 merchandise-trade indicator | Official value | Strategic function | Principal vulnerability |
|---|---|---|---|
| Total trade | USD 6.3548tn | Supply-chain integration and economic scale | Broad exposure to geopolitical and demand shocks |
| Exports | USD 3.7719tn | Employment, utilisation and foreign-exchange earnings | Market-access restrictions and external demand |
| Imports | USD 2.5829tn | Energy, commodities, equipment and intermediate inputs | Chokepoints, sanctions and technology controls |
| Goods surplus | USD 1.1890tn | Macro stabilisation and reserve accumulation | Political response from deficit economies |
| H1 2026 exports | CNY 14.7314tn; +13.4% | Offsets weak domestic absorption | Deepens reliance on foreign market capacity |
| H1 2026 imports | CNY 10.7372tn; +22.1% | Indicates strong input and resource demand | Confirms continuing external dependence |
Export structure matters more than gross volume
The strategic quality of exports depends on whether China controls technology, design, standards, brands, critical components and after-sales services, or merely performs a lower-margin production stage. China’s industrial upgrading has reduced the explanatory value of traditional labels such as “assembly economy,” but foreign dependence remains uneven across value chains. In electric vehicles, batteries, solar equipment, consumer electronics, telecommunications equipment, industrial machinery and rail systems, China possesses large production ecosystems and extensive domestic supplier networks. In frontier semiconductors, high-bandwidth memory, electronic-design automation, specialised metrology, advanced lithography, certain scientific instruments and aerospace inputs, foreign tools or intellectual property remain more difficult to replace. Gross export value can therefore rise even while access to a small number of enabling technologies becomes more restrictive. This creates a bottleneck asymmetry: the economic value of the constrained input may be small relative to total trade, but its absence can obstruct a much larger downstream system. Export strength also has a geographic dimension. Sales to large developed markets provide purchasing power, demanding quality standards and opportunities for high-margin services; emerging markets provide volume growth but may have lower purchasing power, higher political or currency risk and greater dependence on Chinese credit. Reorientation toward Belt and Road partners can reduce exposure to any single Western jurisdiction, yet it cannot automatically reproduce the technological, financial and consumer characteristics of the European Union, United States, Japan and other advanced markets. The five-year export strategy is therefore likely to combine four layers: continued direct exports where access remains open; overseas manufacturing intended to satisfy local-content and tariff rules; third-country supply-chain routing; and stronger domestic absorption. Each layer reduces one vulnerability while creating another, including capital-export risk, compliance complexity, local political exposure and technology diffusion to overseas partners.
| Export-position category | Chinese strength | Residual external dependency | Main 2026–2030 contest |
|---|---|---|---|
| Solar modules and components | Scale, supplier density and cost | Foreign market access and grid demand | Anti-subsidy action and local-manufacturing rules |
| Batteries | Cell manufacturing, refining and scale | Selected raw materials, overseas approvals and standards | Overseas localisation and critical-mineral rules |
| Electric vehicles | Integrated supply chain and rapid model cycles | Premium-market access, chips and certification | Tariffs, subsidies investigations and local production |
| Telecommunications equipment | System integration and manufacturing | Advanced chips and foreign procurement acceptance | Security restrictions and standards competition |
| Industrial machinery | Broadening domestic capability | High-end controls, metrology and specialised software | Movement from volume to frontier precision |
| Semiconductors | Mature-node scale and state investment | Frontier lithography, HBM, EDA and advanced tools | Yield, reliability and equipment substitution |
| Digital services and AI | Large data and application market | Frontier compute and overseas regulatory access | Compute controls, model governance and cyber rules |
Technology access: the bottleneck map
United States export controls target the narrow set of capabilities most likely to determine the frontier of advanced computing and semiconductor production. In December 2024, the Bureau of Industry and Security introduced controls covering 24 types of semiconductor-manufacturing equipment, three categories of semiconductor-development or production software, high-bandwidth memory, and numerous entities involved in Chinese semiconductor and military-modernisation programmes. The covered equipment included specified etching, deposition, lithography, ion implantation, annealing, metrology, inspection and cleaning tools. Commerce Strengthens Export Controls to Restrict China’s Capability to Produce Advanced Semiconductors for Military Applications – U.S. Department of Commerce, Bureau of Industry and Security – December 2024 — verified official source. In August 2025, BIS removed a licensing privilege that had allowed selected foreign-owned semiconductor facilities in China to receive specified US-origin equipment and technology without individual licences; the agency stated that licences could support the operation of existing facilities but were not intended to enable capacity expansion or technology upgrades. Department of Commerce Closes Export-Control Loophole for Foreign-Owned Semiconductor Fabs in China – U.S. Department of Commerce, Bureau of Industry and Security – August 2025 — verified official source. In January 2026, however, BIS shifted specified advanced AI accelerators, including the Nvidia H200 and AMD MI325X, to case-by-case licence review subject to security conditions. Department of Commerce Revises Licence Review Policy for Semiconductors Exported to China – U.S. Department of Commerce, Bureau of Industry and Security – January 2026 — verified official source. This combination shows that technology access is not a one-directional progression toward total embargo. It is a dynamic licensing regime balancing security denial, commercial incentives, allied coordination, enforcement capacity and concern that excessive restriction could accelerate Chinese substitution.
| Technology layer | External constraint mechanism | Substitution difficulty | Strategic effect if constrained |
|---|---|---|---|
| Frontier AI accelerators | Product and end-user licensing | High | Slower training of frontier-scale models |
| High-bandwidth memory | Direct export controls | High | Limits accelerator and data-centre performance |
| Advanced lithography | Equipment controls and allied coordination | Very high | Constrains leading-edge process scaling |
| Etch and deposition | Tool controls | Medium to high | Reduces process yield and manufacturing precision |
| Metrology and inspection | Equipment and software controls | High | Limits defect detection and yield improvement |
| EDA software | Software controls and entity restrictions | High | Slows advanced chip design and verification |
| Mature-node equipment | Narrower control perimeter | Medium | Domestic capacity can continue expanding |
| Scientific instrumentation | Licensing and end-use scrutiny | Sector-dependent | Slows research reproducibility and frontier discovery |
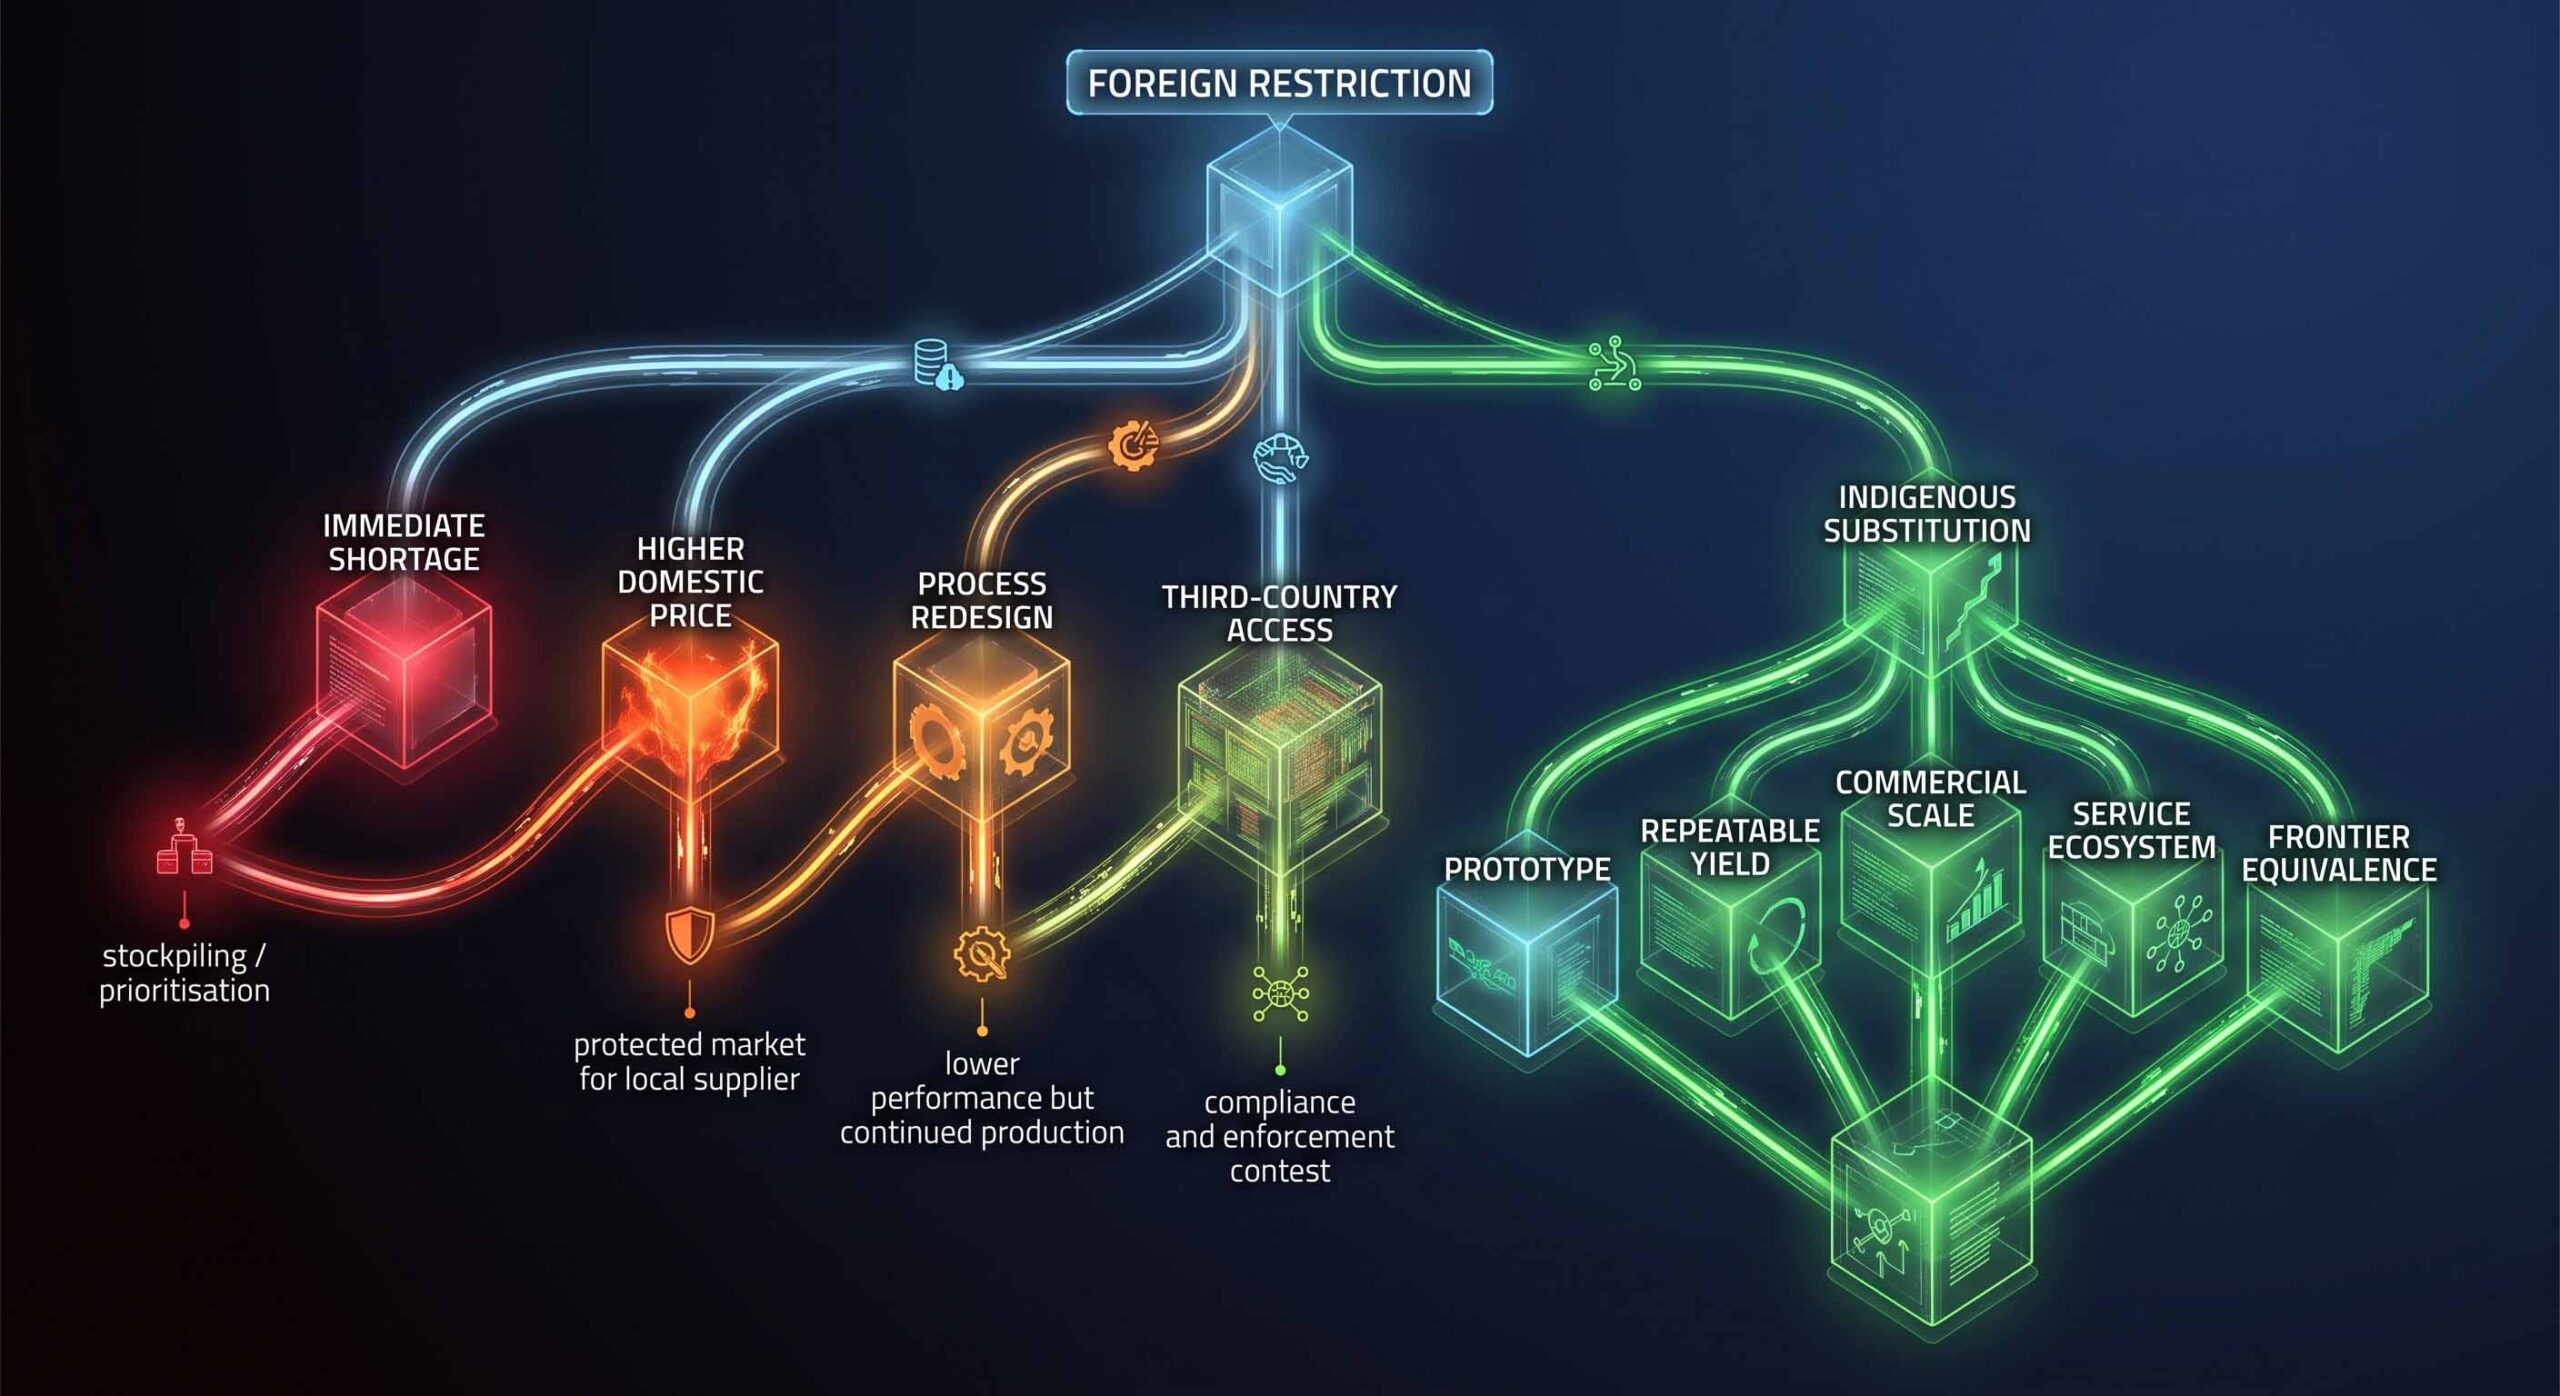
The substitution race: access, replication and indigenous capability are different
China can respond to technology controls through stockpiling, domestic replication, process redesign, lower-compute algorithms, distributed computing, acquisition through permitted channels, third-country procurement, talent recruitment and concentration of scarce tools in priority facilities. These responses should not be conflated. Access means obtaining a foreign item; replication means producing a functional domestic analogue; scale means manufacturing it reliably in sufficient volume; frontier equivalence means matching the most advanced foreign performance; and ecosystem independence means maintaining the tool, software, materials, training and supplier network without external support. China may achieve the first three in a segment while remaining below frontier equivalence, or achieve frontier performance in a demonstration environment without economical scale. Restrictions can also have contradictory effects. They raise costs and delay deployment, but they create protected demand and a guaranteed market for domestic suppliers that would otherwise struggle against established global firms. Excessively broad controls may encourage foreign customers to avoid US-origin components, reducing long-term American standards power; overly narrow controls may allow Chinese entities to aggregate sufficient capability for frontier development. The 2026–2030 outcome will be determined by yields, reliability, installed-base maintenance and design-tool interoperability rather than by isolated announcements. The most probative indicators are domestic tool penetration in commercially operating fabs, defect density, wafer throughput, chip energy efficiency, advanced-packaging performance, availability of HBM alternatives, and the proportion of AI workloads completed using domestic hardware and software stacks. Patent totals, laboratory prototypes and nominal domestic-content ratios are insufficient. The external envelope is breached only when China can replace the full operational function of a constrained technology at acceptable cost, quality and scale.
Foreign Restriction
Immediate shortage
stockpiling / prioritisation
Higher domestic price
protected market for local supplier
Process redesign
lower performance but continued production
Third-country access
compliance and enforcement contest
Indigenous substitution
Prototype
Repeatable yield
Commercial scale
Service ecosystem
Frontier equivalence
China’s reciprocal leverage through critical materials
China’s export-control architecture converts its position in critical-material processing into a strategic instrument, although legal controls do not necessarily constitute a complete export ban. In April 2025, the Ministry of Commerce and the General Administration of Customs introduced export controls on specified medium and heavy rare-earth-related items, including samarium-related metals, alloys, targets and other listed products, citing national security, non-proliferation and international obligations. Announcement No. 18 of 2025 on Export Controls for Certain Medium and Heavy Rare-Earth-Related Items – Ministry of Commerce and General Administration of Customs of the People’s Republic of China – April 2025 — verified official source. Beijing subsequently stated that compliant civilian applications could receive licences and emphasised that the measures were controls rather than categorical prohibitions. MOFCOM Spokesperson’s Remarks on China’s Export Controls on Rare Earths – Ministry of Commerce of the People’s Republic of China – October 2025 — verified official source. The strategic leverage lies in processing concentration, qualification time and the dependence of downstream systems on relatively small quantities of specialised material. It is reduced by inventory accumulation, recycling, alternative chemistries, new mines, substitute processors and political acceleration of non-Chinese supply. Frequent coercive use would increase the economic incentive for diversification and could destroy part of China’s long-term market power. Selective licensing, procedural delay and end-use discrimination may preserve leverage longer because they impose uncertainty without necessarily forcing every customer to exit. The resulting contest mirrors the semiconductor domain: the United States and partners control selected frontier technologies, while China controls or influences important material and processing nodes. Neither side possesses cost-free dominance.
| Chinese-controlled or influenced node | Foreign dependency signal | Chinese leverage | Leverage-decay mechanism |
|---|---|---|---|
| Magnesium | EU sourced 92% from China in 2025 | High near-term processing leverage | Alternative smelting, recycling and inventories |
| Gallium | EU sourced 77% from China in 2025 | High for semiconductor and specialised uses | New refining and recovery projects |
| Ferro-tungsten | China supplied 68% of EU import value in 2025 | Material for high-performance steels and tools | Vietnam, Kazakhstan and new processing capacity |
| Medium and heavy rare earths | Licence-controlled categories | Strong in magnets, defence and advanced industry | Alternative mines, separation plants and substitutes |
| Battery-chain materials | Large processing and manufacturing position | Scale and cost leverage | Local-content rules and overseas Chinese plants |
| Graphite-related chains | Strong processing concentration | Battery-anode exposure | Synthetic graphite and non-Chinese refining |
European exposure: market, technology, capital and regulation
Europe is neither merely a customer nor merely a regulatory adversary. It is simultaneously a high-income final market, a source of machinery and specialised technology, an investment destination, a supplier of vehicles, chemicals and industrial equipment, and an increasingly active economic-security jurisdiction. In 2025, the European Union exported EUR 199.6 billion in goods to China and imported EUR 559.4 billion, creating an EU goods deficit of EUR 359.8 billion. China supplied 22.3% of all extra-EU goods imports. Trade in Goods with China in 2025 – Eurostat – April 2026 — verified official EU source. Manufactured goods constituted 86.2% of EU exports to China; machinery and vehicles accounted for 50% of EU goods exports, other manufactured goods 20%, and chemicals 16.2%. The EU retained a EUR 21.3 billion services surplus with China in 2025. EU investment stock in China stood at EUR 239.3 billion in 2024, while Chinese investment stock in the EU stood at EUR 79.8 billion. EU Trade Relations with China – European Commission, Directorate-General for Trade and Economic Security – 2026 update — verified official EU source. These flows create constituencies against abrupt separation, but the imbalance and concentration of Chinese supply create constituencies for intervention. Europe’s exposure is sector-specific: low-cost Chinese products can support decarbonisation and consumer purchasing power while challenging European industrial capacity. European policy must therefore reconcile affordability, climate targets, industrial sovereignty and rules against distortive subsidies. For China, preserving European access will increasingly require production localisation, subsidy transparency, data compliance, local employment and acceptance of European regulatory jurisdiction.
The EU toolkit changes the risk from tariffs to institutional scrutiny
The European challenge to China is becoming broader than conventional border tariffs. The Foreign Subsidies Regulation, applicable since July 2023, allows the European Commission to investigate distortions in the Single Market arising from financial contributions granted by non-EU governments. Foreign Subsidies Regulation – European Commission, Directorate-General for Competition – July 2023 — verified official EU source. The Commission has also asked EU member states to review outbound investments involving semiconductors, artificial intelligence and quantum technologies because of their potential implications for economic security. Investment Screening and Outbound-Investment Review – European Commission, Directorate-General for Trade and Economic Security – January 2026 — verified official EU source. Eurostat data further show extreme EU dependence on China for magnesium, gallium and ferro-tungsten, exposing the reciprocal nature of the relationship. International Trade in Critical Raw Materials – Eurostat – 2026 update covering 2025 — verified official EU source. The resulting risk is institutional rather than episodic. A Chinese enterprise entering Europe may face subsidy review, procurement scrutiny, foreign-investment screening, cybersecurity requirements, sustainability rules, data regulation and sector-specific trade defence. Overseas manufacturing does not automatically eliminate these risks because regulators can examine ownership, upstream subsidies, technology transfer and supply concentration. China’s response will probably include joint ventures, European production, local suppliers, corporate restructuring and greater documentation of financing. Those adaptations can preserve access but reduce the net value captured inside China and increase foreign visibility into corporate support structures. The strategic European exposure must therefore be calculated as expected market value after tariff, compliance, localisation and political-risk costs—not gross sales.
| EU exposure layer | Chinese opportunity | European policy instrument | Chinese adaptation |
|---|---|---|---|
| Goods market | High-income demand and scale | Anti-dumping and countervailing measures | Pricing changes and product relocation |
| Public procurement | Infrastructure and equipment contracts | International procurement and subsidy scrutiny | Local partnerships and financing disclosure |
| Green transition | Demand for batteries, solar and EVs | Local-content, sustainability and resilience rules | EU-based production and supply diversification |
| Technology access | Machinery, chemicals and specialised equipment | Export and outbound-investment review | Indigenous substitution or third-country sourcing |
| Investment | Automotive, energy and technology projects | FDI screening and Foreign Subsidies Regulation | Greenfield investment with local governance |
| Critical materials | Chinese processing leverage | Strategic stockpiles and Critical Raw Materials policy | Licensing discipline and overseas processing |
Energy security: electrification does not eliminate external dependence
China’s energy strategy combines rapid clean-energy deployment with continued fossil-fuel capacity and import diversification. The apparent contradiction is functional: renewable generation, nuclear power, storage and electrification reduce exposure to imported fuels over time, while coal provides dispatchable domestic backup and protects against short-term oil and gas disruptions. The International Energy Agency estimates Chinese clean-energy investment exceeded USD 625 billion in 2024 and reports that China achieved its official 2030 wind-and-solar capacity target six years early. China – World Energy Investment 2025 – International Energy Agency – June 2025 — verified intergovernmental source. By March 2026, installed renewable capacity reached 2.395 billion kilowatts, representing 60.4% of total installed generating capacity. China Renewable-Energy Capacity Update – National Energy Administration Belt and Road Energy Partnership – 2026 — verified official source. Installed capacity, however, is not equivalent to dependable generation. Wind and solar variability require grids, storage, demand response, interprovincial transmission and flexible backup. Curtailment or grid congestion can reduce the security value of nominal capacity. Transport, aviation, petrochemicals and parts of heavy industry remain exposed to oil and gas. Coal improves physical sovereignty because China possesses substantial domestic production, but it creates environmental, water, mine-safety and carbon-policy costs. Energy security must therefore be divided into adequacy, affordability, flexibility, import exposure and route concentration. A system may have abundant annual energy yet remain vulnerable to peak demand, regional grid congestion or interruption of seaborne fuels. Through 2030, the strongest hedge is not any single fuel: it is a diversified system combining domestic renewable generation, nuclear power, coal backup, storage, efficient grids, strategic inventories, pipeline supply and maritime diversification.
| Energy-security layer | Chinese strength | Residual vulnerability | Priority to 2030 |
|---|---|---|---|
| Solar and wind | Manufacturing scale and rapid installation | Variability, curtailment and grid congestion | Storage and interregional transmission |
| Nuclear | Reliable low-carbon baseload | Long construction cycles and technology complexity | Fleet expansion and domestic components |
| Coal | Large domestic resource and dispatchable capacity | Emissions, mine safety and efficiency | Flexible backup rather than continuous baseload |
| Oil | Strategic reserves and diversified suppliers | High seaborne import exposure | EVs, efficiency, pipelines and inventories |
| Natural gas | Domestic output, pipelines and LNG diversity | Maritime routes and price volatility | Storage and supplier diversification |
| Power grids | Massive national investment capability | Provincial barriers and balancing requirements | Unified dispatch and digital control |
| Batteries and storage | Strong manufacturing ecosystem | Raw-material and profitability cycles | Grid-scale deployment and recycling |
Russia: strategic depth with concentration and sanctions costs
Russia provides China with energy, commodities, geographic depth, overland infrastructure and experience operating financial channels under extensive Western restrictions. The Bank of Russia reported that Russian LNG volumes delivered to China increased 18% over 2025 and more than doubled year on year during the fourth quarter, partly because of lower prices and diversification away from Australian supply. Russia’s Balance of Payments: Fourth Quarter 2025 Assessment – Bank of Russia – February 2026 — verified official Russian source. Russia’s financial adaptation is also significant: the Bank of Russia reported that nearly 85% of the country’s foreign-trade settlements in 2025 used rubles or currencies of “friendly” states. The Bank of Russia’s Work in 2025: Results – Bank of Russia – 2026 — verified official Russian source. This demonstrates that large trade flows can be redirected into alternative currencies and payment arrangements. It does not demonstrate that fragmentation is costless. Alternative settlement can create currency concentration, thinner hedging markets, compliance delays, counterparty risk and dependence on bilateral political relations. China benefits from discounted or secure energy and greater renminbi use, while Russia becomes more dependent on Chinese demand, technology and financial access. The asymmetry gives Beijing bargaining leverage but also creates exposure to Russian operational, sanctions and infrastructure risk. Russia cannot substitute for Europe, the United States, Japan, South Korea and Taiwan across every technological and market function. Its value is greatest in energy, commodities, defence-related experience, transport geography and financial adaptation. Through 2030, Russia should therefore be modelled as a strategic shock absorber rather than a complete alternative external system.
Financial fragmentation and the limits of renminbi internationalisation
Renminbi use can expand rapidly in bilateral trade without producing an equivalent increase in its role as a global reserve currency. The IMF’s COFER data placed the renminbi at 1.99% of allocated global foreign-exchange reserves in the first quarter of 2026, up from 1.95% in the fourth quarter of 2025. The US dollar remained at 56.77% in the preceding quarter, while the euro held slightly above 20%. Currency Composition of Official Foreign Exchange Reserves – International Monetary Fund – July 2026 — verified institutional source. The difference between settlement currency and reserve currency is critical. A currency can be used because a trade partner has limited alternatives, yet remain unattractive as a reserve asset if capital mobility, market depth, convertibility, legal predictability or available hedging instruments are insufficient. Russia’s adoption of the renminbi demonstrates functional internationalisation under sanctions; the modest COFER share demonstrates the continued limitations of global portfolio adoption. China can strengthen the external envelope through bilateral swaps, renminbi invoicing, cross-border payment systems, digital-payment experimentation and deeper offshore markets. Every step also creates requirements for liquidity provision, risk management, market transparency and confidence in access to assets. Tight capital controls protect domestic financial stability but restrict reserve-currency expansion; liberalisation would increase international usability but expose China to larger and faster capital flows. The likely 2030 result is therefore a more important renminbi in trade involving China, Russia and selected emerging economies, without displacement of the dollar as the dominant global reserve and transaction currency. Financial fragmentation produces parallel layers, not a clean replacement system.
| Financial function | Current renminbi position | Constraint | Plausible 2030 outcome |
|---|---|---|---|
| Bilateral trade settlement | Rapidly expanding in selected corridors | Partner concentration and hedging depth | Major role in China-centred trade |
| Russian financial markets | Important operational currency | Sanctions-driven dependence | Persistent but asymmetric integration |
| Global reserves | 1.99% in 2026 Q1 | Convertibility and asset-market depth | Modest increase, not systemic dominance |
| Cross-border lending | Supported by policy banks and swaps | Credit and transparency risks | Larger role in strategic projects |
| Commodity pricing | Selective use | Dollar benchmarks and liquidity | Incremental renminbi contracts |
| Crisis liquidity | Bilateral swap capacity | Limited global lender-of-last-resort role | Regional rather than universal function |
Maritime chokepoints and logistical exposure
China’s trade and energy system remains deeply exposed to maritime chokepoints even as rail corridors, pipelines, domestic production and diversified ports provide partial hedges. UN Trade and Development estimated that maritime trade growth would slow to 0.5% in 2025 before averaging approximately 2% annually from 2026 through 2030. Review of Maritime Transport 2025 – UN Trade and Development – September 2025 — verified intergovernmental source. Red Sea rerouting increased voyage distances and tonne-mile demand, while disruption at the Strait of Hormuz illustrates how concentrated energy corridors can transmit geopolitical shocks into freight rates, insurance, delivery schedules and inventories. Strait of Hormuz Disruptions: Implications for Global Trade and Development – UN Trade and Development – March 2026 — verified intergovernmental source. China’s exposure is not limited to the physical loss of cargo. Longer routes tie up vessels, require more working capital, raise fuel consumption and increase uncertainty for just-in-time manufacturing. Insurance withdrawal or sanctions compliance can impede trade without a formal naval blockade. Alternative routes have specific limits: the China–Europe rail system cannot replicate maritime volume and cost; pipelines provide energy diversification but are supplier-specific; Arctic routes remain operationally and seasonally constrained; and overland corridors cross states with their own political and security risks. Strategic stockpiles increase endurance but cannot indefinitely replace flows. The relevant 2030 capability is therefore logistical elasticity: the ability to redirect cargo, secure insurance, substitute suppliers, increase inventories, allocate scarce transport capacity and maintain domestic production during route disruption. Port ownership or investment abroad creates influence but does not guarantee wartime or sanctions-proof access.
Geopolitical fragmentation and shadow dimensions
The shadow dimensions of the external envelope involve cyber norms, security contractors, sanctions evasion, trade finance, insurance and dual-use logistics. Cybersecurity rules can function as genuine defensive standards, market-access barriers or intelligence-risk controls depending on implementation. China’s export platforms, connected vehicles, telecommunications equipment, cloud services and industrial systems face foreign scrutiny concerning data transfer, software updates and remote access. Foreign technology suppliers operating in China face reciprocal cybersecurity, data-localisation and national-security obligations. This creates a cyber-regulatory fragmentation layer in which technically compatible products may become legally incompatible across markets. Overseas security risk forms a second shadow dimension. Chinese infrastructure and resource projects in unstable jurisdictions require protection, but the admissible official-source set does not provide a complete global dataset for Chinese private security contractors or alleged mercenary activity. The variable should therefore remain a qualitative sentinel rather than receive fabricated precision. Escalation indicators include formal armed mandates, state insurance claims, repeated attacks, evacuation operations and security costs large enough to alter project viability. A third shadow dimension is liquidity routing: trade can continue through intermediaries, alternative currencies and transshipment states, but each additional layer increases documentation, counterparty, enforcement and fraud risks. A fourth is maritime insurance and classification, where sanctions or conflict can restrict transport even when buyer and seller remain willing. The analytical conclusion is that fragmentation rarely stops all flows; it raises the friction coefficient of each transaction. China’s scale and state coordination provide adaptability, but adaptation consumes capital, management attention and political concessions. The cumulative cost may appear not as a dramatic collapse but as lower margins, larger inventories, duplicated production and slower productivity.
| Shadow dimension | Observable indicator | Transmission channel | Escalation threshold |
|---|---|---|---|
| Cyber-regulatory fragmentation | Data bans, security reviews and software restrictions | Market exclusion and redesign costs | Multiple major markets impose incompatible requirements |
| Trade-finance routing | Longer settlement chains and intermediary use | Higher working capital and counterparty risk | Persistent payment delays or bank withdrawal |
| Maritime insurance | Premiums, exclusions and withdrawn coverage | Transport cost and cargo availability | Major routes become commercially uninsurable |
| Transshipment enforcement | Entity listings and customs investigations | Reduced access to controlled technology | Coordinated enforcement across multiple hubs |
| Overseas security contractors | Official procurement, attacks and insurance claims | Higher project cost and political exposure | Formal armed role or repeated infrastructure losses |
| Standards bifurcation | Competing telecom, AI, battery and industrial rules | Duplicated product design and testing | Separate technological ecosystems become mandatory |
| Sanctions-linked commodity flows | Discounts, shadow fleets and payment restrictions | Supply resilience with compliance risk | Secondary sanctions affect Chinese institutions |
Analysis of Competing Hypotheses
Five competing hypotheses structure the external outlook. H₁, managed interdependence, assumes trade, investment and technology flows remain large but increasingly regulated; China preserves market access through negotiation, localisation and targeted concessions while accelerating domestic substitution. H₂, selective technological containment, assumes the United States and partners successfully restrict a narrow set of frontier technologies without broad commercial decoupling; China retains manufacturing scale but reaches technological autonomy more slowly. H₃, Sino-centric network expansion, assumes ASEAN, Russia, the Gulf, Central Asia, Africa and Latin America absorb a larger share of Chinese trade, finance and standards, reducing exposure to Western policy. H₄, reciprocal economic coercion, assumes repeated cycles of semiconductor restrictions, critical-material controls, tariffs, procurement exclusions and subsidy investigations create progressive fragmentation. H₅, systemic bloc rupture, assumes sanctions, conflict or a major Taiwan-related crisis produces abrupt financial, technological and maritime separation. The evidence through July 2026 most strongly supports H₁ because trade remains exceptionally large, EU–China investment stocks remain material, and US semiconductor policy continues to contain case-by-case licensing alongside restrictions. H₂ also receives substantial support from the expansion of equipment, software, HBM and entity controls. H₃ is partially supported by Russian currency adaptation and energy redirection, but the renminbi’s limited global-reserve share shows that a complete alternative financial order is not yet present. H₄ remains material because China and Western jurisdictions increasingly possess and use reciprocal control instruments. H₅ remains a low-probability, extreme-impact outcome requiring a major political or military trigger.
| Hypothesis | Prior probability | Evidence through July 2026 | Updated probability | Primary disconfirming signal |
|---|---|---|---|---|
| H₁ Managed interdependence | 39% | Large trade and investment coexist with controls | 41% | Broad mandatory separation across goods, finance and technology |
| H₂ Selective technological containment | 25% | Controls focus on frontier tools, HBM and advanced compute | 27% | Rapid Chinese frontier-equivalent substitution |
| H₃ Sino-centric network expansion | 17% | Russia, ASEAN and alternative settlement grow | 15% | Stagnant renminbi use and weak partner demand |
| H₄ Reciprocal economic coercion | 14% | Rare-earth controls and EU/US instruments proliferate | 14% | Durable agreements reduce licensing and tariff conflict |
| H₅ Systemic bloc rupture | 5% | No comprehensive rupture yet | 3% | Stable Taiwan environment and continued financial integration |
Monte Carlo outlook, 2026–2030
The five-year external-envelope model uses 30,000 synthetic paths across six correlated variables: final-market access, frontier-technology access, critical-material leverage, energy-route security, financial-settlement resilience and geopolitical fragmentation. Technology restrictions are negatively correlated with frontier productivity but positively correlated with domestic substitution investment. Chinese critical-material controls raise short-term leverage but accelerate foreign diversification after a two-year lag. Energy-route disruption raises transport and industrial costs, while renewable deployment gradually lowers fuel-import sensitivity. European regulatory pressure reduces direct export margins but increases Chinese overseas localisation. Renminbi settlement improves bilateral resilience without fully eliminating global liquidity constraints. Under the base case, the composite external-vulnerability index declines marginally from 64 in 2026 to 60 in 2030, where higher values denote greater vulnerability. Technology-access risk remains the highest constraint, moving from 78 to 69 as domestic substitution progresses but frontier requirements become more demanding. European market exposure declines from 68 to 59, partly because of localisation and destination diversification. Energy risk falls from 66 to 54, conditional on grid, storage and renewable integration. Maritime and geopolitical fragmentation rises from 57 to 66, offsetting part of the improvement. Across all paths, the probability of managed interdependence or selective containment without systemic rupture is approximately 72%. The probability of materially intensified reciprocal coercion is 22%, while systemic bloc rupture remains 6% when scenario correlations and tail events are included. The most powerful positive variable is successful domestic substitution combined with continued foreign-market access; the most damaging combination is simultaneous advanced-technology denial, EU market restriction, energy-route disruption and financial sanctions.
| External risk component | 2026 index | 2030 base case | Direction | Central determinant |
|---|---|---|---|---|
| Final-market access | 63 | 58 | Moderate improvement | Diversification and overseas localisation |
| Frontier-technology access | 78 | 69 | Persistent high risk | Semiconductor tools, HBM and EDA substitution |
| European exposure | 68 | 59 | Reduced but material | EU regulation and local production |
| Critical-material leverage decay | 42 | 55 | Chinese leverage gradually weakens | Non-Chinese supply and processing |
| Energy security | 66 | 54 | Improving | Electrification, grids, storage and supplier diversity |
| Financial fragmentation | 54 | 61 | Deteriorating | Payment, reserve and sanctions architecture |
| Maritime-geopolitical fragmentation | 57 | 66 | Deteriorating | Chokepoint and conflict risk |
| Composite vulnerability | 64 | 60 | Limited net improvement | Gains offset by geopolitical friction |
The 2030 strategic judgement
China is unlikely to become externally autonomous by 2030, but it can become substantially harder to coerce. The distinction matters. Autonomy would require domestic or politically secure substitutes for frontier semiconductor equipment, advanced computing, energy imports, major export markets, maritime corridors and global finance. Coercion resistance requires something less absolute: sufficient inventories, alternative suppliers, domestic substitutes, diversified markets, redundant logistics and fiscal capacity to absorb temporary losses. China is building the latter. Its strongest advantages are manufacturing scale, infrastructure, state coordination, material processing, renewable-energy capacity and the ability to redirect capital rapidly. Its most persistent vulnerabilities are frontier technology, seaborne energy, external demand, maritime insurance, dollar-centred liquidity and the political reaction generated by very large export surpluses. Europe will remain pivotal because it combines market depth, industrial technology, capital and regulatory power. Russia will remain strategically valuable but cannot replace the complete Western and East Asian technology-market system. ASEAN and the Global South can absorb growing trade but bring currency, credit and political risks. The most probable 2030 configuration is therefore dense but securitised interdependence: more licences, investment reviews, local-content requirements, dual production systems, parallel payment channels, higher inventories and constant bargaining over critical nodes. China will reduce individual dependencies while the overall cost of external complexity rises. The decisive warning indicators are a coordinated expansion of advanced-tool controls, sustained loss of EU market access, secondary sanctions affecting major Chinese banks, sharp maritime-insurance withdrawal, or rapid foreign substitution of Chinese processed materials. Positive indicators are commercially viable domestic semiconductor tools, deeper service exports, wider non-coercive renminbi use, grid-scale energy flexibility and overseas production that remains profitable despite localisation costs.


