











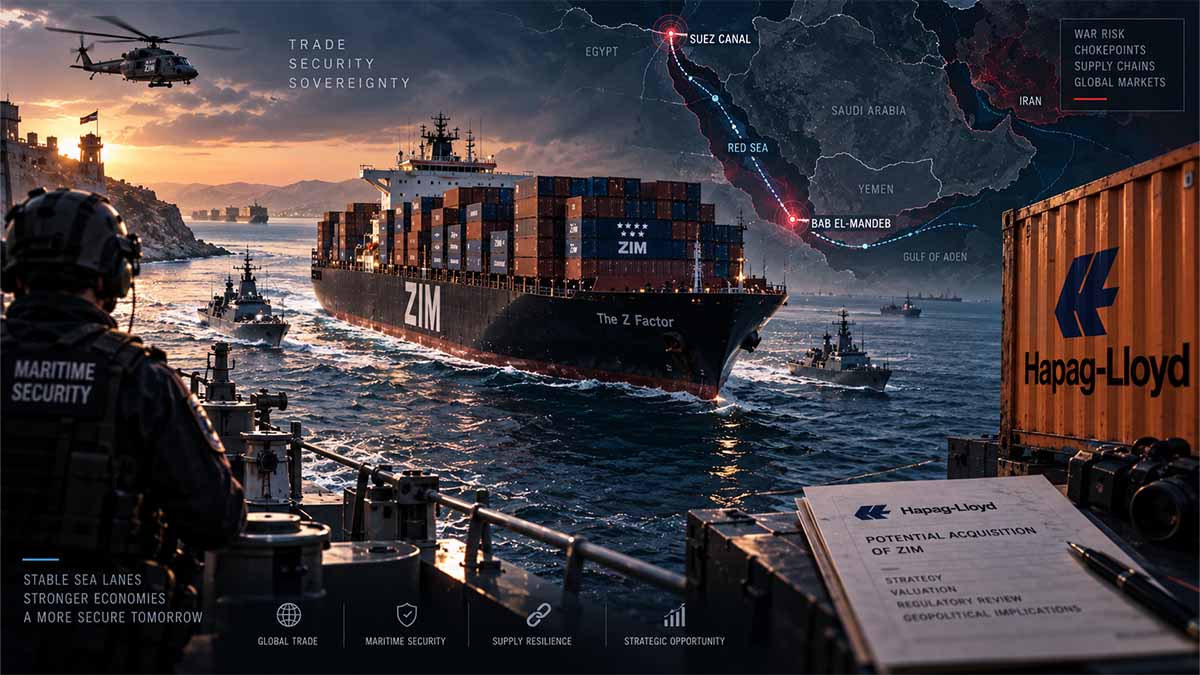
Scope: This assessment examines the proposed Hapag-Lloyd acquisition of ZIM as a strategic maritime-security and supply-chain question rather than a conventional corporate transaction, analysing Israel’s sovereign shipping exposure alongside the effects of the 2026 Middle East conflict, the Red Sea/Yemen theatre, the Russia–Ukraine war and Black Sea disruption, and the resulting implications for European logistics, energy, insurance, industrial production and maritime resilience over a five-year horizon.
Executive Summary / BLUF
- The central issue surrounding the proposed approximately $4.2 billion Hapag-Lloyd acquisition of ZIM is no longer valuation alone but control over maritime connectivity during war, because Israel’s official record shows that approximately 99% of its import and export cargo by weight moves through seaports, making shipping continuity a national economic-security function rather than an ordinary transport service. Israel State Comptroller — The Sea Ports Sector in Israel and Operational and Service Aspects at Ashdod Port
- The original February 2026 transaction contemplated Hapag-Lloyd acquiring ZIM for $35 per share in cash, representing approximately $4.2 billion in aggregate consideration, while an Israeli company controlled through FIMI would operate 16 vessels serving Israel and inherit obligations connected with the Special State Share; ZIM shareholders approved the merger on 30 April, but closing remains dependent on outstanding conditions including Israeli state approval. ZIM — ZIM to be Acquired by Hapag-Lloyd for $35.00 per Share in Cash SEC — ZIM Form 6-K, May 2026
- The strategic environment in which that deal is being judged has deteriorated markedly: the IMO reported on 16 September 2026 that it had verified 80 attacks on merchant vessels in and around the Strait of Hormuz since the Middle East conflict began on 28 February, with at least 22 seafarer deaths, while the UN has separately documented the escalation involving United States and Israeli military action against Iran and Iranian retaliation across the region. IMO — Stop attacking merchant ships and seafarers UN Secretary-General — Statement on Iran, 28 February 2026
- The economic scale of the Hormuz vulnerability is exceptional: EIA data show average oil flows through the Strait falling from 21.6 million barrels per day in Q4 2025 to 14.9 million in Q1 2026 and 4.9 million in Q2 2026, while LNG flows fell from 10.5 billion cubic feet per day to 0.8 billion cubic feet per day over the same comparison, demonstrating how maritime-security disruption can propagate directly into energy pricing, bunker costs, industrial costs and shipping economics. U.S. Energy Information Administration — Short-Term Energy Outlook, Energy Security Analysis
- Yemen and the Red Sea constitute a separate but connected risk corridor: the IMO records 61 confirmed incidents since 10 January 2024, while an August 2026 attack off Al Mokha killed additional seafarers, meaning that routing through Suez cannot be treated as structurally normal simply because individual services temporarily resume transit. IMO — Red Sea area IMO — Statement on deadly ship attack in the Red Sea, 12 August 2026
- Russia’s war against Ukraine creates an additional maritime-security theatre rather than an independent logistics problem, because the IMO reported renewed attacks on civilian merchant vessels in the Black Sea and Sea of Azov in July 2026, while an IMO programme launched in September with Ukraine, the United Kingdom, France and the European Union is explicitly designed to sustain the Special Maritime Corridor and maritime trade under wartime conditions. IMO — IMO condemns attacks on civilian merchant vessels in the Sea of Azov and the Black Sea IMO — Ukraine enhances maritime safety and Special Maritime Corridor operations
- The decisive distinction is therefore between ownership of vessels and sovereign usability of maritime capacity: national resilience depends not only on how many ships remain nominally Israeli-controlled but on enforceable access to routes, crews, fleet management, container equipment, alliance networks, insurance, port calls, emergency cargo prioritisation and the legal ability of the state to compel operations when commercial risk incentives favour withdrawal.
- The revised Hapag-Lloyd/FIMI concept reported on 27 September, including a direct Far East service and expanded Israeli emergency protections, directly addresses some of these weaknesses, but the detailed revised contractual framework has not yet appeared in the publicly available first-party corporate record examined for this assessment; until those provisions are formally documented, the strategic adequacy of the revision cannot be treated as established fact. The Times of Israel — Hapag-Lloyd revises offer as sale of Israeli shipping giant Zim hangs in the balance
When Shipping Becomes Sovereignty: ZIM, Hapag-Lloyd and the New Economics of Maritime Power
The proposed $4.2 billion acquisition of ZIM by Hapag-Lloyd has ceased to be a conventional consolidation story because the wars surrounding the Mediterranean, Red Sea, Persian Gulf and Black Sea have changed what a shipping network represents. Israel moves roughly 99% of its import and export cargo by weight through seaports, while the February 2026 transaction would place most of ZIM’s global business inside Hapag-Lloyd and leave an Israeli “New ZIM” built around 16 vessels and the state’s Special State Share protections. ZIM’s February 2026 transaction announcement therefore raises a harder question than who owns the company: whether commercial scale can be separated from sovereign control without weakening emergency access to ships, routes, containers, crews and industrial inputs.
Sixteen ships are not sixteen units of sovereignty
At the end of 2025, ZIM operated 128 vessels, of which only 16 were owned and 112 chartered, while its containership fleet provided approximately 708,543 TEU of nominal capacity. The company also controlled approximately 598,000 physical containers representing 1.067 million TEU, with 41% owned and 59% leased. Those numbers, disclosed in ZIM’s 2025 Annual Report, expose the weakness of treating the proposed 16-vessel Israeli carrier as a self-contained strategic asset: liner shipping is a system of hulls, charter contracts, equipment pools, terminals, crews, data, insurance and network agreements, and sovereignty over one component does not automatically create sovereignty over the system.
The Special State Share already recognises this problem more clearly than the political shorthand suggests. The disclosed framework requires ZIM to remain incorporated and headquartered in Israel, maintain at least 11 wholly owned seaworthy vessels, retain an Israeli board majority and Israeli chief executive, and obtain state consent for specified changes of control and structural transactions. The March 2026 ZIM proxy statement also shows that the Israeli partner must receive assets, employees and services necessary to assume those obligations. The central negotiation is therefore not over a fleet number but over whether the protected Israeli perimeter contains enough operational substance to function when the surrounding global network is under stress.
The wars have turned distance into a balance-sheet cost
The Red Sea crisis demonstrated how quickly route insecurity reduces the productivity of the merchant fleet without sinking a single ship. UN Trade and Development’s Review of Maritime Transport 2024 estimated that rerouting around the Cape of Good Hope had increased container-ship ton-mile demand by roughly 12%, while a representative Shenzhen–Rotterdam voyage increased from about 10,000 nautical miles and 31 days through Suez to 13,000 nautical miles and 41 days around the Cape. The cargo still arrives, but each ship and container remains occupied longer, reducing effective capacity and increasing the amount of inventory companies must finance while goods are in transit.
The 2026 Middle East conflict has added a more dangerous layer because Hormuz is simultaneously a shipping chokepoint and an energy chokepoint. The U.S. Energy Information Administration recorded oil flows through Hormuz falling from 21.6 million barrels per day in Q4 2025 to 4.9 million in Q2 2026, while LNG flows fell from 10.5 billion cubic feet per day to 0.8 billion over the same comparison. By 24 September 2026, the International Maritime Organization listed 85 confirmed maritime incidents in the Middle East theatre. That combination pushes conflict into bunker prices, charter costs, insurance, vessel availability and ultimately the landed cost of goods far beyond the Gulf itself.
Insurance now decides whether a route exists commercially
The distinction between an open waterway and a commercially usable one has become central to global logistics. In March 2026, Hapag-Lloyd introduced a War Risk Surcharge of $1,500 per TEU for standard equipment and $3,500 per reefer or special container on cargo moving to, from or through the Upper Gulf, Arabian Gulf and Persian Gulf. Hapag-Lloyd’s surcharge notice therefore captured a shift that conventional trade statistics miss: a port may remain operational and a ship technically available while the cost and contractual conditions of reaching it change abruptly.
Maersk reported the same transmission through fuel. Its March 2026 Emergency Bunker Surcharge reached $200 for a 20-foot dry headhaul container, $400 for a 40-foot dry container and $600 for a 40-foot reefer on relevant long-haul trades after regional refinery disruption and fuel-sourcing difficulties. Maersk’s published surcharge schedule shows why maritime wars propagate into industries that never operate near the battlefield: every additional nautical mile is consumed with fuel priced in a market already affected by the same conflict.
Europe’s factories sit downstream from the same maritime risk
Europe’s exposure is industrial rather than merely logistical. EU ports handled approximately 3.4 billion tonnes of freight in 2024, while the Union remained dependent on net imports for roughly 57% of its energy needs. Eurostat’s port-freight data show that major port flows include petroleum, natural gas, refined products, ores, chemicals, agricultural goods and food, all of which feed production chains rather than simply retail consumption.
The China relationship makes the production risk more explicit. In 2025, the EU imported €559.4 billion of goods from China, including €164.9 billion of electrical machinery and related equipment and €106.5 billion of machinery and mechanical appliances. Eurostat’s EU–China trade data therefore place almost half of those imports in categories directly connected to industrial equipment, electronics and manufacturing systems. A longer Asia–Europe route is not merely a freight problem when the cargo consists of components that determine whether a European production line can run.
Germany illustrates the concentration. In the first five months of 2026, 86.1% of Germany’s imported photovoltaic modules and panels came from China, while German seaports handled 284.4 million tonnes in 2025, including 171.1 million tonnes received from abroad. Destatis records the photovoltaic dependence, while German port statistics show the physical scale of maritime exposure. Berlin’s industrial vulnerability is consequently not port closure alone but the possibility that imported energy, machinery, electronics and chemicals become slower, more expensive or less predictable at the same time.
Italy, France and Britain carry different versions of the same dependence
Italy entered 2026 with a €50.7 billion merchandise surplus in 2025, but its pharmaceutical exports had risen 28.5%, while natural gas represented 36% of the Italian energy mix in 2024. Istat’s 2025 foreign-trade release and Eurostat’s energy data describe an economy that combines high-value industrial exports with continuing imported-energy dependence. Maritime resilience therefore affects not only Italy’s energy bill but also the inputs and outward flows of pharmaceuticals, machinery, food and manufacturing.
France handled 333.4 million tonnes of maritime freight in 2025, while pharmaceutical imports reached approximately €38.4 billion and aerospace imports about €35.2 billion. French transport statistics and French Customs show why sovereign industrial capability should not be confused with autarky: French aerospace and pharmaceuticals remain embedded in international supply chains whose upstream components continue to cross maritime borders.
The United Kingdom handled 428.3 million tonnes of port freight in 2025, including 237.5 million tonnes of imports, while deep-sea container imports reached 25.1 million tonnes. UK Department for Transport statistics underline a different structural reality: an island economy can diversify suppliers and routes, but it cannot diversify away from ports. The resilience problem is consequently whether enough deep-sea, short-sea, energy-terminal and inland logistics capacity remains available when one trade corridor becomes impaired.
Defence and energy policy now depend on commercial logistics
The European Union has already embedded this logic in industrial policy. The Critical Raw Materials Act sets 2030 benchmarks of at least 10% domestic extraction, 40% processing and 25% recycling, while seeking to keep dependence on any single third country below 65% for each strategic material at a relevant processing stage. The European Commission’s Critical Raw Materials Act framework is therefore as much a logistics document as an industrial one: domestic final assembly offers limited resilience when mining, refining or component production remains concentrated abroad.
Defence production creates the same problem under greater time pressure. The European Commission estimated Member State defence expenditure at approximately €381 billion in 2025, while its defence-industrial work has identified dependencies in processed materials, electronics and specialised components. The European Commission’s defence-industry programme means that a missile, armoured vehicle, drone or radar programme can be constrained not by the absence of final assembly capacity but by one imported energetic precursor, semiconductor, alloy or machine-tool component. Commercial maritime resilience has consequently become part of defence readiness.
The cost over the next 24 months will fall on inventories before it falls on trade volumes
Between September 2023 and June 2026, Ukraine’s maritime corridor moved 200 million tonnes of cargo, including 118 million tonnes of grain and more than 7,800 vessel movements, according to the Ukrainian Ministry for Communities and Territories Development. The Black Sea record proves that maritime trade can continue through war when security, port operations and institutional support are organised around continuity; it does not prove that trade continues at peacetime cost.
Over the next 12–24 months, the commercial burden will increasingly appear away from freight invoices: larger safety stocks, longer financing periods, duplicated suppliers, additional warehouses, reserved transport capacity and more expensive qualification of alternative inputs. Israel’s June 2026 import structure already shows 42% of goods imports in raw materials and 19% in machinery, equipment and land vehicles for investment, according to the Israel Central Bureau of Statistics. If maritime resilience remains governed primarily by peacetime price optimisation, the immediate cost will be paid by manufacturers carrying more working capital and consumers facing higher landed costs; the larger cost will be paid by industrial systems when a cheap but irreplaceable imported component becomes unavailable.
That is the significance of the ZIM transaction beyond Israel. Hapag-Lloyd’s global network can provide more redundancy than a small national fleet, while an Israeli-controlled carrier can preserve functions that a purely commercial network has no obligation to maintain during war. The unresolved choice is not between globalisation and sovereignty. It is whether governments can define which pieces of globalisation must remain contractually available when markets, insurers and carriers have rational reasons to withdraw them.
Navigational Index
Maritime Sovereignty, ZIM and the Architecture of Emergency Control
The first pillar examines the Hapag-Lloyd transaction, the Israeli Special State Share, the division between global ZIM operations and the proposed Israeli carrier, vessel numbers, route guarantees, ownership structure, fleet-management sovereignty, labour and professional expertise, container availability, commercial alliances, emergency requisition rights and the distinction between nominal ownership and operational control.
War-Torn Chokepoints and the Transformation of Global Logistics
The second pillar examines how the Middle East conflict, the Strait of Hormuz, Yemen and the Red Sea, Suez, the Russia–Ukraine war and Black Sea corridor collectively transform shipping economics through rerouting, war-risk premiums, insurance availability, bunker costs, fleet utilisation, sailing times, container imbalances, port congestion and industrial inventory requirements.
Strategic Business Exposure from Israel to Europe and the Global Supply Chain
The third pillar evaluates maritime transport as a hidden enabling infrastructure across energy, manufacturing, food, pharmaceuticals, defence, chemicals, automotive production, electronics and critical commodities, before assessing Israel, Germany, Italy, France, the United Kingdom and the European Union separately and identifying the indicators capable of changing the five-year resilience assessment.
Master Abstract
The ZIM Transaction Has Become a Test of What Maritime Sovereignty Means
The proposed acquisition of ZIM must be evaluated against a structural fact that predates the transaction but has become significantly more consequential during the current conflict environment: Israel functions economically as a maritime-dependent state whose external merchandise flows are overwhelmingly dependent on functioning ports and commercially available ocean transport. The Israel State Comptroller states that approximately 99% of the total weight of Israeli import and export cargo passes through its seaports, explicitly describing this dependence as deriving from Israel’s geography, geopolitical circumstances and need for imported goods; the Ministry of Transport’s maritime statistical yearbook separately recorded approximately 69.1 million tonnes of cargo handled at Israeli ports during 2024, including approximately 21.3 million tonnes of fuel and coal, while estimating Israeli maritime foreign trade excluding diamonds at approximately $144 billion during that year. Israel State Comptroller — The Sea Ports Sector in Israel and Operational and Service Aspects at Ashdod Port Israel Ministry of Transport — Statistical Yearbook 2024
This dependence makes the relevant strategic unit larger than ZIM itself. Ports without available ships do not secure trade; ships without containers, crews, insurance, bunkers, functioning foreign terminals and commercially viable return cargoes do not constitute reliable capacity; and nominal ownership does not guarantee emergency usability if route deployment, vessel-management systems, charter-party structures, international alliances or container pools remain dependent upon external counterparties. The Israeli state’s historical Special State Share in ZIM recognised this distinction well before the present transaction: the State Comptroller’s account of ZIM’s privatisation records that the share was created specifically to safeguard essential state interests and included, among other requirements, a minimum wholly owned fleet of 11 vessels. Israel State Comptroller — Sale of State Holdings in ZIM
The February 2026 merger agreement attempted to preserve this sovereign layer while transferring most of ZIM’s broader business into Hapag-Lloyd. Under ZIM’s formal announcement, Hapag-Lloyd would pay $35 per share, valuing the transaction at approximately $4.2 billion, while FIMI would establish “New ZIM” with 16 vessels, commercial support from Hapag-Lloyd and access to the Gemini network; the stated service concept included direct connections between Israel and major destinations in the European Union, United States, Mediterranean and Black Sea. The same disclosure projected that the combined Hapag-Lloyd/ZIM platform would exceed 400 vessels, 3 million TEU of capacity and 18 million TEU of annual cargo volume in 2027. ZIM — Acquisition Announcement, 16 February 2026
The strategic weakness in a purely numerical reading of the arrangement is that a 16-vessel fleet does not itself answer the emergency-supply question. The relevant questions are which vessels, of what capacity and technical characteristics, are available; whether they are owned or chartered; which trades they can economically sustain; which foreign terminals will accept them during crisis conditions; whether sufficient containers and reefer equipment remain available; who controls vessel deployment and commercial scheduling; whether crews remain willing and insurable; what contractual priority Israel receives during a simultaneous global shipping disruption; and whether network partners are legally obligated to honour connections when their own security policies change. These issues convert what appears in ordinary corporate analysis as a fleet question into a systems-control question.
The Revised Offer Addresses the Correct Problem, but Its Legal Substance Remains the Critical Unknown
The revised framework reported publicly on 27 September 2026 is strategically significant precisely because its reported changes move beyond transaction valuation and toward operational sovereignty. The reported additions include a direct Far East service, broader Israeli protections over the Israeli fleet and operations during emergencies, preservation of vessel management and professional expertise in Israel, and employee safeguards. These provisions correspond closely to the actual vulnerabilities produced by war: a state cannot compensate for a closed or militarily dangerous eastern maritime corridor merely by possessing Atlantic-facing capacity, because Asian manufacturing, electronics, machinery, intermediate goods and other supply chains cannot automatically be reconstructed through Mediterranean or transatlantic services. The reported Far East commitment therefore addresses a genuine network-resilience gap rather than a symbolic political concern. The Times of Israel — Hapag-Lloyd revises offer as sale of Israeli shipping giant Zim hangs in the balance
Nevertheless, evidentiary discipline requires an important distinction. ZIM’s current investor-relations material confirms the merger agreement and confirms that Israeli regulatory approval remains outstanding, while its July and August filings state that the parties continue to engage with relevant authorities; those public first-party documents do not yet reproduce the complete revised September safeguards described in press reporting. ZIM Investor Relations — Proposed Merger with Hapag-Lloyd SEC — ZIM Provides Update on Merger Agreement, 6 July 2026
The difference is consequential because an emergency guarantee is only as robust as its operative language. A commitment to “maintain” a route, for example, is analytically different from a legally enforceable obligation defining frequency, vessel capacity, permitted suspension events, force-majeure treatment, security thresholds, state direction powers, minimum container allocation, replacement tonnage, service restoration deadlines and penalties for non-performance. Similarly, state “control” over an Israeli fleet can mean anything from consultation rights to binding direction of vessels. The final revised transaction documents therefore matter more than public assurances in determining whether the proposed structure delivers meaningful maritime autonomy.
The Shareholder Structure Does Not Determine Operational Control, but It Raises a Legitimate Governance Question
Hapag-Lloyd’s current corporate information identifies a concentrated shareholder structure that includes CSAV at 30%, Klaus-Michael Kühne interests at 30%, the City of Hamburg’s HGV at 13.9%, Qatar Investment Authority at 12.3% and Saudi Arabia’s Public Investment Fund at 10.2%, with 3.6% free float as of 30 June 2026. Hapag-Lloyd — Company Profile and Shareholder Structure
Those holdings should not be analytically converted into an unsupported claim that Qatar or Saudi Arabia would control Israeli shipping operations, because minority share ownership is not equivalent to management authority, operational command or unilateral strategic veto. The relevant sovereign-risk question is narrower and more legally testable: whether the Israeli company, its board, vessel deployment, sensitive information, strategic routes, emergency obligations and transfer of ownership would remain protected against future changes in Hapag-Lloyd’s shareholder structure or corporate governance. A resilient transaction architecture therefore depends upon enforceable state protections rather than assumptions about the political intentions of present shareholders.
The 2026 Middle East War Has Demonstrated Why Shipping Control Can Become National Infrastructure
The geopolitical environment against which the acquisition is now being judged differs fundamentally from that prevailing when shipping concentration and liner consolidation were primarily analysed through competition, service frequency and freight pricing. The UN Secretary-General recorded that United States and Israeli forces used force against Iran on 28 February 2026 and Iran subsequently retaliated across the region, while also reporting threats to international navigation through Hormuz; subsequent UN statements repeatedly identified the prolonged restriction of maritime traffic through the Strait as a major global economic problem. United Nations — Secretary-General’s remarks to the Security Council, 28 February 2026 United Nations — Secretary-General’s press encounter on the situation in the Middle East, 25 March 2026
The maritime consequences have been measurable rather than theoretical. The IMO stated on 16 September that it had verified 80 attacks against merchant vessels in and around Hormuz since the conflict began, causing at least 22 seafarer deaths. At the end of August, the organisation reported that as many as 400 vessels carrying around 6,000 seafarers had been unable to depart safely from the Persian Gulf at various points since the crisis began. IMO — Stop attacking merchant ships and seafarers, 16 September 2026 IMO — Six months of uncertainty for seafarers in Strait of Hormuz
The economic transmission mechanism operates well beyond petroleum. Tanker disruption raises crude and refined-product risk, which affects marine-fuel costs; higher bunker costs propagate into container, bulk and specialised shipping; vessel immobilisation reduces effective global capacity; risk exclusions or higher insurance premiums alter voyage economics; congestion and rerouting extend round trips; and longer round trips absorb vessels and containers that would otherwise support additional sailings. The result is that a conflict affecting one geographic chokepoint can produce transport scarcity on trades that never physically enter that chokepoint.
The EIA data illustrate the magnitude of this effect. Oil moving through Hormuz fell to 4.9 million barrels per day in Q2 2026, compared with 21.6 million barrels per day in Q4 2025, while LNG flows declined from 10.5 billion cubic feet per day to 0.8 billion cubic feet per day across the same comparison. These figures concern energy flows rather than container shipping, but their significance for liner economics is indirect and powerful because energy availability and fuel pricing influence the cost base of virtually every maritime supply chain. EIA — Short-Term Energy Outlook: Energy Security Analysis
Yemen Has Converted the Red Sea from a Route Assumption into a Route Option
The Red Sea crisis demonstrates another essential distinction between infrastructure and usable infrastructure. The Suez Canal may remain physically open while shipping companies choose not to expose crews, vessels or cargo to the southern Red Sea because their security assessments, insurers or alliance partners consider the transit unacceptable. The IMO states that the Red Sea normally carries approximately 15% of international shipping trade, which means security conditions there influence the utilisation of a corridor whose importance extends far beyond countries bordering the sea. IMO — Maintenance of international peace and security, UN Security Council statement
The risk has also persisted beyond the first wave of Houthi attacks. IMO’s current Red Sea record reports 61 confirmed incidents since 10 January 2024, in addition to earlier incidents beginning in November 2023, and in August 2026 the organisation confirmed further seafarer fatalities following an attack on the cargo ship TIHAMAH off Al Mokha. IMO — Red Sea area: confirmed incidents IMO — Statement on deadly ship attack in the Red Sea
Hapag-Lloyd’s own operating decisions provide direct commercial evidence of how quickly security assessments can change. In February 2026 Hapag-Lloyd and Maersk announced that a Gemini service would begin returning to the Red Sea and Suez with naval assistance, but subsequent operating constraints led some sailings to be redirected around the Cape of Good Hope; by July, the companies again announced Red Sea routing for the SE3 service following another security assessment. Hapag-Lloyd — Hapag-Lloyd and Maersk to transit Red Sea with one Gemini service Hapag-Lloyd — Update on Red Sea Transit and Temporary Route Adjustments Hapag-Lloyd — Routing update for our SE3 service
That sequence demonstrates why a direct Israel–Far East route cannot be analysed simply by drawing a scheduled line between an Israeli and Asian port. Its strategic value depends upon whether the operator can sustain service through Suez during acceptable security conditions, reroute around Africa when Suez becomes unsafe, preserve enough vessel capacity to absorb the substantially longer rotation, and maintain commercial and container support throughout both configurations.
Russia–Ukraine Adds a Second Continental Maritime War Zone
The Black Sea should be considered alongside the Middle East corridors because it creates a separate source of military risk for commercial shipping and because disruptions can interact through fleet availability, food markets, insurance and European port networks. In July 2026, the IMO reported a resurgence of attacks against civilian merchant vessels in the Black Sea and Sea of Azov, explicitly warning that attacks on commercial shipping threaten navigation and global supply chains. IMO — IMO condemns attacks on civilian merchant vessels in the Sea of Azov and the Black Sea
The persistence of Ukrainian maritime exports under wartime conditions has consequently required an increasingly institutionalised security architecture. On 14 September 2026, the IMO announced implementation of a project funded by the United Kingdom, France and European Union to support maritime safety, environmental protection, trade facilitation and the continued operation of Ukraine’s Special Maritime Corridor. IMO — Ukraine enhances maritime safety and Special Maritime Corridor operations
For ZIM and Israel, the significance is not that the Black Sea and Hormuz crises are operationally identical; they are not. The strategic lesson is that multiple commercially important maritime theatres can become simultaneously contested, meaning resilience cannot be based upon the assumption that disruption in one corridor will always be compensated by spare capacity elsewhere.
Shipping Is a Hidden Balance-Sheet Variable Across Entire Industries
Maritime logistics should therefore be treated as an enabling infrastructure across business models that rarely identify shipping as their principal activity. Automotive manufacturers depend upon imported components and finished-vehicle logistics; electronics companies depend upon Asian production networks and container availability; chemical and plastics businesses depend upon both containerised and bulk feedstocks; food security combines dry-bulk commodity shipping, reefers and containers; pharmaceuticals depend upon temperature-controlled logistics and predictable transit times; construction depends upon metals, cement, machinery and specialised project cargo; energy systems require tankers, LNG carriers and industrial inputs; and defence production depends upon imported metals, chemicals, electronics, machine tools and specialised components.
Hapag-Lloyd’s own cargo composition illustrates the breadth of these dependencies: its corporate factsheet identifies plastics and rubber, machinery, food and beverages, agriculture, chemicals, metals and minerals, textiles, forest products, automotive goods, furniture and electronics among the major categories moved through its approximately 300-vessel, 129-service global network. Hapag-Lloyd — Facts & Figures
The implication is that freight disruption should not be measured only through transport expenditure. A delayed $50,000 component shipment can interrupt production worth many multiples of its freight cost; a missing industrial chemical can halt downstream processes; a lack of refrigerated capacity can destroy perishable cargo; and unpredictable transit times can force businesses to increase inventory, working capital and warehousing. Maritime instability therefore migrates from the freight line of the income statement into inventories, financing requirements, production scheduling, insurance, customer-service levels and ultimately investment decisions.
Israel’s Experience Also Demonstrates That Disruption Does Not Automatically Mean Economic Collapse
Analytical discipline requires an important counterweight to a purely vulnerability-driven interpretation. A Bank of Israel study examining the first phase of Houthi disruption concluded that diversion of Asia–Mediterranean traffic around the Cape of Good Hope did not generate an exceptional decline in Israeli imports from Asia or a rise in Israeli import prices during the period studied, even though other Mediterranean OECD economies experienced a temporary reduction in Asian imports. Bank of Israel — The Impact of Houthi Attacks on International Trade: Is Israel an Exception?
This evidence matters because it shows that route disruption can be absorbed when carriers, suppliers and importers retain sufficient commercial flexibility, alternative routing and available shipping capacity. It does not demonstrate that Israel is immune to larger or simultaneous maritime shocks, particularly when Hormuz, the Red Sea and other routes face concurrent security stress; rather, it demonstrates that maritime resilience is produced by network adaptability as much as by sovereign vessel ownership.
Commercial Strength and Sovereign Resilience Are Not the Same Metric
ZIM remains a substantial operating business rather than a distressed national asset. Its second-quarter 2026 results recorded $1.78 billion in revenue, 922,000 TEU carried, an average freight rate of $1,590 per TEU, adjusted EBITDA of $491 million and $386 million in free cash flow; for the first half, however, revenue declined to $3.18 billion from $3.64 billion a year earlier and the average freight rate declined to $1,455 from $1,632, illustrating the continuing cyclicality of container shipping even during periods of acute geopolitical stress. ZIM — Second Quarter 2026 Results
That distinction matters when evaluating the sale. A commercially rational transaction for shareholders can coexist with legitimate state concerns over strategic redundancy, while a national-security restriction can impose real economic costs through reduced scale, weaker network density or less efficient capital allocation. The analytical task is therefore not to label foreign ownership inherently unsafe or domestic ownership inherently resilient, but to determine which capabilities must remain under enforceable Israeli control and which can safely be supplied through a larger international carrier network.
Key Evidence Table
| Indicator | Value/status | Reference date | Definition/scope | Issuer | Exact source |
|---|---|---|---|---|---|
| Israeli merchandise cargo moved through seaports | ~99% by weight | Current State Comptroller baseline | Imports and exports by cargo weight | State Comptroller of Israel | Sea Ports Sector in Israel |
| Israeli maritime foreign trade | $144bn | 2024 | Excluding diamonds; $89bn imports, $55bn exports | Israel Shipping and Ports Authority | Statistical Yearbook 2024 |
| Original Hapag-Lloyd consideration for ZIM | ~$4.2bn / $35 per share | 16 Feb 2026 | Equity transaction | ZIM | Merger announcement |
| Proposed Israeli carrier fleet | 16 vessels | Feb 2026 framework | “New ZIM” | ZIM | Merger announcement |
| Historical Special State Share minimum | 11 wholly owned vessels | Privatisation framework | Minimum fleet requirement recorded by State Comptroller | State Comptroller | Sale of State Holdings in ZIM |
| ZIM Q2 revenue | $1.78bn | Q2 2026 | Consolidated revenue | ZIM | Q2 2026 results |
| ZIM Q2 carried volume | 922,000 TEU | Q2 2026 | Container volume | ZIM | Q2 2026 results |
| Hormuz verified merchant-vessel attacks | 80 | Through 16 Sep 2026 | International shipping in and around Hormuz | IMO | IMO, 16 September 2026 |
| Hormuz seafarer fatalities | At least 22 | Through 16 Sep 2026 | Verified conflict-related shipping incidents | IMO | IMO, 16 September 2026 |
| Hormuz oil flows | 4.9m b/d | Q2 2026 | Crude, condensate and products | EIA | EIA Energy Security Analysis |
| Comparable Hormuz oil flows | 21.6m b/d | Q4 2025 | Same EIA definition | EIA | EIA Energy Security Analysis |
| Red Sea confirmed incidents | 61 since 10 Jan 2024 | Current IMO record | Incidents notified to and confirmed by IMO | IMO | IMO Red Sea area |
| Approximate share of international shipping through Red Sea lane | ~15% | IMO baseline | International shipping trade | IMO | IMO statement to UN Security Council |
| Hapag-Lloyd fleet | 300 vessels | 30 Jun 2026 corporate factsheet | Container fleet | Hapag-Lloyd | Company Profile |
| Qatar Investment Authority interest in Hapag-Lloyd | 12.3% | 30 Jun 2026 | Equity ownership | Hapag-Lloyd | Company Profile |
| Saudi PIF interest in Hapag-Lloyd | 10.2% | 30 Jun 2026 | Equity ownership | Hapag-Lloyd | Company Profile |
Strategic Transmission Architecture
War-to-Business Maritime Transmission Chain
Conflict
Hormuz attacksRed Sea / Yemen attacks
Black Sea warfare
Maritime Constraint
Route closure or avoidanceVessel immobilisation
Crew and insurance restrictions
Shipping Effect
Longer rotationsHigher fuel consumption
Capacity absorption
Container imbalance
Business Effect
Inventory expansionWorking-capital demand
Production delays
Input-price volatility
Sovereign Effect
Emergency-supply exposureRoute dependency
Need for enforceable lift capacity
Strategic shipping governance
| Verified anchor | Observed status | Reference date | Analytical significance |
|---|---|---|---|
| Strait of Hormuz | 80 IMO-verified merchant-vessel attacks; at least 22 seafarer deaths | 16 September 2026 | Physical security can remove nominal shipping capacity from effective commercial supply. |
| Red Sea | 61 confirmed incidents since 10 January 2024 | Current IMO record | Suez availability does not guarantee carrier willingness to transit. |
| Black Sea / Sea of Azov | Renewed attacks against merchant shipping | July 2026 | Europe faces simultaneous maritime-security stress in more than one theatre. |
| Israel | Approximately 99% of import/export cargo by weight passes through seaports | Official structural baseline | Loss of maritime connectivity rapidly becomes a national economic-security problem. |
Scale: qualitative causal architecture anchored to official incident and trade data; it is not a numerical risk score and does not assign probabilities. Uncertainty: the effect on any individual business depends upon commodity, inventory, contract, route, insurance and substitution capacity.
Principal Gaps and Watch Indicators
The Revised Transaction Instrument Is the Decisive Missing Record
The most important outstanding document is the complete revised Hapag-Lloyd/FIMI proposal expected to embody the reported September safeguards. Decision-grade analysis requires the operative provisions governing route frequency, minimum fleet, ownership, chartering, emergency direction, crew and management location, container allocation, access to the Gemini network, termination rights, change-of-control restrictions and force majeure. Public descriptions cannot substitute for those clauses because relatively small wording differences can determine whether a state possesses a binding emergency capability or merely a commercial commitment.
Vessel Count Must Be Converted into Actual Lift Capability
The repeated political debate over whether Israel requires 11, 16, 50 or another number of vessels cannot be resolved analytically by vessel count alone. The missing variables include TEU capacity, reefer plugs, vessel age, fuel type, ownership versus charter status, flag, crewing, operating cost, permitted deployment, maintenance availability and the cargo mix each ship can actually support. A smaller number of appropriately configured vessels integrated into a robust network can provide greater usable connectivity than a larger fleet without terminals, containers or commercially sustainable backhaul; conversely, network access dependent entirely upon foreign counterparties can weaken the strategic value of nominal domestic tonnage.
Red Sea Normalisation Should Be Judged by Repeated Operational Behaviour
A durable improvement would be indicated not by a single carrier resuming Suez transit but by sustained services from multiple major operators, reduced reliance on Cape routings, normalised war-risk insurance conditions and the absence of verified attacks over a meaningful period. Hapag-Lloyd’s own sequence of reopening, rerouting and reopening during 2026 demonstrates that individual announcements should not be interpreted as permanent corridor normalisation. Hapag-Lloyd — Red Sea and Suez service announcement Hapag-Lloyd — SE3 routing update, July 2026
Hormuz Remains the Strongest Systemic Maritime Indicator
The most important external indicator is sustained restoration of navigational security through Hormuz, measured through IMO incident frequency, vessel departures, stranded-seafarer numbers and recovery in EIA-recorded energy flows. The gap between 21.6 million barrels per day in Q4 2025 and 4.9 million barrels per day in Q2 2026 illustrates the scale of disruption already experienced and provides an observable baseline against which subsequent normalisation can be measured. EIA — Short-Term Energy Outlook, Energy Security Analysis
Black Sea Security Must Remain Inside the Same Maritime Risk Dashboard
A reduction in Middle East maritime risk would not restore the pre-war global shipping environment if attacks against commercial vessels persist in the Black Sea and Sea of Azov. Continued functioning of Ukraine’s Special Maritime Corridor, changes in insurance conditions, attacks on ports and vessels and the durability of the IMO-supported maritime-security programme therefore belong in the same strategic monitoring framework rather than in a separate regional file. IMO — Ukraine enhances maritime safety and Special Maritime Corridor operations
The Final Judgment Depends on Control, Not the Nationality Printed on the Hull
The evidence available as of 29 September 2026 supports a narrower but more consequential conclusion than either the proposition that foreign acquisition necessarily destroys Israeli maritime independence or the proposition that a 16-vessel Israeli spin-off automatically guarantees it. Israel’s maritime resilience will depend upon the combination of legally enforceable sovereign control, geographically diversified direct routes, operationally usable vessels, domestic management competence, internationally accessible container and terminal networks, reliable crews and insurance, and contractual mechanisms capable of surviving precisely the emergency in which commercial incentives become least aligned with state requirements.
That is why the ZIM transaction has become more than a shipping-company acquisition. The wars surrounding Israel, the continuing Yemen/Red Sea threat and the Russia–Ukraine maritime theatre have demonstrated that maritime logistics is simultaneously a market, an industrial input, an energy transmission mechanism and an instrument of national resilience; the final revised transaction should therefore be judged against the operating conditions of a contested maritime system rather than against the assumptions of peacetime container economics.
ZIM at the Maritime Sovereignty Fault Line
The transaction is not adequately described as a conventional corporate acquisition. Under simultaneous pressure from the Israel–Iran conflict, attacks around the Strait of Hormuz, the Yemen–Red Sea theatre and the Russia–Ukraine maritime war, the decisive question becomes whether Israel retains enforceable control over the physical, contractual and network components required to sustain maritime trade during a major emergency.
The War-to-Business Maritime Transmission Chain
Conflict & Military Risk
Israel–Iran hostilities, attacks around Hormuz, Houthi operations in the Red Sea, and attacks on commercial navigation in the Black Sea and Sea of Azov.
Route Constraint
Transit avoidance, security exclusions, vessel immobilisation, reduced port access, crew exposure and diversion around longer routes such as the Cape of Good Hope.
Shipping-Market Effect
Higher bunker consumption, longer vessel rotations, lower effective capacity, container imbalance, insurance pressure and less schedule reliability.
Corporate Transmission
Larger inventories, higher working-capital requirements, production interruptions, procurement delays, freight volatility and altered sourcing strategies.
Sovereign Exposure
Emergency-supply risk, loss of route autonomy, dependence on foreign carrier decisions, and pressure for enforceable national maritime capacity.
Four Maritime Security Pressure Zones
Strait of Hormuz
80 verified attacksAt least 22 seafarer deaths were recorded by the IMO through 16 September 2026, while energy flows through the strait fell sharply during the conflict.
Red Sea / Yemen
61 confirmed incidentsThe continuing attack record demonstrates that physical availability of the Suez route does not guarantee commercial willingness to transit the southern Red Sea.
Black Sea
Active wartime corridorRenewed attacks on merchant shipping and continued operation of Ukraine’s Special Maritime Corridor create a second major maritime-security theatre affecting European trade.
Israel
Extreme maritime dependenceIsrael’s geography and trade structure mean that sustained disruption of maritime access can become a national economic-security issue rather than merely a freight-market problem.
Maritime Sovereignty Is Larger Than Vessel Ownership
Nominal Sovereignty
- Israeli-owned vessels
- Israeli flag or domestic corporate ownership
- Special State Share protections
- Minimum fleet requirements
Operational Sovereignty
The decisive capability is the state’s ability to convert ownership and contractual rights into usable maritime lift during crisis conditions.
Strategic Test
- Can the state direct voyages in an emergency?
- Can services continue when commercial incentives favour withdrawal?
- Are Far East connections contractually protected?
- Can replacement tonnage be compelled or sourced?
- Are domestic management and maritime expertise retained?
Why Maritime Logistics Is a Hidden Variable Across Major Business Sectors
The Hapag-Lloyd–ZIM Transaction: Strategic Decision Architecture
| Dimension | February 2026 baseline | Strategic weakness | Reported revised direction | Record still required |
|---|---|---|---|---|
| Israeli fleet | 16-vessel New ZIM structure. | Vessel count alone does not establish lift capacity or emergency availability. | Expanded Israeli protections reportedly proposed. | Exact vessel specifications, ownership and emergency-control provisions. |
| Far East connectivity | Original publicly described Israeli route architecture centred principally on Europe, Mediterranean, Black Sea and US connectivity. | Insufficient direct coverage of major Asian supply chains. | Weekly direct Far East route reportedly added. | Frequency, capacity, suspension clauses and alternative routing obligations. |
| State authority | Special State Share transferred to the Israeli structure. | Formal state rights do not automatically equal operational control. | Broader emergency protections reportedly offered. | Binding wording defining state direction powers and enforcement mechanisms. |
| Management expertise | New Israeli carrier to operate locally. | Loss of professional capability would weaken practical sovereignty even if assets remain domestic. | Domestic vessel management and expertise reportedly protected. | Employment, management-location and continuity obligations. |
| Global network | Access to Hapag-Lloyd and Gemini commercial network. | Network dependence may create external decision points during crisis. | Commercial integration maintained. | Guaranteed access during emergencies, including terminals, containers and feeder services. |
Controlling Strategic Judgment
The decisive test is not whether ZIM remains Israeli in name, whether Hapag-Lloyd is foreign, or whether a specific fleet number appears politically sufficient. The relevant national-security question is whether Israel retains legally enforceable, technically usable and geographically diversified maritime capacity during precisely the conditions in which ordinary commercial incentives, insurance markets and international carrier networks become least reliable.
Under the current conflict environment, sovereignty therefore resides in the combined control of vessels, routes, crews, containers, terminals, insurance, management, alliance access and emergency direction rights, rather than in the nationality of ships alone.
This scheme is an evidence-based dependency architecture rather than a probability model, risk score or forecast. No numerical risk index has been assigned because the verified public record does not support defensible weighting of the individual variables.
Israel State Comptroller — The Sea Ports Sector in Israel and Operational and Service Aspects at Ashdod Port
ZIM — ZIM to be Acquired by Hapag-Lloyd for $35.00 per Share in Cash
International Maritime Organization — Stop attacking merchant ships and seafarers
International Maritime Organization — Red Sea Area
International Maritime Organization — IMO condemns attacks on civilian merchant vessels in the Sea of Azov and the Black Sea
U.S. Energy Information Administration — Short-Term Energy Outlook — Energy Security Analysis
Hapag-Lloyd — Company Profile and Shareholder Structure
Hapag-Lloyd — Facts & Figures
Maritime Sovereignty, ZIM and the Architecture of Emergency Control
Principal Judgment
The decisive issue in the proposed restructuring of ZIM is not whether a minimum number of vessels remain under an Israeli corporate perimeter, but whether the Israeli state retains a complete and enforceable emergency-control chain extending from legal authority to physical tonnage, crews, technical management, containers, strategic routes, terminal access, network slots, information rights and the capacity to override ordinary commercial incentives during a national emergency. The transaction documents filed with the U.S. Securities and Exchange Commission establish that this distinction is already embedded in the legal architecture of the deal: the February merger framework does not simply transfer a collection of ships to FIMI, but requires the qualifying Israeli partner to receive at least 11 qualifying vessels together with whatever additional assets, employees and services are necessary to assume the Special State Share obligations, while the Israeli state must accept the resulting assumption instrument before completion. ZIM Proxy Statement — SEC — Mar 2026 SEC
That wording is more important than the headline figure of 16 vessels because it implicitly recognises that a shipping company is not sovereign maritime capacity merely because vessels appear on its balance sheet. ZIM entered 2026 operating 128 vessels, but only 16 were owned directly and 112 were chartered, while its container fleet consisted of approximately 598,000 physical container units representing 1.067 million TEU, of which only 41% were owned and 59% leased; those figures demonstrate the scale of the operational ecosystem that must be separated from the much smaller “New ZIM” perimeter if the carve-out is to function as an independent Israeli carrier rather than as an asset shell dependent on Hapag-Lloyd for critical functions. ZIM 2025 Annual Report — SEC — Mar 2026 SEC
The revised proposal disclosed by Hapag-Lloyd on 28 September moves in the strategically relevant direction because the company now states that the Israeli structure would receive a route to Asia, a new modern fleet, investment in Israeli maritime personnel, retention of shipping expertise in Israel, stronger Golden Share protections and safeguards designed to prevent foreign interference in the movement of sensitive Israeli cargo; however, these remain company representations regarding an evolving proposal rather than a publicly available definitive revised agreement accepted by the State of Israel, and the analytical question is therefore not whether the additions sound sufficient but whether their eventual legal drafting converts them into enforceable operational capabilities. Hapag-Lloyd — Statements and Updates — reviewed 28 Sep 2026 Hapag-Lloyd
The Golden Share Is a Control System, Not Simply a Government Veto
The Special State Share historically imposed a substantially broader set of obligations than a conventional corporate “golden share” used only to prevent hostile foreign acquisition, because the disclosed terms require ZIM to remain incorporated and headquartered in Israel, maintain a minimum fleet of 11 seaworthy wholly owned vessels, ensure that at least three of those vessels are capable of carrying general cargo, maintain an Israeli majority on the board including an Israeli chairperson, retain an Israeli chief executive officer, and obtain state consent for transactions conferring 35% or more of the company’s issued share capital or control over the company. The state also possesses consent rights over winding-up, mergers and spin-offs and information rights extending beyond ordinary shareholder disclosure to material required to safeguard Israel’s vital interests. ZIM Proxy Statement — SEC — Mar 2026 SEC
The significance of those provisions is that the Israeli state historically protected several different layers simultaneously: corporate domicile, governance nationality, minimum physical assets, ownership concentration, structural transactions and privileged information access. That architecture is substantially more sophisticated than a simple minimum-vessel rule, because an emergency shipping capability can be degraded without selling a single ship if management migrates abroad, route planning is integrated into a foreign network, technical expertise disappears, key personnel are replaced, commercial information becomes inaccessible or the state cannot obtain sufficiently granular operational data to determine whether nominal compliance translates into usable capacity. The existing Golden Share architecture therefore provides a useful analytical baseline against which the revised proposal should be tested. ZIM Proxy Statement — SEC — Mar 2026 SEC
Special State Share — Existing Control Architecture
| Control domain | Existing disclosed requirement | Strategic function | Vulnerability if interpreted narrowly |
|---|---|---|---|
| Corporate domicile | ZIM must remain incorporated, registered and headquartered in Israel | Keeps the protected entity within Israeli legal and administrative jurisdiction | Domicile alone does not guarantee operational autonomy |
| Minimum fleet | At least 11 wholly owned seaworthy vessels | Creates a physical asset floor that cannot disappear through short-term charter withdrawal | Vessel number says nothing about size, route suitability, crew availability or containers |
| Cargo capability | At least three qualifying vessels must be capable of carrying general cargo | Preserves minimum diversified national lift capability | Qualification may not correspond to the cargo mix required during a modern emergency |
| Board control | Israeli majority, including the chair | Preserves domestic governance influence | Board nationality does not necessarily control day-to-day network deployment |
| CEO | Israeli citizen | Anchors senior executive responsibility in Israel | Executive nationality does not replace contractual rights over network partners |
| Change of control | State consent for certain transfers or issuances producing ≥35% ownership/control | Limits transfer of strategic corporate control | Does not automatically address upstream dependence on foreign network infrastructure |
| Structural transactions | State consent for merger, winding-up or spin-off | Prevents strategic asset restructuring without government involvement | Effectiveness depends on how the protected asset perimeter itself is defined |
| Information rights | Operational, financial and compliance information available to the state | Enables monitoring of strategic obligations | Information must be sufficiently timely and operationally granular to matter in a crisis |
| Amendment protection | State approval required for amendment, review or cancellation of protected rights | Prevents unilateral erosion of sovereign safeguards | Protection is only as strong as the rights embedded in the post-merger instrument |
Source: ZIM Proxy Statement — SEC — Mar 2026. SEC
The central implication is that the State of Israel already possesses the conceptual foundation for a modern maritime-resilience regime, but the proposed separation of the protected Israeli carrier from ZIM’s much larger global business creates a new problem: the Golden Share would move from a globally integrated liner company to a deliberately narrower company whose ability to satisfy national requirements may depend much more heavily on contractual access to assets owned, managed or scheduled outside that protected perimeter. That transition changes the nature of sovereignty from direct control over a large integrated company to a mixture of direct asset ownership and enforceable access rights, and the second category therefore requires as much scrutiny as the first. Hapag-Lloyd — ZIM Transaction Investor Presentation — Feb 2026 Hapag-Lloyd
The Transaction Creates Two Economically Different ZIM Successors
The February transaction architecture expressly divides the present ZIM business into two streams rather than preserving the existing company as a substantially intact Israeli liner under new ownership. The majority of ZIM’s container business and its car-carrier activities are intended to be combined with Hapag-Lloyd, while FIMI would establish a separate Israeli liner carrying the ZIM brand and assuming the Special State Share obligations; Hapag-Lloyd’s investor materials describe New ZIM as an independent container network operator and liner-service provider, while simultaneously envisaging commercial interdependence through slot-charter arrangements and access to the larger Hapag-Lloyd network. Hapag-Lloyd — ZIM Transaction Investor Presentation — Feb 2026 Hapag-Lloyd
This distinction matters because “independent company” and “independent operating capability” are not equivalent concepts. An Israeli company can remain legally independent while depending operationally on another carrier for slots, transshipment, container interchange, terminal windows, information systems, feeder connectivity, alliance schedules or commercial support, just as a foreign-owned carrier can in principle provide highly reliable emergency services if those services are protected through sufficiently specific and enforceable obligations. The proper test is therefore functional rather than nominal: which functions remain inside New ZIM, which are purchased from Hapag-Lloyd, which depend on Gemini or other third parties, which can be substituted in an emergency, and which become single points of failure. Hapag-Lloyd — ZIM Transaction Investor Presentation — Feb 2026 Hapag-Lloyd
Post-Transaction Functional Perimeter
| Capability | Current ZIM baseline | Proposed New ZIM perimeter | Hapag-Lloyd/global perimeter | Strategic question |
|---|---|---|---|---|
| Vessel ownership | 16 owned vessels within a 128-vessel operated fleet at end-2025 | At least 11 qualifying vessels required legally; February public plan states 16 vessels | Remaining acquired ZIM fleet and wider Hapag-Lloyd fleet | Which exact hulls, capacities and technical classes enter New ZIM? |
| Chartering | 112 chartered vessels at end-2025 | Public record does not yet define full post-close charter portfolio | Large chartered/owned carrier network | Can New ZIM independently augment capacity under emergency conditions? |
| Container equipment | 598,000 units / 1.067m TEU current ZIM pool | Publicly disclosed transferred quantity not yet established | Hapag-Lloyd operates a much larger container pool | How much dry, reefer and specialised equipment becomes sovereignly available? |
| Trade network | Pacific, Cross-Suez, Atlantic, Intra-Asia, Latin America and additional routes | Focused Israel-linked network | Majority of global ZIM business integrated with Hapag-Lloyd | Does the Israeli carrier preserve direct strategic destination coverage or depend on transshipment? |
| Brand | ZIM | ZIM brand transferred to New ZIM | Hapag-Lloyd absorbs majority business | Brand continuity does not establish operational continuity |
| Gemini access | ZIM not originally a Gemini operating partner | Access promised under February structure | Hapag-Lloyd/Maersk network | Are access rights irrevocable during an emergency? |
| Slot capacity | Managed within wider ZIM network | New ZIM to interact commercially with Hapag-Lloyd | Hapag-Lloyd expected to slot-charter on dedicated New ZIM vessels | Who receives priority when capacity becomes scarce? |
| Personnel | Global ZIM organisation | Necessary employees and services to support Golden Share obligations must be transferred/arranged | Remaining personnel incorporated within Hapag-Lloyd structure | Which operational disciplines remain physically in Israel? |
| Technical management | Mixed owned/chartered model | Revised proposal says Israeli expertise will be retained | Hapag-Lloyd/global network services | Does Israel retain independent voyage, fleet and crisis-management competence? |
Sources: ZIM 2025 Annual Report — SEC, ZIM Proxy Statement — SEC, Hapag-Lloyd ZIM Investor Presentation. SEC
Sixteen Vessels Cannot Be Evaluated Without Knowing Which Sixteen
The February announcement repeatedly describes New ZIM as beginning with 16 modern, sizeable and efficient vessels, but the public transaction materials examined do not disclose a complete vessel-by-vessel schedule specifying name, nominal TEU capacity, age, ownership structure, propulsion system, reefer capacity, flag, current employment, maintenance status and intended post-close service. That absence is not a minor technical detail, because sixteen ships of 2,500 TEU and sixteen ships of 10,000 TEU represent radically different lift capacity, route economics, port compatibility and emergency utility, while a fleet assembled around vessels optimised for Mediterranean or Atlantic deployment cannot automatically reproduce the capacity required for a weekly Asia service. Hapag-Lloyd — Hapag-Lloyd signs merger agreement with ZIM — Feb 2026 Hapag-Lloyd
The comparison with ZIM’s current fleet illustrates the scale of this uncertainty. At 31 December 2025, ZIM operated 115 containerships and 13 vehicle carriers, with the containership fleet providing approximately 708,543 TEU of nominal capacity; the company directly owned 16 containerships totalling 96,080 TEU, while chartered containerships provided 612,463 TEU, meaning that almost seven-eighths of the vessels and more than 86% of TEU capacity were externally chartered. ZIM subsequently reported that, as of 1 March 2026, 86.9% of chartered-in vessels by vessel count and 92.4% by TEU capacity had remaining charter duration longer than one year, illustrating the extent to which modern liner capability rests on long-duration contractual control rather than balance-sheet ownership alone. ZIM 2025 Annual Report — SEC — Mar 2026 SEC
Current Fleet Structure Versus the Proposed Sovereign Perimeter
| Metric | ZIM at 31 Dec 2025 | Proposed New ZIM | Analytical significance |
|---|---|---|---|
| Total operated vessels | 128 | 16 announced | New ZIM would operate at a radically smaller fleet scale |
| Container vessels | 115 | Publicly described fleet of 16 vessels | Exact mix remains material |
| Vehicle carriers | 13 | No comparable public New ZIM allocation established | Strategic vehicle/RO-RO capability requires separate assessment |
| Owned vessels | 16 | At least 11 qualifying vessels legally required; 16-vessel operating plan announced | The legal minimum and commercial plan are different concepts |
| Chartered vessels | 112 | Not fully disclosed | Emergency scalability depends on chartering rights and market access |
| Total container-vessel capacity | 708,543 TEU | Not publicly specified vessel-by-vessel | Vessel count alone cannot measure lift capacity |
| Owned-vessel capacity | 96,080 TEU | Not publicly specified | The selected hulls determine sovereign capacity |
| Chartered capacity | 612,463 TEU | Not disclosed | Demonstrates current dependence on contractual tonnage |
| Average ZIM containership size | About 6,086 TEU | Not disclosed | A simple 16 × average calculation would be analytically invalid without knowing selected vessels |
Source: ZIM 2025 Annual Report — SEC — Mar 2026. SEC
The precise hull-selection question becomes even more important because ZIM has deliberately developed a heterogeneous fleet. Its current portfolio includes ten long-term-chartered 15,000 TEU LNG dual-fuel vessels, eighteen approximately 8,000 TEU LNG dual-fuel vessels, and contracts for ten new 11,500 TEU LNG dual-fuel vessels scheduled for delivery during 2027–2028; those ships are not interchangeable operationally with small regional vessels, and the public transaction record has not yet established which long-term charter arrangements or future deliveries, if any, belong inside the Israeli strategic perimeter. ZIM 2025 Annual Report — SEC — Mar 2026 SEC
Container Sovereignty Is as Important as Vessel Sovereignty
The proposed structure cannot be assessed solely through vessel ownership because liner shipping is a container system before it is merely a ship system. ZIM held approximately 598,000 container units corresponding to 1.067 million TEU at the end of 2025, with 41% owned and 59% leased, and the company specifically identifies empty-container repositioning as a central fleet-management function because equipment must be available at the correct origin before a vessel can actually carry cargo. ZIM 2025 Annual Report — SEC — Mar 2026 SEC
This becomes particularly important during emergencies because a vessel can arrive at Haifa or Ashdod with nominal slots available while Israeli exporters lack the appropriate empty equipment, or importers can face bottlenecks because refrigerated or specialised containers remain stranded at foreign ports. ZIM has also invested specifically in reefer equipment and the ZIMonitor system for pharmaceuticals, food and sensitive electronics, meaning that strategic resilience requires more than ordinary dry-container availability; a credible New ZIM architecture should therefore define not simply a transferred equipment quantity but minimum operational pools by container type, maintenance responsibility, geographic distribution and emergency repositioning rights. ZIM 2025 Annual Report — SEC — Mar 2026 SEC
Container-Control Questions That Remain Material
| Equipment issue | Current disclosed ZIM position | Required sovereign-control test |
|---|---|---|
| Total equipment | Approx. 598,000 units / 1.067m TEU | Exact equipment pool transferred to New ZIM |
| Ownership | 41% owned | Which owned boxes remain inside the protected perimeter |
| Leasing | 59% leased | Whether lessor termination rights could reduce emergency availability |
| Reefer capability | Dedicated reefer fleet and ZIMonitor monitoring capability | Minimum reefer allocation retained for food, pharmaceuticals and sensitive cargo |
| Repositioning | ZIM actively manages empty-equipment positioning | Whether New ZIM controls repositioning independently or relies on Hapag-Lloyd systems |
| Repair and maintenance | Operationally essential but not independently quantified in carve-out disclosure | Domestic and foreign depot access under emergency conditions |
| Digital monitoring | ZIMonitor supports high-value and temperature-sensitive cargo | Ownership/licensing and continuity of the underlying technology after separation |
Source: ZIM 2025 Annual Report — SEC — Mar 2026. SEC
The Asia Route Changes the Strategic Geometry, but Frequency Is Not Enough
Hapag-Lloyd’s 28 September statement confirms that the revised proposal now includes a route to Asia and says the arrangement would secure access to key shipping routes including Asian routes, directly addressing one of the most important limitations in the February public architecture. Hapag-Lloyd — Statements and Updates — reviewed 28 Sep 2026 Hapag-Lloyd
The strategic value of this addition depends upon the exact service design. A weekly direct service requires more than a political commitment to call at an Israeli and Asian port because liner schedules are rotational systems in which the number of vessels required is determined by round-trip duration, port sequence, transit route and schedule-recovery margins; when Red Sea transit is unavailable and services must route around the Cape of Good Hope, a weekly frequency can consume significantly more vessels and vessel-days than the same service operating through Suez. Hapag-Lloyd itself stated on 28 September that most of its overall network was still routing around the Cape, with only six Gemini services then using the Red Sea and Suez, while each transit remained subject to individual security review and naval-protection arrangements. Hapag-Lloyd — Statements and Updates — reviewed 28 Sep 2026 Hapag-Lloyd
Accordingly, the meaningful contractual test is not simply whether New ZIM operates “one weekly Asia route” but whether the company possesses enough vessels, slots or replacement capacity to preserve that weekly frequency under both Suez and Cape configurations. The same requirement extends to schedule recovery after port omissions, terminal closure, weather disruption and dry-docking because a nominal weekly service that repeatedly skips Israel during severe disruption does not provide the same strategic utility as a service supported by minimum frequency, capacity and restoration obligations.
Route Guarantee — Minimum Terms Required for Decision-Grade Evaluation
| Variable | Why it matters | Public status as of 29 Sep 2026 |
|---|---|---|
| Asian origin/destination ports | Determines access to actual manufacturing and supplier clusters | Not fully specified publicly |
| Israeli port calls | Haifa/Ashdod allocation changes national redundancy | Not fully specified |
| Weekly frequency | Establishes nominal schedule | Announced conceptually |
| Minimum TEU allocation | Prevents nominal service with commercially inadequate capacity | Not publicly established |
| Reefer allocation | Critical for food/pharmaceutical supply | Not publicly established |
| Route under Suez closure | Determines whether service survives renewed Red Sea disruption | Not publicly established |
| Cape contingency tonnage | Longer rotation requires additional vessel capacity | Not publicly established |
| Port-omission rules | Determines whether Israel can be skipped during disruption | Not publicly established |
| Force majeure | Defines when operator may legally suspend commitment | Revised operative language not public |
| Restoration time | Determines how rapidly service must resume | Not public |
| State priority cargo | Determines whether essential goods displace ordinary commercial cargo | Not public |
| Penalties/remedies | Determines whether route commitment is enforceable | Not public |
The absence of these details does not demonstrate that the revised proposal lacks them; it means only that the present public record does not yet establish them, which is precisely why the final revised instrument rather than the announced route should determine the state’s substantive assessment.
Gemini Access Is an Asset, but It Also Creates a Dependency
The February transaction framework promises New ZIM access to Hapag-Lloyd’s wider network and specifically to the Gemini Cooperation, while Hapag-Lloyd’s transaction presentation envisages commercial interactions including slot-charter arrangements between Hapag-Lloyd and the Israeli carrier. ZIM — Acquisition Announcement — Feb 2026 Hapag-Lloyd — ZIM Transaction Investor Presentation — Feb 2026 SEC
The economic logic is powerful because New ZIM cannot reproduce the geographic coverage of a 400-plus-vessel combined Hapag-Lloyd/ZIM network using 16 vessels, and therefore alliance connectivity can provide a far larger virtual network than sovereignly owned tonnage alone. Hapag-Lloyd currently operates approximately 300 containerships and 129 services, including 28 intra-Asia services, eight Asia–Europe services, 12 Middle East services, 18 Latin American services, 15 Europe–Americas services and 13 Asia/Oceania–Americas services, demonstrating the scale of connectivity that New ZIM could access through commercial integration without having to own or operate hundreds of ships. Hapag-Lloyd — Company Profile — Jun 2026 Hapag-Lloyd
Yet network access also becomes a potential sovereignty gap if the right is commercial rather than irrevocable, because a slot agreement can theoretically be renegotiated, capacity can become scarce, security decisions can alter a hub rotation, a partner can suspend a port call, and network optimisation can conflict with an Israeli requirement to maintain an uneconomic emergency service. The critical legal questions are consequently whether New ZIM’s Gemini access is guaranteed for a defined term, whether access survives deterioration in diplomatic or security conditions, whether capacity floors exist, whether termination can occur during an Israeli emergency, whether service can be substituted unilaterally with transshipment and which party bears the incremental cost of extraordinary routings.
Emergency Control Requires a Hierarchy of Rights
The transaction documents provide a crucial starting point because Hapag-Lloyd and FIMI agreed to use reasonable best efforts to achieve the Special State Share assumption, and Hapag-Lloyd is required to transfer at least 11 qualifying vessels while providing or arranging other assets, employees and services necessary for the Israeli partner to comply with the Golden Share obligations. However, the merger agreement also contains limits on what Hapag-Lloyd can be compelled to accept: the parent is not required to agree to measures that would materially adversely affect the combined business, materially impair its freedom of action over ZIM, require it to invest equity in the Israeli partner, or leave Hapag-Lloyd itself subject to Golden Share rights or obligations. ZIM Proxy Statement — SEC — Mar 2026 SEC
This creates an analytically important boundary between the sovereign Israeli perimeter and the international parent: Israel can impose conditions on the structure it approves, but the February merger agreement already defines categories of burden that Hapag-Lloyd need not accept as part of the existing transaction obligation. The final revised framework therefore has to resolve the tension between an Israeli desire for robust emergency direction powers and Hapag-Lloyd’s legitimate requirement not to turn the global parent into a permanently state-directed instrument.
Emergency-Control Hierarchy
| Level | Right required | Why it is materially different from the previous level |
|---|---|---|
| Monitoring | State receives operational information | Awareness does not compel action |
| Consultation | State can require discussions during emergency | Carrier retains ultimate discretion |
| Priority request | State can request priority lift | Compliance may remain commercial |
| Contractual priority | Essential cargo receives predefined priority | Creates enforceable commercial hierarchy |
| Route-maintenance obligation | Carrier must preserve specified services | Protects network availability rather than only cargo booking |
| Vessel-direction right | State can direct qualifying vessels within defined circumstances | Moves from commercial obligation toward sovereign operational control |
| Requisition/compulsion | State can legally compel specific maritime assets or services | Highest-control mechanism, requiring exact legal authority and compensation framework |
| Replacement-capacity obligation | Carrier must source substitute tonnage if designated vessel unavailable | Prevents nominal compliance from failing through casualty, maintenance or detention |
The public record currently establishes several layers of Golden Share governance and asset requirements, but it does not yet establish that the revised proposal contains every layer in this hierarchy; any claim that the new structure delivers complete emergency sovereignty would therefore be premature until the definitive assumption agreement and revised commitments are available.
Labour Protection and Maritime Expertise Are Strategic Capabilities, Not Social Side Clauses
Employment negotiations were not peripheral to the merger process. The SEC proxy shows that employee and labour issues remained among the principal unresolved points during the final negotiation phase and that, on 11–12 February, the ZIM chairman negotiated directly with Hapag-Lloyd’s CEO and CFO for a longer post-closing undertaking concerning continued employment and employee benefits, after which the issue was considered resolved for purposes of signing the merger agreement. ZIM Proxy Statement — SEC — Mar 2026 SEC
The revised September statement goes further by presenting investment in Israeli maritime personnel and retention of shipping expertise in Israel as part of the national-security response, which is analytically correct because maritime sovereignty depends upon human capital that cannot be regenerated immediately after a crisis begins. Voyage planning, chartering, stowage, dangerous-goods management, reefer operations, bunker procurement, crew management, port operations, equipment control, sanctions screening, insurance, security assessment and casualty response are specialised functions whose loss would reduce the practical value of the domestic vessel fleet even if legal ownership remained unchanged. Hapag-Lloyd — Statements and Updates — reviewed 28 Sep 2026 Hapag-Lloyd
The relevant test should consequently distinguish generic employment from strategic maritime competence. A commitment to retain a certain number of employees would not necessarily preserve sovereign operational capacity if high-value decision functions were centralised abroad, whereas a smaller workforce retaining fleet deployment, network planning, dangerous cargo, security, technical management and emergency operations could provide greater strategic autonomy.
Human-Capital Functions Requiring Explicit Continuity
| Function | Strategic relevance | Critical continuity question |
|---|---|---|
| Fleet deployment | Determines where vessels actually sail | Is deployment authority located in Israel during emergencies? |
| Chartering | Allows capacity to expand beyond owned vessels | Can New ZIM independently charter replacement tonnage? |
| Operations control | Manages schedule, port rotation and exceptions | Is there a 24/7 Israeli operational-control capability? |
| Technical management | Maintains class, certification, repair and seaworthiness | Which entity controls the technical managers of qualifying vessels? |
| Crewing | Determines whether ships can sail | Does New ZIM maintain independent crew sourcing and relief capability? |
| Security | Determines route acceptance in war-risk environments | Who has final authority over route security decisions? |
| Container management | Allocates and repositions physical equipment | Does New ZIM own/control sufficient equipment-management infrastructure? |
| Reefer management | Supports food and pharmaceutical cargo | Are Israeli teams and systems retained? |
| Network planning | Determines connections beyond direct services | How dependent is New ZIM on Hapag-Lloyd/Gemini planning? |
| Insurance | Determines whether emergency voyages remain commercially and legally operable | Can coverage be maintained or replaced independently? |
| Legal/compliance | Sanctions, customs and cargo acceptance | Can New ZIM continue independently if parent systems become unavailable? |
| Crisis command | Integrates all functions under emergency conditions | Is the command structure defined before the emergency occurs? |
Ownership of Hapag-Lloyd Requires Precision Rather Than Political Inference
Hapag-Lloyd’s shareholder structure as of 30 June 2026 comprised CSAV at 30%, Klaus-Michael Kühne interests at 30%, the City of Hamburg’s HGV at 13.9%, Qatar Investment Authority at 12.3%, Saudi Arabia’s Public Investment Fund at 10.2%, and a 3.6% free float. These holdings are relevant to the governance analysis because the buyer is not owned by a single German private shareholder or by the German state, but the percentages should not be converted into an unsupported assertion that Qatar or Saudi Arabia can direct Hapag-Lloyd’s Israeli policy, since minority equity ownership does not by itself establish operational command, unilateral veto rights or day-to-day influence over vessel deployment. Hapag-Lloyd — Company Profile — Jun 2026 Hapag-Lloyd — Annual Report 2025 Hapag-Lloyd
The appropriate sovereign safeguard is therefore structural rather than political: Israel should not need to predict the future intentions of any Hapag-Lloyd shareholder if the New ZIM architecture legally prevents foreign shareholders, future buyers or corporate restructurings from interfering with protected Israeli emergency transport. Hapag-Lloyd now explicitly states that the revised proposal would prevent foreign interference in the transportation of Israel’s sensitive cargo, making the exact definition of “foreign interference,” “sensitive cargo,” control rights, information barriers, appointment powers and enforcement remedies among the most important provisions still requiring public-document verification. Hapag-Lloyd — Statements and Updates — reviewed 28 Sep 2026 Hapag-Lloyd
The Revised Proposal Must Be Tested Against Failure Conditions, Not Normal Operations
An emergency-resilience architecture is poorly evaluated by asking whether it functions when ports are open, commercial insurance is available, crews are willing, Suez is safe and charter capacity can be obtained at ordinary market prices. The relevant stress test is whether the architecture continues to function when several of those assumptions fail simultaneously, because it is precisely in those conditions that the Golden Share acquires strategic value.
Hapag-Lloyd’s current operational disclosures provide a concrete illustration: the company states that its Middle East crisis response generated approximately $600 million of additional costs, primarily from higher oil prices but also from land bridges, insurance and storage for containers that became stranded, while only part of its network had resumed Red Sea transits by late September and the majority continued via the Cape of Good Hope. Those facts show that emergency continuity is an expensive operational activity involving more than ships, and they reinforce the need to determine contractually who pays for extraordinary costs when New ZIM is required to preserve a service for sovereign reasons. Hapag-Lloyd — Statements and Updates — reviewed 28 Sep 2026 Hapag-Lloyd
Emergency Stress-Test Matrix
| Failure condition | Normal commercial response | Sovereign requirement | Publicly established protection |
|---|---|---|---|
| Suez/Red Sea temporarily unsafe | Reroute via Cape or suspend service | Preserve Israel–Asia connectivity | Asia route announced; contingency structure not yet public |
| War-risk premium surges | Reprice, omit or suspend | Maintain essential lift | Revised protection claimed; allocation mechanism not public |
| Crew refuses high-risk call | Replace crew or omit voyage | Ensure minimum manning continuity | No detailed public guarantee located |
| Israeli terminal temporarily restricted | Shift cargo to other ports/transshipment | Preserve national access where feasible | Not fully specified |
| Strategic container shortage | Prioritise highest commercial return | Reserve equipment for essential Israeli cargo | Not publicly specified |
| Charter market becomes tight | Compete at market prices | Secure replacement capacity | Not publicly specified |
| Gemini alters network | Re-optimise hub structure | Preserve agreed Israeli destinations | Access announced; emergency permanence not public |
| Owned vessel casualty/drydock | Substitute if commercially justified | Maintain minimum strategic tonnage | Replacement obligation not publicly established |
| Cyber/system outage | Corporate contingency process | Independent Israeli operating capability | Not publicly established |
| Foreign shareholder/governance dispute | Corporate-law resolution | No interference with sensitive Israeli cargo | Revised proposal says protection will be added; definitive terms not public |
| Severe cost escalation | Recover through rates/surcharges | Prevent abandonment of sovereign route | Cost-allocation mechanism not public |
A 16-Vessel Carrier Requires Network Rights That Are Legally Stronger Than Ordinary Commercial Agreements
The scale comparison is unavoidable. Hapag-Lloyd currently reports approximately 300 vessels, 129 liner services and customer coverage across 396 locations, while New ZIM is designed around a 16-vessel starting fleet; therefore, even a well-equipped Israeli carrier will necessarily depend upon third-party or partner connectivity for much of the world unless Israel chooses to finance a significantly larger sovereign fleet. Hapag-Lloyd — Company Profile — Jun 2026 Hapag-Lloyd
This dependence is not intrinsically a weakness because liner shipping has historically operated through slot exchanges, vessel-sharing arrangements, feeder networks and alliance structures that allow carriers to sell a broader network than they physically operate. The sovereignty issue arises only where the external network connection lacks sufficient durability, because the state would then protect the first maritime leg while leaving the second or third leg subject to commercial discretion.
A credible New ZIM model therefore requires a distinction between sovereign core lanes and commercial extended connectivity. Core lanes should be defined by the state’s assessment of essential geographic access and protected through enforceable minimum capacity; extended destinations can continue to rely on commercial network arrangements because requiring direct sovereign services to hundreds of ports would destroy the economic logic of the carve-out.
Illustrative Control Architecture for a Sustainable Israeli Carrier
| Layer | Function | Control standard required |
|---|---|---|
| Sovereign core | Israeli port access | Direct state-protected obligation |
| Sovereign core | Minimum owned vessel fleet | Full Israeli ownership and Golden Share protection |
| Sovereign core | Israel–Asia connection | Minimum frequency and capacity protected contractually |
| Sovereign core | Israel–Europe connection | Direct or tightly protected service |
| Sovereign core | Israel–North America connection | Defined minimum capacity |
| Strategic support | Containers/reefers | Minimum equipment pools controlled or contractually reserved |
| Strategic support | Crews | Continuity and replacement mechanisms |
| Strategic support | Technical management | Israeli-resident expertise for qualifying fleet |
| Network extension | Gemini slots | Long-duration guaranteed access with emergency protections |
| Network extension | Feeders/transshipment | Multiple alternatives rather than single-point dependence |
| Commercial layer | Non-strategic destinations | Ordinary market optimisation |
| State oversight | Information and audit | Real-time operational visibility plus compliance verification |
| Crisis layer | Emergency command | Pre-agreed trigger, authority, cost and compensation mechanism |
This architecture does not imply that every function must be domestically owned, because commercial interdependence can increase resilience through diversification and scale; it implies instead that every externally provided function essential to the sovereign core must have a sufficiently robust substitute or enforceable guarantee.
The February Merger Agreement Already Reveals Where Negotiations Became Difficult
The transaction chronology provides unusually useful evidence of what both sides considered material. In January 2026, the original proposed Israeli-partner structure was unacceptable to ZIM’s board because it was limited to ten years and did not provide a durable solution for the Special State Share beyond that period; ZIM’s board therefore rejected that architecture as creating excessive transaction uncertainty. Hapag-Lloyd subsequently introduced FIMI as the Israeli partner on 4 February and proposed a structure without a ten-year limit that aimed to preserve the Special State Share rights permanently, initially contemplating at least 12 vessels and selected ZIM routes before the final public structure was presented as a 16-vessel business. ZIM Proxy Statement — SEC — Mar 2026 SEC
This negotiation history demonstrates that duration itself is a national-security variable. A route guarantee, management commitment or network-access contract that expires after a decade can create a future cliff in sovereign capability even if the first years of operation are excellent, because rebuilding a national carrier after expertise, customer relationships, systems and ships have migrated elsewhere would be materially more difficult than preserving those capabilities continuously.
The revised proposal should therefore be evaluated not only for the breadth of its protections but for their duration, transferability and survival after corporate change, including whether commitments continue after a future sale of Hapag-Lloyd, change in Gemini structure, transfer of FIMI’s interest, insolvency of New ZIM, technological restructuring or termination of particular network services.
Approval Architecture Gives Israel Multiple Distinct Legal Entry Points
The merger is not dependent upon a single Israeli decision. The SEC proxy states that closing requires approval under the Special State Share, Israeli competition approval and Ministry of Defense approval arising from ZIM’s contractual relationships with the ministry, alongside regulatory processes in approximately 40 other jurisdictions. ZIM Proxy Statement — SEC — Mar 2026 SEC
These approvals serve different purposes and should not be analytically collapsed. The Golden Share review concerns preservation of specific state-protected interests; competition review concerns market structure and competitive effects; Ministry of Defense approval can address implications arising from defence contractual relationships; and foreign regulators examine their own jurisdictional concerns. Approval by one authority therefore does not imply that another authority has determined the entire transaction to be strategically adequate.
The shareholder dimension is already resolved on the corporate side: ZIM shareholders approved the merger proposal on 30 April 2026 with 57,215,733 votes for, 1,546,951 against and 101,091 abstentions, corresponding to 97.36% of votes cast on the reported proposal, but shareholder approval does not substitute for Israeli state approval under the protected-share architecture. ZIM Voting Results — SEC — Apr 2026 SEC
The Strategic Question Is Not Foreign Ownership; It Is Whether Emergency Rights Survive Commercial Stress
A simplistic national-versus-foreign ownership distinction does not survive scrutiny. Current ZIM itself relies overwhelmingly on chartered tonnage and leased containers; conversely, Hapag-Lloyd possesses a far larger diversified network, extensive equipment resources and route flexibility that can materially strengthen Israeli connectivity if access to those capabilities is made durable. The security concern therefore cannot be reduced to the nationality of the ultimate corporate owner, just as domestic incorporation cannot automatically guarantee resilience. ZIM 2025 Annual Report — SEC Hapag-Lloyd — Company Profile SEC
The stronger model is one in which national ownership protects the irreducible sovereign core while international network integration multiplies reach, capacity and redundancy. That model only works, however, when the cross-border interface itself is protected from abrupt termination precisely when geopolitical risk increases, because otherwise Israel receives the economic efficiency of a global network in peacetime while carrying a substantial tail risk of fragmentation during war.
Decision-Critical Control Matrix
| Strategic control | Minimum evidence required before the revised framework can be judged | Current public status |
|---|---|---|
| Exact 16-vessel identity | Name, IMO number, TEU, age, ownership, flag, propulsion, reefer capability | Open |
| Owned versus chartered composition | Definitive asset-transfer schedule | Open |
| Asia service | Ports, frequency, capacity, route, fallback routing | Partially disclosed |
| Europe service | Minimum direct-service architecture | Partially disclosed |
| US connectivity | Minimum service and slot guarantees | Partially disclosed |
| Containers | Number/types transferred, owned/leased structure | Open |
| Reefer equipment | Minimum sovereignly available units and monitoring systems | Open |
| Technical management | Location, personnel and decision authority | Revised proposal says expertise remains in Israel; detail open |
| Crews | Manning structure and emergency replacement system | Open |
| Gemini access | Duration, capacity floor, termination restrictions | Access announced; operative terms not public |
| Hapag-Lloyd slot charter | Capacity rights and priority rules | Concept disclosed; detail open |
| Sensitive cargo | Legal definition and non-interference mechanism | Protection announced; definition open |
| State direction authority | Trigger and scope of emergency operational command | Existing Golden Share framework relevant; revised detail open |
| Replacement tonnage | Obligation when qualifying vessel unavailable | Open |
| War-risk cost allocation | Who finances extraordinary insurance and rerouting | Open |
| Force majeure | Circumstances permitting suspension of strategic routes | Open |
| Port-omission rules | Whether Israeli calls can be skipped unilaterally | Open |
| Change of control | Protection against future ownership changes in New ZIM/Hapag-Lloyd | Existing Golden Share gives some protection; revised structure open |
| Cyber/data sovereignty | Location/control of critical operating systems and data | Open |
| Duration | Whether route and network commitments are perpetual, long-term or finite | Golden Share framework intended as permanent; commercial-service duration not fully public |
Sources: ZIM Proxy Statement — SEC, Hapag-Lloyd ZIM Investor Presentation, Hapag-Lloyd Statements and Updates. SEC
Key Judgments
The February architecture is substantially more sophisticated than a simple transfer of 16 ships because the merger agreement requires the Israeli partner to assume the Special State Share obligations and contemplates transfer not only of qualifying vessels but of the assets, employees and services necessary to satisfy those obligations; nevertheless, the much narrower New ZIM perimeter necessarily creates stronger dependence on external network contracts than exists when those same functions sit inside a single global carrier. ZIM Proxy Statement — SEC SEC
The number 16 is not an adequate measure of maritime sovereignty because current ZIM’s operating capacity is generated through a combination of owned ships, overwhelmingly chartered ships, more than one million TEU of container equipment, specialist reefers, global commercial systems and multiple trade networks; without a vessel schedule and equipment-transfer schedule, the usable capacity of New ZIM cannot yet be derived reliably from public information. ZIM 2025 Annual Report — SEC SEC
The revised Asia route materially improves the concept because it addresses a geographic weakness in the original public February structure, but the decisive issue is whether the obligation survives adverse routing conditions, including renewed Red Sea avoidance and Cape diversion, rather than merely whether a weekly service exists during ordinary operations. Hapag-Lloyd — Statements and Updates — 28 Sep 2026 Hapag-Lloyd
Hapag-Lloyd’s much larger network can increase Israeli resilience rather than diminish it if New ZIM receives durable and protected access to slots, transshipment, containers, terminals and substitute capacity; the strategic vulnerability emerges only where those benefits remain discretionary commercial services that can be withdrawn, repriced or reconfigured during precisely the crisis in which Israel needs them most. Hapag-Lloyd — Company Profile Hapag-Lloyd — ZIM Transaction Investor Presentation Hapag-Lloyd
The strongest feature of the revised September proposal is therefore not the symbolic retention of the ZIM name but Hapag-Lloyd’s stated intention to preserve Israeli maritime expertise, create a direct Asian connection, strengthen Golden Share protections and prevent foreign interference in sensitive cargo movements; the principal limitation is that the complete revised contractual language has not yet been made public, meaning those claims should presently be treated as formal company commitments under negotiation rather than verified final legal protections. Hapag-Lloyd — Statements and Updates — 28 Sep 2026 Hapag-Lloyd
What Would Change the Assessment
Publication or official filing of the revised FIMI–Hapag-Lloyd framework would change the assessment materially if it demonstrates that New ZIM receives identifiable vessels of sufficient capacity, independently controlled equipment pools, a legally durable Asia service, protected Gemini access, minimum strategic-slot allocations, domestic fleet-management authority, enforceable emergency direction rights, substitute-tonnage obligations and restrictions preventing unilateral suspension of services for purely commercial reasons during an Israeli emergency.
Conversely, the assessment would weaken if the final structure demonstrates that the 16-vessel fleet consists primarily of capacity unsuitable for major east–west services, if key containers and reefer equipment remain outside the Israeli perimeter, if the Asia route can be suspended broadly under commercial force-majeure provisions, if Gemini access can be terminated without a protected transition period, or if technical and network-management functions migrate to Hapag-Lloyd to an extent that leaves New ZIM legally independent but operationally dependent.
Open Official Record
The decisive unresolved official record is therefore no longer the February merger agreement, which is publicly available, but the revised September implementation framework: the definitive FIMI agreement, revised Golden Share assumption instrument, asset-transfer schedules, vessel schedule, service agreements, slot-charter contracts, employee-transfer arrangements, technical-management agreements, container allocation schedules, emergency cargo provisions and any conditions imposed by the State of Israel in connection with its approval. Until those records become public, the architecture can be evaluated structurally, but the ultimate question of whether Israel receives genuine sovereign emergency lift capability cannot be closed on the documentary record presently available. ZIM Proxy Statement — SEC Hapag-Lloyd — Statements and Updates
War-Torn Chokepoints and the Transformation of Global Logistics
Principal Judgment
The transformation now underway in maritime logistics is more consequential than a temporary rise in freight rates because the principal effect of the Middle East and Russia–Ukraine conflicts is to alter the physical productivity of the world merchant fleet itself. When a vessel avoids the Red Sea, waits outside the Persian Gulf, diverts around the Cape of Good Hope, accepts a longer Black Sea security procedure, changes bunkering locations or loses access to a regional hub, the cargo may ultimately reach its destination, but it requires more vessel-days, more fuel, more containers, more inventory and more working capital to move the same physical quantity of goods. The economic shock therefore originates in warfare and maritime insecurity but propagates through the global economy by reducing the amount of transport service obtainable from each ship and each container during a given period. UN Trade and Development calculated that Red Sea diversions had increased container-ship ton-mile demand by approximately 12% by mid-2024, while the broader rerouting of global maritime trade subsequently drove ton-miles to grow approximately 6% in 2024, nearly three times the rate of maritime trade-volume growth. Review of Maritime Transport 2024 — UN Trade and Development Maritime trade under pressure — UN Trade and Development — Sep 2025 Conferenza sul Commercio e Sviluppo
The 2026 Middle East conflict has added a second mechanism that is potentially more disruptive than the earlier Red Sea diversion alone: danger around the Strait of Hormuz simultaneously affects shipping security, petroleum flows, bunker availability, refinery output, insurance treatment and the ability of vessels already inside the Gulf to leave, while the Red Sea remains only partially normalised and the Black Sea remains an active war-risk corridor. As of 24 September 2026, the IMO’s current incident register listed 85 confirmed maritime incidents in the Middle East theatre, compared with 46 confirmed attacks around Hormuz by 11 June and 70 attacks by 28 August, illustrating that the risk environment continued to deteriorate rather than resolving after the initial February shock. Middle East — Highlighted Confirmed Incidents — IMO Six months of uncertainty for seafarers in Strait of Hormuz — IMO — Aug 2026 Organizzazione Marittima Internazionale
The resulting system is therefore better understood as a global logistics tax imposed through distance, time, uncertainty and redundancy. Part of that tax appears visibly as war-risk surcharges or emergency freight charges; part appears as additional bunker consumption; part appears through charter rates and reduced fleet availability; and a much larger portion remains embedded inside corporate inventories, financing requirements, safety stocks, production buffers, missed rotations and the need to duplicate suppliers or distribution nodes.
The Maritime Crisis Has Evolved from a Single Detour into a Multi-Chokepoint System
The first phase of the disruption beginning in late 2023 was dominated by vessels avoiding the Bab el-Mandeb–Red Sea–Suez route. By June 2024, vessel carrying capacity entering the Gulf of Aden had declined by 76% relative to mid-December 2023, Suez Canal transits were down approximately 70%, while vessel-capacity arrivals around the Cape of Good Hope had risen approximately 89%. The changes differed substantially by ship segment: UNCTAD recorded reductions in Gulf of Aden arrivals of approximately 100% for gas carriers, 96% for car carriers, 92% for containerships, 64% for bulk carriers, 60% for product tankers and 50% for crude tankers, showing that the disruption did not affect all transport markets uniformly. Review of Maritime Transport 2024 — UN Trade and Development Conferenza sul Commercio e Sviluppo
By 2026, that original route shock had become part of a wider network problem. The IMO currently records 61 confirmed Red Sea incidents since 10 January 2024, while attacks resumed during 2026 and a projectile strike against the cargo vessel TIHAMAH off Al Mokha in August caused additional seafarer fatalities. At the same time, international shipping around Hormuz has faced repeated attacks, and the IMO reported in August that as many as 400 ships carrying approximately 6,000 seafarers had at some point been unable to depart the Persian Gulf safely since the conflict began. Red Sea Area — IMO Statement on deadly ship attack in the Red Sea — IMO — Aug 2026 Six months of uncertainty for seafarers in Strait of Hormuz — IMO Organizzazione Marittima Internazionale
The Black Sea constitutes a third active maritime-security zone rather than a resolved legacy of the initial Russian invasion. In July 2026 the IMO reported a renewed series of attacks against civilian merchant vessels in the Black Sea and Sea of Azov, while in September it launched, together with Ukraine and with financing from the United Kingdom, France and the European Union, a dedicated programme to strengthen the operation of Ukraine’s Special Maritime Corridor. IMO condemns attacks on civilian merchant vessels in the Sea of Azov and the Black Sea — Jul 2026 Ukraine enhances maritime safety and Special Maritime Corridor operations — IMO — Sep 2026 Organizzazione Marittima Internazionale
Chokepoint Stress Architecture
| Maritime theatre | Principal mechanism | Verified operational evidence | Primary logistics transmission |
|---|---|---|---|
| Strait of Hormuz | Direct attack risk, ship immobilisation, fuel disruption, refinery/export constraints | 85 confirmed incidents by 24 Sep 2026 in IMO Middle East register | Fuel availability, tanker availability, bunker cost, insurance, stranded vessels |
| Red Sea / Bab el-Mandeb | Missile/drone attack risk, piracy, route avoidance | 61 confirmed incidents since 10 Jan 2024 | Suez avoidance, Cape diversion, longer rotations, container imbalance |
| Suez Canal | Consequence of Red Sea risk rather than physical canal incapacity | Mid-2024 Suez traffic approximately 70% below late-2023 benchmark; recovery emerging before renewed 2026 shocks | Asia–Europe transit time, fleet utilisation, Egyptian canal revenues |
| Cape of Good Hope | Principal substitute for Red Sea/Suez | Capacity arrivals increased approximately 89% during initial diversion period | More nautical miles, bunker use, ship-days and African port calls |
| Black Sea | War-risk navigation, attacks on civilian shipping, protected corridor requirements | Special Maritime Corridor remains operational under wartime protection | Grain, agricultural commodities, metals, regional vessel/insurance demand |
| Sea of Azov | Direct conflict-zone exposure | Renewed merchant-vessel attacks reported July 2026 | Localised removal of commercial tonnage and higher operating risk |
Sources: IMO Middle East incident register, IMO Red Sea incident register, UNCTAD Review of Maritime Transport 2024, IMO Black Sea statement. Organizzazione Marittima Internazionale
Rerouting Creates a Hidden Reduction in Global Fleet Capacity
The central economic characteristic of maritime rerouting is that physical fleet size remains unchanged while effective fleet capacity falls. A containership performing a Shenzhen–Rotterdam voyage through Suez travels approximately 10,000 nautical miles and requires about 31 days, whereas routing around the Cape of Good Hope increases the route to approximately 13,000 nautical miles and 41 days, according to UNCTAD’s documented route comparison. That represents approximately 3,000 additional nautical miles, a 30% increase in distance and roughly a 32% increase in transit time for the illustrative voyage. Review of Maritime Transport 2024 — UN Trade and Development Conferenza sul Commercio e Sviluppo
The consequences become clearer at network level. If a weekly service requires a fixed departure every seven days, extending the complete service rotation eventually requires either additional ships or reduced schedule frequency. UNCTAD provided an illustrative India–Europe example in which a 56-day rotation can be supported by eight ships, while extending the rotation to 63 days requires a ninth vessel to preserve weekly frequency. In that example, only seven additional days create a 12.5% increase in the number of vessels needed to produce the same weekly service. Red Sea Crisis and implications for trade facilitation in Africa — UN Trade and Development Conferenza sul Commercio e Sviluppo
This mechanism explains why freight markets can tighten without a corresponding increase in cargo volume. Longer voyages absorb ships that would otherwise be available for additional sailings, while longer container round trips similarly keep boxes occupied for more days before they can be unloaded, returned, repositioned and reused. UNCTAD estimated during the initial Red Sea crisis that extended routes were reducing effective global container capacity by approximately 9%, while container-ship demand generated by the additional ton-miles increased by approximately 12%. Red Sea Crisis and implications for trade facilitation in Africa — UN Trade and Development Review of Maritime Transport 2024 — UN Trade and Development Conferenza sul Commercio e Sviluppo
Mechanical Effect of Cape Diversion on a Representative Asia–Europe Voyage
| Variable | Suez routing | Cape routing | Change |
|---|---|---|---|
| Representative Shenzhen–Rotterdam distance | ~10,000 nm | ~13,000 nm | +3,000 nm |
| Approximate transit time | 31 days | 41 days | +10 days |
| Distance increase | Baseline | — | ~30% |
| Transit-time increase | Baseline | — | ~32% |
| Direction of bunker consumption | Lower | Higher | Material increase |
| Vessel-days consumed | 31 | 41 | +10 ship-days per transit |
| Container-days occupied | Lower | Higher | Increased |
| Probability of schedule propagation | Lower | Higher | Increased |
| Intermediate bunkering demand | Lower | Higher | Increased |
| Inventory pipeline duration | 31-day transport leg | 41-day transport leg | +10 days |
Source data: Review of Maritime Transport 2024 — UN Trade and Development. Percentage changes calculated directly from UNCTAD’s reported distances and times. Conferenza sul Commercio e Sviluppo
The arithmetic also demonstrates why shipping disruption propagates into corporate balance sheets. With a constant daily cargo requirement \(D\), pipeline inventory associated with the ocean leg is mechanically proportional to transit time: a 31-day maritime transit requires approximately \(31D\) units simultaneously in transit, whereas a 41-day transit requires approximately \(41D\). Without changing annual consumption at all, the company therefore requires approximately 32% more goods tied up in the ocean pipeline for that transport leg, before adding any additional safety stock required to protect against greater schedule uncertainty.
Suez Has Become a Variable Route Rather Than a Fixed Assumption
The Suez Canal itself did not cease functioning during the Red Sea crisis; what collapsed was carrier willingness to expose vessels to the approach route. This distinction is critical because infrastructure capacity can remain technically available while commercially usable capacity disappears. In 2023 approximately 22% of global seaborne container trade passed through Suez, which explains why voluntary avoidance by major carriers had effects far beyond Egypt or the Red Sea region. Navigating Troubled Waters — UN Trade and Development Conferenza sul Commercio e Sviluppo
The subsequent partial recovery demonstrates the reversibility of the system but also its fragility. The Suez Canal Authority reported that in the first part of 2026, before the broader regional escalation fully disrupted traffic patterns, 1,315 vessels with 56 million tonnes of net tonnage generated $449 million of revenue, compared with 1,243 vessels, 47 million tonnes and $368 million during the comparable prior period; the Authority characterised the figures as a recovery from the Red Sea crisis. During his participation in MARLOG — Suez Canal Authority — Feb 2026 Canale di Suez
The same month, the Suez Canal Authority reported that ASTRID MAERSK transited as part of Gemini’s effort to return the ME11 service from the Cape route to Suez, while Maersk and Hapag-Lloyd continued to make service-by-service security assessments during 2026 rather than restoring the entire network simultaneously. ASTRID MAERSK first Suez voyage — Suez Canal Authority — Feb 2026 Structural changes to AE19 Gemini service — Maersk — Aug 2026 Canale di Suez
This produces a fundamentally different logistics environment from the traditional pre-2023 model. Route selection is now conditional on a continuously updated security decision, meaning network planning must preserve the ability to switch between Suez and the Cape rather than optimise permanently around one corridor. The commercial consequence is a requirement for redundant schedule architecture, while the industrial consequence is that importers can no longer assume a stable Asia–Europe lead time as a fixed parameter in inventory optimisation.
Hormuz Is Simultaneously a Shipping Chokepoint and a Bunker-Fuel Shock
The Strait of Hormuz matters differently from the Red Sea because disruption there affects both vessel movements and the energy inputs required to operate the wider merchant fleet. The U.S. Energy Information Administration reported that Brent crude traded between approximately $72 and $118 per barrel during Q2 2026, after beginning the quarter above $100 as reduced access through Hormuz disrupted crude flows and caused some Middle Eastern production to be shut in. Petroleum markets responded to disruptions in the Middle East in the second quarter — U.S. EIA — Jul 2026 EIA USA
The physical flow data are even more significant. EIA’s 2026 energy-security assessment records oil flows through Hormuz at approximately 21.6 million barrels per day in Q4 2025, 14.9 million in Q1 2026 and only 4.9 million in Q2 2026, while LNG flows fell from approximately 10.5 billion cubic feet per day in Q4 2025 to 0.8 billion cubic feet per day in Q2 2026. Short-Term Energy Outlook — Energy Security Analysis — U.S. Energy Information Administration
Hormuz Energy-Flow Compression
| Energy flow | Q4 2025 | Q1 2026 | Q2 2026 | Q2 change from Q4 2025 |
|---|---|---|---|---|
| Oil through Hormuz | 21.6m b/d | 14.9m b/d | 4.9m b/d | −77.3% |
| LNG through Hormuz | 10.5 bcf/d | — | 0.8 bcf/d | −92.4% |
| Brent Q2 2026 range | — | — | $72–$118/bbl | Extreme intraperiod volatility |
Source: U.S. Energy Information Administration — Energy Security Analysis and Petroleum markets responded to disruptions in the Middle East. Percentage changes calculated from published EIA values. EIA USA
The logistics implication extends far beyond tankers because container ships, bulk carriers, car carriers and feeder vessels require fuel regardless of whether they ever transit Hormuz. When regional refineries operate below capacity, fuel specifications become harder to source in preferred locations and carriers must rebalance bunkering geographically, the energy shock becomes a network-wide operating-cost shock.
Maersk’s own March 2026 operational disclosures provide first-party evidence of that transmission mechanism. The carrier reported that regional refineries were offline or operating at reduced capacity, that fuel exports were constrained, and that it had to redistribute fuel supplies and source alternative bunkers from additional locations and suppliers at increased premiums; Maersk consequently introduced a worldwide Emergency Bunker Surcharge of $200 per 20-foot dry headhaul container, $400 per 40-foot dry headhaul container and $600 per 40-foot reefer on long-haul headhaul trades. Introduction of temporary Emergency Bunker Surcharge — Maersk — Mar 2026 Middle East Operational Update 12 — Maersk — Mar 2026 Maersk
Direct Carrier Cost Pass-Through During the 2026 Middle East Crisis
| Charge | Applicable example | Published amount | Cost driver |
|---|---|---|---|
| Maersk Emergency Bunker Surcharge | Long-haul headhaul 20′ dry | $200/container | Fuel availability and cost |
| Maersk Emergency Bunker Surcharge | Long-haul headhaul 40′ dry | $400/container | Fuel availability and cost |
| Maersk Emergency Bunker Surcharge | Long-haul headhaul 40′ reefer | $600/container | Fuel plus reefer operating burden |
| Hapag-Lloyd War Risk Surcharge | Upper Gulf standard equipment | $1,500/TEU | Security and operational adjustment |
| Hapag-Lloyd War Risk Surcharge | Reefer/special equipment | $3,500/container | Higher operational/security exposure |
| Maersk ECS | N. Europe/Med → Oman and selected Middle East Red Sea ports, 20′ dry | $1,800 | Conflict-driven contingency operations |
| Maersk ECS | Same route, 40′ dry | $3,000 | Conflict-driven contingency operations |
| Maersk ECS | N. Europe/Med → Sudan/Djibouti, 40′ dry or reefer | $3,000 | Red Sea/East Africa operational disruption |
Sources: Maersk Emergency Bunker Surcharge, Hapag-Lloyd War Risk Surcharge, Maersk Emergency Contingency Surcharge — Europe Trades. Maersk
These figures should not be interpreted as a universal measure of the underlying war-risk insurance premium because carrier surcharges combine different operating costs and commercial responses; they are nevertheless direct evidence that geopolitical risk moved from the security domain into freight invoices within days of the regional escalation.
War-Risk Pricing Is Becoming a Commercial Access Mechanism
Hapag-Lloyd’s response illustrates how an external military event is converted contractually into a transport-cost adjustment. On 1 March 2026 the carrier announced a War Risk Surcharge of $1,500 per TEU for standard containers and $3,500 per reefer or special-equipment container moving to, from or through the Upper Gulf, Persian Gulf and Arabian Gulf, explicitly citing disruption around Hormuz and the resulting effects on schedules and equipment supply. Shipping to and from the Upper Gulf, Arabian Gulf, and Persian Gulf? A War Risk Surcharge is coming up — Hapag-Lloyd — Mar 2026 Hapag-Lloyd
The company also invoked provisions of its bill of lading that permit alteration or termination of carriage under specified circumstances, demonstrating why insurance and freight pricing cannot be examined independently from contractual access. A manufacturer can technically have a booked shipment and a functioning destination port yet still face additional cost, rerouting or altered delivery when the carrier’s contractual security protections are activated. Hapag-Lloyd War Risk Surcharge — Mar 2026 Hapag-Lloyd
Maersk’s contemporaneous response was similarly granular. The carrier imposed Emergency Contingency Surcharges of $1,800 for a 20-foot dry container and $3,000 for a 40-foot container on selected Europe–Middle East Red Sea and Oman trades, while temporarily closing reefer acceptance for certain corridors; the important point is therefore not only that transport became more expensive, but that some cargo categories became commercially unavailable on particular services at particular moments. Change to Emergency Contingency Surcharge — Europe Trades — Maersk — Mar 2026 Maersk
That distinction is decisive for pharmaceuticals, food and chemicals because price elasticity cannot solve a logistics constraint when the carrier temporarily refuses the equipment category required to move the cargo.
Emergency Logistics Costs Continue After the Vessel Stops Sailing
The stranded-cargo problem demonstrates a further cost layer that standard freight-rate analysis misses. Maersk’s March 2026 operational instructions for cargo affected by Hormuz disruption offered shippers options including temporary storage and alternative routing; where cargo remained in storage beyond an included 14-day period, the carrier specified $25 per TEU per day, excluding additional reefer monitoring and plug-in charges. Middle East Operational Update 7 — Maersk — Mar 2026 Maersk
A 40-foot container counted as two TEU remaining for an additional 30 days would therefore incur $1,500 in storage alone, calculated from Maersk’s published rate, before cargo financing, demurrage-related exposure where applicable, reefer electricity, inspection, inland substitution or production-delay costs are considered. This illustrates why the cost of maritime warfare cannot be reconstructed from ocean freight indexes alone.
Layers of Conflict-Driven Logistics Cost
| Cost layer | Trigger | Accounting location | Visibility |
|---|---|---|---|
| War-risk surcharge | Security exposure | Freight invoice | High |
| Emergency contingency surcharge | Diversion/storage/alternative network | Freight invoice | High |
| Emergency bunker surcharge | Fuel-price and availability shock | Freight invoice | High |
| Additional fuel consumption | Longer voyage | Carrier operating cost, later reflected in rates | Medium |
| Charter-rate increase | More vessel-days required | Carrier cost | Medium |
| Extra container-days | Longer round trip | Carrier/equipment cost | Medium |
| Storage | Cargo unable to continue | Shipper logistics cost | High |
| Reefer plug/monitoring | Temperature-sensitive cargo stranded | Shipper logistics cost | High |
| Pipeline inventory | Longer lead time | Working capital | Low |
| Safety stock | Greater schedule uncertainty | Working capital/inventory | Low |
| Production interruption | Missing component/input | Manufacturing cost | Often very high |
| Expedited air freight | Emergency substitution | Logistics/procurement | High |
| Supplier diversification | Risk reduction | Procurement overhead | Medium |
| Lost sales/service failures | Late customer delivery | Revenue/margin | Often diffuse |
The first seven categories can often be identified on shipping invoices; the remaining categories frequently appear elsewhere in company accounts, which explains why the macroeconomic effect of maritime instability can substantially exceed the measured increase in container freight rates.
Container Imbalances Become Self-Reinforcing When Voyage Cycles Lengthen
Containers are reusable transport assets, which means disruption alters not merely ship capacity but the temporal availability of equipment. A box that would normally complete an Asia–Europe movement and return to an export location within one cycle remains unavailable for longer when ships route around Africa, wait for port windows or are held in intermediate storage.
UNCTAD reported during the initial Red Sea shock that longer delivery times had already generated shortages not only of specialised perishable equipment but also ordinary containers, with effects visible in African agricultural exports including avocados, tea and coffee. Red Sea Crisis and implications for trade facilitation in Africa — UN Trade and Development Conferenza sul Commercio e Sviluppo
The imbalance mechanism can become circular: longer route → slower container return → fewer empty containers at origin → cargo misses planned sailing → box remains inland or at terminal longer → schedule reliability falls further. Carriers can compensate by purchasing or leasing more equipment and by repositioning empties, but both measures impose cost and use vessel capacity that might otherwise carry revenue-generating cargo.
Container-Cycle Stress Mechanism
| Stage | Normal network | Conflict-disrupted network | Consequence |
|---|---|---|---|
| Empty box available | Origin depot on schedule | Delayed return/repositioning | Export booking risk |
| Stuffing | Predictable | May be delayed awaiting equipment | Production/warehouse congestion |
| Port gate-in | Scheduled | Irregular arrival waves | Terminal yard pressure |
| Ocean leg | Shortest commercial route | Cape diversion/security delay | Longer equipment occupancy |
| Transshipment | Predictable connection | Missed or reconfigured connection | Dwell-time increase |
| Destination unloading | Scheduled | Arrival bunching | Port congestion |
| Empty return | Normal cycle | Delayed by longer transit | Origin shortage |
| Repositioning | Limited | Greater empty repositioning required | Additional non-revenue capacity consumption |
Port Congestion Is the Second-Order Consequence of Diversion
Rerouting does not distribute additional traffic evenly across the world port system. Vessels avoiding Suez require additional bunkering, stores, crew services and sometimes transshipment around Africa, while ships arriving in Europe and Asia outside normal schedule windows can produce arrival bunching that disrupts berth plans.
The World Bank’s Container Port Performance Index 2024 found that renewed stress associated with Red Sea diversions and Panama Canal disruptions had again reduced schedule efficiency and increased port congestion, with Middle East and North African port performance particularly affected and rerouted vessels adding pressure to Sub-Saharan African facilities. The Container Port Performance Index 2020 to 2024 — World Bank Banca Mondiale
UNCTAD similarly found that additional traffic around Africa increased demand for bunkering and port services at facilities that were not necessarily configured for sudden additional calls by large vessels. Red Sea Crisis and implications for trade facilitation in Africa — UN Trade and Development Conferenza sul Commercio e Sviluppo
The resulting congestion is economically important because it compounds the original diversion. A carrier initially adds ten days by sailing around Africa, but additional anchorage, berth delay or missed connections can increase actual end-to-end delay beyond the pure sailing-time difference, introducing variance that forces importers to hold more safety stock.
Schedule Uncertainty Is More Damaging to Industry Than a Predictable Longer Voyage
Industrial logistics systems can adapt relatively efficiently to a known 41-day transit replacing a known 31-day transit because procurement schedules can be shifted and pipeline inventories increased once. The more damaging condition is a route whose transit time alternates between 31, 41, 45 or more days depending upon security assessments, sailing cancellations, missed transshipments and port congestion.
This distinction explains why maritime resilience should be measured not only by average transit time but by variance of transit time and probability of schedule failure. A manufacturer whose component arrives consistently ten days later can restructure ordering; a manufacturer that cannot know whether the same component will arrive 10, 20 or 30 days late must carry substantially more buffer inventory or maintain expensive substitute transport.
The World Bank recorded a 96% month-on-month rise in its Global Supply Chain Stress Index in January 2024 after Red Sea disruption intensified, while shipping costs almost doubled between December and March in that early phase of the crisis, demonstrating how quickly route uncertainty moved beyond vessel operations into broader logistics stress. World Bank — Logistics constraints and Red Sea supply-chain stress World Bank
Industrial Inventory Requirements Rise Through Two Different Mechanisms
The first mechanism is pipeline inventory. If a factory consumes 1,000 units of an imported component every day, increasing the maritime lead time by ten days mechanically places another 10,000 units somewhere in the supply pipeline if production is to continue without interruption. This relationship does not require an assumption about behaviour: pipeline inventory equals throughput multiplied by transit time.
The second mechanism is safety stock, which compensates for uncertainty rather than average duration. As maritime schedules become more volatile, inventory managers must protect against late arrivals rather than only longer expected arrivals. The required safety stock depends upon demand variability, service target, replenishment variability and correlations between disruptions, so no universal percentage can be inferred from shipping data alone.
Inventory Transmission Model
| Variable | Stable shipping environment | Conflict-disrupted environment | Balance-sheet effect |
|---|---|---|---|
| Average ocean lead time | Lower | Higher | More pipeline inventory |
| Lead-time variance | Lower | Higher | More safety stock |
| Schedule cancellation probability | Lower | Higher | Additional buffer stock |
| Supplier reliability | Stable | May vary by route | Supplier diversification |
| Container availability | Predictable | More volatile | Earlier booking and inventory commitment |
| Freight cost | More stable | Higher/volatile | Higher landed cost |
| Financing duration | Shorter | Longer | Increased working-capital requirement |
| Warehouse requirement | Optimised for lean inventory | Higher buffer requirement | More warehousing |
| Expedited transport | Exceptional | More frequent | Higher air/road freight expense |
| Production risk | Lower | Higher if critical component late | Potential output loss |
For firms using just-in-time procurement, the critical variable is therefore not the percentage increase in freight cost but the economic value of production exposed to one unavailable component. A €10,000 container of specialised parts can in principle constrain production worth many multiples of the value of the cargo, which is why high-value manufacturers often respond to unreliable maritime transport with disproportionately expensive inventory or airfreight substitution.
The Black Sea Demonstrates That Maritime Trade Can Survive War, but Only Through Additional Security Infrastructure
Ukraine’s maritime corridor provides a counterexample to the assumption that war automatically eliminates commercial shipping. According to Ukraine’s Ministry for Communities and Territories Development, by 4 June 2026 the Ukrainian maritime corridor had transported 200 million tonnes of cargo since September 2023, including 118 million tonnes of grain, and had handled more than 7,800 vessel movements. Ukrainian maritime corridor has transported 200 million tonnes — Ministry for Communities and Territories Development of Ukraine — Jun 2026 mininfra.gov.ua
Earlier official data showed that by March 2026 the corridor had already handled approximately 179 million tonnes, including 107 million tonnes of grain and 7,087 vessels, while Ukrainian authorities reported that 726 port-infrastructure facilities and 153 civilian vessels had been damaged or partly destroyed since the beginning of the full-scale invasion; in 2026 alone, the same release reported damage to 63 port infrastructure facilities and seven civilian vessels by mid-March. Ukrainian ports have handled over 15 million tonnes of cargo — Cabinet of Ministers of Ukraine — Mar 2026 Ministero per le Piccole e Medie Imprese
Ukrainian Corridor — Verified Operational Scale
| Indicator | March 2026 | June 2026 |
|---|---|---|
| Cumulative corridor cargo | ~179m tonnes | 200m tonnes |
| Grain | 107m tonnes | 118m tonnes |
| Vessels handled | 7,087 | >7,800 |
| 2026 Ukrainian port cargo | >15m tonnes by mid-March | ~35m tonnes reported by early June |
| Greater Odesa cargo | 14.5m tonnes by mid-March | Continuing principal corridor role |
| Port infrastructure damaged since full-scale invasion | 726 facilities reported by March | Conflict exposure remained active |
| Civilian vessels damaged/partly destroyed | 153 reported by March | Continuing maritime risk |
Sources: Cabinet of Ministers of Ukraine — Mar 2026, Ministry for Communities and Territories Development — Jun 2026. Ministero per le Piccole e Medie Imprese
The significance is not that the Black Sea has normalised; the opposite conclusion is more accurate. Trade has continued because a specific corridor architecture, port operations, military conditions, hydrographic services, clearance procedures, international assistance and commercial acceptance have combined to make navigation possible despite continued attack risk. The IMO’s September 2026 support programme focuses specifically on maritime-safety infrastructure, pollution response and trade facilitation, confirming that commercial continuity in wartime requires institutional resources that would not be necessary in peacetime. Ukraine enhances maritime safety and Special Maritime Corridor operations — IMO — Sep 2026 Organizzazione Marittima Internazionale
Grain and Bulk Shipping Have Been Structurally Reconfigured by the Russia–Ukraine War
The Russia–Ukraine conflict has altered not only port security but the geography of commodity trade. UNCTAD records that the war produced longer oil and grain transport distances, while Ukrainian cargo shifted between Black Sea routes, Danube ports and alternative export corridors, thereby increasing ton-mile requirements even where total trade volumes could eventually be maintained. Navigating Troubled Waters — UN Trade and Development Review of Maritime Transport 2025 — UN Trade and Development Conferenza sul Commercio e Sviluppo
UNCTAD estimated that Red Sea rerouting alone increased dry-bulk ton-mile trade by approximately 1.2% in 2024, while Panamax time-charter earnings averaged approximately $16,157 per day, 10% above the 2023 average; Kamsarmax vessels averaged $14,099 per day and Supramax one-year charter rates averaged $13,601 per day, 21% higher than the prior year, although these rates also reflected demand and supply factors beyond the wars themselves and therefore cannot be attributed exclusively to geopolitical disruption. Review of Maritime Transport 2025 — UN Trade and Development Conferenza sul Commercio e Sviluppo
The broader lesson is that conflict frequently alters distance before it alters volume. The world can continue consuming approximately the same quantity of grain, oil, iron ore or manufactured goods while the fleet must travel significantly farther to deliver them, meaning traditional trade-volume statistics can understate the logistical burden imposed by geopolitical fragmentation.
Maritime Ton-Miles Have Become More Important Than Maritime Tonnes
A tonne of cargo moved 3,000 nautical miles and a tonne moved 10,000 nautical miles both appear as one tonne in conventional trade-volume statistics, but the latter consumes more than three times as much ship-distance. Ton-miles therefore provide a superior indicator of fleet demand under geopolitical rerouting.
UNCTAD reported that maritime trade volume increased approximately 2.2% in 2024, while ton-mile demand rose approximately 6%, meaning distance expanded nearly three times faster than physical cargo. Maritime trade under pressure — UN Trade and Development — Sep 2025 Conferenza sul Commercio e Sviluppo
Why Trade Volume Alone Now Understates Logistics Stress
| Metric | What it measures | What it misses | Relevance under war-driven rerouting |
|---|---|---|---|
| Tonnes | Physical cargo volume | Distance | Can remain stable despite severe fleet stress |
| TEU | Container quantity/capacity | Voyage length | Does not show ship-days consumed |
| Vessel count | Number of ships | Utilisation and route length | Fleet may be unchanged while available capacity falls |
| Nautical miles | Distance | Cargo volume | Captures diversion but not ship loading |
| Ton-miles | Cargo × distance | Schedule variance | Best aggregate indicator of transport work |
| Vessel-days | Ship × time | Cargo value | Captures fleet absorption |
| Container-days | Equipment × time | Production importance | Captures equipment scarcity |
| Lead-time variance | Reliability | Direct cost | Critical for safety-stock decisions |
Returning Through Suez Does Not Immediately Release All Absorbed Capacity
When a carrier switches a service from the Cape back to Suez, the shorter route can eventually release ships and containers, but the adjustment is not instantaneous because schedules, port windows, crew plans, customer bookings and equipment positions were configured around the previous rotation.
Maersk’s August 2026 decision to move the AE19 Gemini service back to the trans-Suez route illustrates the gradual character of normalisation: the service was changed only after a specific security assessment and remained part of a staged rather than network-wide restoration. Structural changes to AE19 Gemini service — Maersk — Aug 2026 Maersk
Another Maersk service announcement explicitly stated that if security deteriorated again, individual sailings or the entire service structure could revert to the Cape of Good Hope. Structural changes to WAF6 — Maersk — Jul 2026 Maersk
The strategic implication is that the present market cannot price Suez access as a binary variable of “open” or “closed.” A more accurate model contains at least four states: normal passage, selective passage, commercially avoided passage and physically constrained passage, each producing a different level of fleet absorption and cost.
Operational States of a Strategic Chokepoint
| State | Physical infrastructure | Security environment | Carrier behaviour | Logistics outcome |
|---|---|---|---|---|
| Normal | Available | Low threat | Broad transit | Lowest distance/cost |
| Selective | Available | Elevated threat | Service-by-service transit | Mixed schedules, uncertainty |
| Commercial avoidance | Available | Threat judged excessive | Cape or alternative routing | High vessel absorption |
| Severe restriction | Technically/physically constrained | Active hostilities | Stranding/suspension | Cargo interruption and scarcity |
This distinction is especially important for modelling because trade databases can show a functioning canal while corporate supply chains are effectively behaving as if the route were closed.
Fuel, Insurance and Distance Reinforce One Another
The three largest voyage-cost channels during conflict are not independent. Longer routes consume more fuel; a simultaneous Hormuz shock can increase fuel prices and reduce bunker availability; operating through a war-risk zone raises insurance and security costs; and vessels accelerating to recover lost schedule time consume still more fuel.
UNCTAD explicitly identifies fuel, wages, insurance and chartering among the costs increased by longer routes, while its analysis also notes that rerouted ships sometimes travel at higher speed to compensate for lost time, further increasing energy consumption. Review of Maritime Transport 2024 — UN Trade and Development Disruptions in key global shipping routes — UN Trade and Development Conferenza sul Commercio e Sviluppo
This produces a nonlinear rather than additive cost structure. A 30% increase in distance does not necessarily imply only a 30% increase in voyage cost because the ship may face higher fuel prices, higher insurance charges, additional port services, longer charter duration and speed-related fuel penalties simultaneously.
The Logistics Shock Has Become More Persistent Than the Initial Freight-Rate Spike
Freight prices can decline even while structural logistics inefficiency persists because rate levels are determined by both supply and demand. Additional newbuild deliveries can add vessel capacity, weak economic growth can reduce cargo demand and carriers can optimise networks, offsetting some of the rate pressure created by longer routes.
This is why freight rates alone should not be used as a proxy for geopolitical logistics risk. UNCTAD reported that maritime trade growth slowed toward approximately 0.5% in 2025, while rerouting and higher transport distances continued to place the system under pressure. Maritime trade under pressure — UN Trade and Development — Sep 2025 Conferenza sul Commercio e Sviluppo
A falling container index can therefore coexist with deteriorating strategic resilience if weak cargo demand temporarily masks the amount of capacity being consumed by diversion. Conversely, a rapid recovery in trade demand while the same longer routes remain in place can tighten the market abruptly because the hidden capacity buffer has already been absorbed.
The Industrial Consequence Is a Shift from Just-in-Time Toward Just-in-Case
The logistical response to persistent chokepoint instability is not necessarily wholesale deglobalisation. It is more commonly a gradual increase in redundancy: larger safety stocks, multiple suppliers, earlier booking, alternative ports, dual-route contracts, increased warehousing, greater use of rail or air for critical cargo and contractual priority for scarce vessel slots.
This changes the economics of global production because the lowest-cost supplier is no longer necessarily the lowest-risk supplier once shipping uncertainty, financing cost and emergency replacement are included. Companies effectively begin paying an option premium for resilience, whether through additional inventory, unused supplier capacity, redundant warehousing or guaranteed logistics contracts.
From Lean Logistics to Resilience Logistics
| Traditional optimisation | Conflict-era adjustment | Economic cost |
|---|---|---|
| Minimum inventory | Larger safety stock | Working capital |
| One preferred supplier | Dual/multiple sourcing | Lower procurement scale efficiency |
| Cheapest route | Route redundancy | Higher freight cost |
| Maximum vessel utilisation | Capacity buffer | Lower carrier asset efficiency |
| Centralised warehouse | Regional inventory nodes | Warehousing duplication |
| Fixed port gateway | Multi-port options | Higher complexity |
| Spot freight exposure | Longer contracts/priority capacity | Contract premium |
| Just-in-time components | Earlier replenishment | Financing and obsolescence |
| Single-mode transport | Sea/air/rail contingency | Higher average transport cost |
| Lowest unit cost | Total-resilience cost | Higher apparent procurement cost but lower interruption risk |
The consequence is a subtle but important transfer of capital from productive investment toward defensive logistics. Money tied up in additional inventory, warehouses and duplicate supply arrangements remains economically necessary but does not generate the same productivity gain as machinery, research or new capacity.
The Different Shipping Segments Face Different Conflict Transmission Mechanisms
Treating “shipping” as one market obscures critical differences because container ships, crude tankers, product tankers, LNG carriers, bulkers, car carriers and specialised vessels respond differently to the same conflict.
Segment-Specific Exposure
| Segment | Principal conflict transmission | Chokepoint sensitivity | Downstream sectors |
|---|---|---|---|
| Container shipping | Rerouting, equipment imbalance, schedule failure | Red Sea/Suez particularly important | Manufacturing, retail, electronics, pharmaceuticals |
| Crude tankers | Hormuz flow interruption, route change, sanctions | Hormuz extremely important | Refineries, energy, chemicals |
| Product tankers | Refinery outages, bunker/fuel redistribution | Hormuz + Red Sea | Transport fuels, industry |
| LNG carriers | Hormuz concentration and route avoidance | Extremely high for Qatar-linked flows | Power generation, industry |
| Dry bulk | Grain/coal/ore rerouting | Black Sea and Red Sea | Food, steel, utilities |
| Car carriers | Red Sea avoidance and scarce specialised capacity | High Asia–Europe exposure | Automotive |
| Reefers | Container shortage plus electrical/storage constraints | High schedule sensitivity | Food, pharma |
| Project/heavy lift | Route restrictions and specialist vessel scarcity | Cargo-specific | Energy projects, defence, infrastructure |
The evidence from the initial Red Sea crisis demonstrates this heterogeneity particularly clearly: UNCTAD’s recorded decline in Gulf of Aden ship capacity was 92% for containerships and 96% for car carriers, but approximately 50% for crude tankers. Review of Maritime Transport 2024 — UN Trade and Development Conferenza sul Commercio e Sviluppo
The Strategic Business Metric Is Time-to-Recovery, Not Merely Time-to-Delivery
A company can survive a late shipment if it has enough stock; the more difficult question is how quickly the logistics network can restore reliable service after disruption. Recovery requires more than reopening a strait: ships must return, containers must be repositioned, schedules rebuilt, port congestion cleared, delayed cargo delivered and inventories replenished.
Accordingly, the most useful operational indicators are not only current freight rates but also the proportion of services using each route, average voyage duration, schedule reliability, ships waiting or stranded, container dwell times, emergency surcharges, bunker-price spreads, reefer acceptance, port congestion and the speed with which carriers remove temporary restrictions.
Key Quantitative Indicators for Continuous Monitoring
| Indicator | Why it matters | Direction signalling deterioration |
|---|---|---|
| IMO confirmed Hormuz incidents | Direct security risk | Rising |
| Ships unable to exit Persian Gulf | Physical fleet immobilisation | Rising |
| Daily Hormuz vessel transits | Actual route utilisation | Falling |
| Hormuz oil/LNG flows | Energy and bunker availability | Falling |
| Brent/bunker price volatility | Voyage cost | Rising |
| Red Sea confirmed incidents | Suez approach security | Rising |
| Share of services routed via Cape | Effective fleet absorption | Rising |
| Suez transits | Route normalisation | Falling |
| Cape arrivals | Diversion intensity | Rising |
| Global container ton-mile demand | Fleet utilisation pressure | Rising faster than cargo volume |
| Schedule reliability | Industrial predictability | Falling |
| Container dwell time | Equipment availability | Rising |
| Emergency bunker surcharges | Fuel shock pass-through | Rising |
| War-risk/contingency surcharges | Security cost pass-through | Rising |
| Reefer booking restrictions | Critical-goods availability | Increasing |
| Ukrainian corridor throughput | Black Sea trade resilience | Falling materially |
| Port infrastructure attacks | Black Sea operational risk | Rising |
| Port congestion | Secondary logistics amplification | Rising |
| Inventories-to-sales in exposed sectors | Corporate adaptation | Rising sharply |
What the 2024–2026 Sequence Demonstrates
The first Red Sea shock established that carriers can preserve trade by moving around Africa, but doing so absorbs additional ships and containers. The Russia–Ukraine war demonstrated that commercial shipping can continue through an active conflict environment when a sufficiently robust maritime corridor and security architecture exist. The 2026 Hormuz crisis then added the more dangerous possibility that a conflict can simultaneously constrain physical navigation and the fuel system supporting the global merchant fleet.
The combined evidence therefore points to a shipping system that is resilient but increasingly expensive to keep resilient. Globalisation has not stopped because cargo still moves; rather, the amount of capital, fuel, equipment, contractual protection and redundancy required to move that cargo has increased.
Key Judgments
The decisive logistics consequence of the current conflict system is capacity absorption rather than simple route closure. Cape diversions, Gulf immobilisation and Black Sea security procedures increase the number of vessel-days required for an unchanged cargo flow, making effective capacity materially tighter than nominal fleet statistics indicate. Review of Maritime Transport 2024 — UN Trade and Development Conferenza sul Commercio e Sviluppo
Hormuz represents a particularly powerful transmission channel because the security crisis combines attacks on vessels with disruption to petroleum and bunker-fuel availability, allowing a regional conflict to influence the cost of ships operating thousands of kilometres from the Gulf. U.S. EIA — Petroleum markets responded to disruptions in the Middle East Maersk — Emergency Bunker Surcharge EIA USA
The Red Sea remains a conditionally usable corridor rather than a fully normalised route because carriers continue to move individual services between Suez and Cape configurations according to security assessments. Maersk — Structural changes to AE19 Maersk — Structural changes to WAF6 Maersk
The Russia–Ukraine theatre demonstrates that maritime continuity during war is achievable, but the 200 million tonnes moved through Ukraine’s maritime corridor by June 2026 should be read as evidence of organised resilience rather than normalisation, because commercial throughput continues alongside repeated attacks on ports and civilian shipping. Ukraine Ministry for Communities and Territories Development — Jun 2026 IMO — Black Sea attacks — Jul 2026 mininfra.gov.ua
The largest corporate cost is consequently not always the freight-rate increase visible on an invoice. For strategically exposed industries, the more persistent burden comes from longer pipeline inventories, larger safety stocks, duplicated suppliers, warehouse capacity, emergency transport and capital immobilised to insure production against unpredictable maritime lead times.
What Would Change the Assessment
A sustained reduction in confirmed attacks around Hormuz together with a normalisation of vessel transits, a recovery in EIA-recorded petroleum flows and withdrawal of emergency bunker and war-risk surcharges would materially reduce the systemic energy-shipping component of the assessment. IMO — Middle East incidents U.S. EIA — Energy Security Analysis Organizzazione Marittima Internazionale
For the Red Sea, the assessment would change only after multiple major carrier networks restore sustained Suez transit without repeated reversion to Cape routing, because isolated services do not demonstrate that the full Asia–Europe network has normalised. Maersk — AE19 trans-Suez service Maersk
For the Black Sea, deterioration would be indicated by a sustained reduction in Ukrainian maritime-corridor throughput, materially increased vessel losses, closure of major Odesa-region ports or an inability of the IMO-supported safety architecture to sustain commercial navigation. Improvement would require not merely uninterrupted cargo tonnage but a durable reduction in attacks against port infrastructure and civilian shipping. IMO — Ukraine Special Maritime Corridor Cabinet of Ministers of Ukraine — Port and corridor data Organizzazione Marittima Internazionale
Open Official Record
The principal unresolved quantitative gap is a harmonised, current official dataset integrating daily route-level vessel transits, war-risk insurance pricing, bunker spreads, container-equipment availability, schedule reliability and port waiting times across Hormuz, Bab el-Mandeb, Suez, the Cape and Black Sea corridors. Each component is observable through different institutional or commercial sources, but no single official series presently captures the full interaction, and therefore a precise numerical estimate of the total global logistics cost attributable solely to the wars would create false precision.
The second gap concerns insurance. Carrier war-risk and contingency surcharges are publicly documented and provide direct evidence of commercial cost transmission, but those surcharges are not equivalent to a pure marine-insurance premium; a rigorous decomposition would require access to underwriter-level hull, cargo, protection-and-indemnity and additional war-risk premiums by route, vessel type and date. Accordingly, this chapter treats published carrier surcharges as observed freight-market responses and does not misrepresent them as insurance quotations.
The third gap is the industrial inventory response. Public maritime sources establish longer lead times and greater uncertainty, but the resulting safety-stock requirement differs substantially by industry, supplier concentration, demand variability and target service level; any universal percentage increase in required inventory would therefore be unsupported. The correct analytical conclusion is that longer average transit increases pipeline inventory mechanically, while greater variance increases safety-stock requirements according to company-specific operating conditions.
Strategic Business Exposure from Israel to Europe and the Global Supply Chain
Principal Judgment
The strategic business exposure created by maritime instability is broader than the transport sector itself because ocean shipping functions as an embedded production input for economies whose most valuable industries depend on imported energy, intermediate goods, components, chemicals, pharmaceuticals, metals, electronic equipment, machinery and food products before those industries can generate their own domestic output or exports. The European Union illustrates the scale of that dependency particularly clearly: EU ports handled approximately 3.4 billion tonnes of freight in 2024, including large volumes of fossil energy, petroleum products, ores, chemicals, agricultural commodities and food products, while the EU simultaneously relied on net energy imports for 57% of its energy needs. European Commission
This exposure cannot be reduced to a conventional import-dependency ratio because the most economically consequential maritime cargo is not necessarily the cargo with the highest tonnage. A relatively small shipment of semiconductors, active pharmaceutical ingredients, aerospace components, precision machinery, specialised chemicals or defence electronics can have an industrial consequence far exceeding its physical mass when the missing input interrupts a high-value production line. Conversely, extremely large maritime flows of crude oil, LNG, ores or grain matter because their sheer physical scale makes rapid substitution through air, rail or road transport impossible.
The resulting strategic distinction is between commodity mass dependence and production-node dependence. Energy, ores, grains and bulk chemicals create mass dependence because substitution requires enormous transport capacity; electronics, pharmaceuticals, aerospace parts, machine tools and specialised industrial inputs create node dependence because disruption of a small number of critical inputs can disable much larger value chains. The five-year resilience challenge for Israel and Europe is therefore not to eliminate maritime dependence, which would be economically and physically unrealistic, but to reduce the number of cases in which interruption of one route, one supplier, one port, one maritime service or one externally controlled industrial input can propagate into systemic production loss.
Maritime Transport Is Embedded Inside the Industrial Economy
European port statistics show that maritime transport already carries the physical foundations of several strategic industrial systems. In 2024, approximately 19% of goods handled by the main EU ports consisted of coal, lignite, crude petroleum and natural gas, another 16.5% consisted of coke and refined petroleum products, 7.4% consisted of ores and other mining products, 7.2% consisted of chemicals, rubber, plastics and nuclear fuel, 6.3% consisted of agricultural, forestry and fishery products, and 4.9% consisted of food products, beverages and tobacco. Together, these categories represented more than 60% of the physical freight handled by the principal European maritime gateways. European Commission
The value structure of European trade, however, looks very different. In 2025, machinery and transport equipment accounted for 35.9% of EU goods exports and 33.9% of imports, while chemicals represented 22.9% of exports and 12.8% of imports. Mineral fuels represented a much greater share of imports than exports, while the EU generated large external surpluses in chemicals and machinery but remained structurally dependent on imported energy and many industrial inputs. European Commission
The combination produces an important strategic asymmetry: Europe exports high-value manufactured systems while importing many of the physical inputs, energy products and upstream components required to produce them. Maritime disruption can therefore attack European industrial competitiveness from both sides of the production function, raising the cost or reducing the availability of imported inputs while simultaneously delaying delivery of finished European exports.
Maritime Exposure by Industrial Function
| Sector | Principal maritime dependency | Failure mechanism | Why substitution is difficult | Industrial consequence |
|---|---|---|---|---|
| Energy | Crude oil, LNG, refined products, coal, biofuels | Route disruption, tanker scarcity, terminal interruption | Volumes are too large for non-maritime replacement | Energy prices, power generation, refinery utilisation, industrial costs |
| Automotive | Electronics, batteries, specialised metals, components, imported vehicles | Missing part stops assembly sequence | Thousands of suppliers and model-specific components | Production interruption, inventories, vehicle delivery delays |
| Machinery | Metals, electronics, precision parts, castings, components | Supplier or route delay | High product specificity | Delayed industrial investment and export production |
| Electronics | Semiconductors, boards, modules, rare-earth components | Concentrated Asian production | Air freight helps only for selected high-value cargo | Broad manufacturing spillovers |
| Pharmaceuticals | APIs, intermediates, excipients, packaging, finished medicines | Supplier concentration and temperature sensitivity | Regulatory qualification constrains rapid supplier replacement | Medicine shortages and higher safety-stock requirements |
| Chemicals | Feedstocks, intermediates, gases and specialised formulations | Energy/input interruption | Production processes require exact chemical specifications | Cross-sector propagation |
| Food | Grain, feed, oils, refrigerated products, fertiliser | Bulk and reefer disruption | Large physical volumes and perishability | Food inflation and stock management |
| Defence | Metals, energetics, electronics, chips, machine tools | Critical-component shortage | Security standards and supplier qualification | Production ramp-up constraints |
| Aerospace | Engines, avionics, structures, specialty metals | Globally distributed high-value supply chains | Long certification cycles | Delivery delays and working-capital accumulation |
| Renewables | Solar modules, batteries, magnets, power electronics | Concentrated Asian manufacturing | Domestic capacity still incomplete | Slower energy-transition deployment |
| Data infrastructure | Servers, networking equipment, power systems, chips | Asian electronics dependence | High technological concentration | Data-centre deployment delays |
| Construction | Steel, machinery, timber, chemicals, project cargo | Bulk/general-cargo delays | Some inputs substitutable but not immediately | Project delays and higher costs |
The strategic significance of this matrix lies in the interaction between sectors. Chemicals are inputs to pharmaceuticals, automotive production, defence manufacturing and agriculture; energy affects virtually every industrial transformation process; semiconductors enter vehicles, weapons systems, telecommunications and industrial machinery; and metals link mining, refining, machinery, aerospace, defence and energy infrastructure. Maritime risk therefore propagates through industrial dependency networks rather than isolated sectors.
Europe’s Exposure to China Is Concentrated in Precisely the Categories That Matter for Industrial Resilience
The EU imported €559.4 billion of goods from China in 2025, compared with exports to China of €199.6 billion, producing a deficit of €359.8 billion. The composition is strategically more significant than the aggregate deficit: €164.9 billion of EU imports from China consisted of electrical machinery and related equipment, representing 29.5% of all imports from China; another €106.5 billion consisted of machinery and mechanical appliances, or 19%; €34.1 billion consisted of organic chemicals; and €29.9 billion consisted of vehicles. European Commission
These categories mean that almost half of European imports from China were concentrated in electrical and mechanical machinery before electronics-related content embedded in other categories is even considered. Such dependence cannot be interpreted simply as consumer exposure: it reaches manufacturing equipment, motors, electrical systems, industrial components, power electronics, telecommunications equipment, computers, photovoltaic supply chains and intermediate machinery.
Germany provides a particularly concrete example. In January–May 2026, 86.1% of Germany’s imported photovoltaic modules and panels originated in China, while 23.5% of imported battery-electric passenger cars came from China. Germany’s exports to China, meanwhile, were heavily concentrated in machinery, data-processing/electrical/optical products and vehicles, demonstrating a two-way industrial relationship in which maritime accessibility affects both German input sourcing and export demand. Destatis
EU–China Industrial Maritime Exposure, 2025
| Product category | EU imports from China | Share of EU imports from China | Strategic importance |
|---|---|---|---|
| Electrical machinery, electronics and associated equipment | €164.9bn | 29.5% | Electronics, grid equipment, industrial automation, consumer technology |
| Machinery and mechanical appliances | €106.5bn | 19.0% | Capital equipment and industrial components |
| Organic chemicals | €34.1bn | 6.1% | Pharmaceuticals, chemicals and industrial processing |
| Vehicles | €29.9bn | 5.4% | Automotive market and EV supply chain |
| Furniture, lighting and prefabricated products | €21.3bn | 3.8% | Consumer and construction sectors |
| Combined top five categories | ~€356.7bn | 63.8% | Concentrated industrial/consumer exposure |
Source: Eurostat 2025 EU–China trade data. European Commission
A prolonged degradation of Asia–Europe maritime reliability would therefore not merely make Asian consumer products more expensive. It would raise lead times for European manufacturing inputs, encourage greater stocks of electrical and mechanical components and increase the strategic value of alternative suppliers in Korea, Japan, India, Southeast Asia, Türkiye, North America and domestic Europe.
Critical Raw Materials Convert Maritime Transport into a Defence, Digital and Energy-Security Issue
The European Union has formally recognised that strategic raw-material dependence affects defence, digitalisation, energy transition and aerospace simultaneously. Under the Critical Raw Materials Act, the EU has established 2030 benchmarks under which domestic extraction should supply at least 10% of annual consumption of strategic raw materials, processing should reach 40%, recycling 25%, and no more than 65% of annual consumption of each strategic raw material at any relevant processing stage should come from a single third country. European Commission
The importance of these targets extends directly to maritime resilience because diversification from one external supplier does not automatically create diversification from maritime transport. Lithium originating in one jurisdiction, rare-earth processing in another and battery manufacturing in a third can still share the same maritime chokepoint or container network on the route to Europe.
The defence sector exposes the problem even more sharply. A Commission staff assessment on defence supply chains cited earlier research identifying 39 processed and semi-finished materials required for defence systems, with the EU almost fully import-dependent for 19 of them and more than 50% import-dependent for over three-quarters of the group. The current European Defence Industrial Strategy and 2030 Readiness Roadmap consequently treat reducing critical raw-material and component dependencies as an explicit element of defence industrial readiness. Defence Industry and Space
Critical-Material Resilience Cannot Be Measured Only at the Mine
| Supply-chain stage | Potential dependency | Maritime relevance |
|---|---|---|
| Mining | Concentrated extraction geography | Bulk/mineral shipping |
| Refining | Often geographically more concentrated than extraction | Intermediate maritime movement |
| Processing | Chemical and metallurgical transformation | Energy and chemical dependence |
| Component production | Magnets, cells, wafers, alloys | High-value containerised trade |
| Assembly | Batteries, electronics, weapons subassemblies | Industrial Asia–Europe networks |
| Final manufacturing | European production plant | Requires continuity of all upstream stages |
| Recycling | Potential domestic resilience source | Reduces external tonnage requirement |
| Strategic stocks | Temporary shock absorption | Requires prior accumulation before crisis |
The implication is that a European mine does not create strategic autonomy if the ore must be shipped abroad for refining, just as domestic final assembly does not create supply security if the critical precursor, magnet, chip or chemical intermediate remains concentrated externally.
Pharmaceuticals Demonstrate Why Low-Tonnage Cargo Can Carry Disproportionate Strategic Value
Pharmaceutical logistics present a fundamentally different form of maritime dependency from oil or grain. The physical tonnage is much smaller, but regulatory constraints, supplier concentration and the difficulty of replacing certified active ingredients or production sites can convert a small disruption into a clinically significant shortage.
The European Commission’s Critical Medicines Alliance concluded that structural vulnerabilities persist in critical-medicine supply chains and has called for diversification, strategic projects, strengthened European manufacturing, coordinated stockpiling approaches and partnerships with third countries. Public Health
The commercial scale is substantial. Italy’s pharmaceutical exports increased 28.5% in 2025, and Istat reported that pharmaceutical trade accounted for more than 10% of total Italian merchandise trade during parts of 2025, while January–October pharmaceutical exports increased 33.7% and imports 44.6%. Istat
France simultaneously recorded pharmaceutical imports of approximately €38.4 billion in 2025, up 14.4%, while France’s imports of Italian pharmaceutical products approximately doubled, contributing €3.2 billion to the annual increase. Douane Française
This interdependence reveals why national self-sufficiency is the wrong metric. European pharmaceutical resilience depends on production sites distributed across countries, access to ingredients from outside Europe, specialised packaging, cold-chain equipment and the ability to transfer product across internal and external borders. Maritime resilience therefore complements rather than replaces pharmaceutical industrial policy.
Israel: Maritime Resilience Is an Industrial-Continuity Problem Before It Is a Freight Problem
Israel’s import structure demonstrates the depth of its dependence on external industrial inputs. In June 2026, excluding the detailed special categories identified by the Central Bureau of Statistics, 42% of Israeli goods imports consisted of raw materials, 27% were consumer goods, 19% were machinery, equipment and land vehicles for investment, while another 12% consisted of diamonds, fuels, ships and aircraft. CBS
This structure means that the principal strategic exposure lies upstream of final consumption. If raw materials and investment machinery are interrupted, the result is not only reduced import availability but potentially lower domestic production, construction, maintenance and export capacity.
The composition also explains why Israel’s successful adaptation to the first Red Sea crisis should not be interpreted as proof that maritime risk is economically immaterial. The Bank of Israel found that maritime imports from Asia and Oceania were approximately $20 billion in 2023, equivalent to roughly one-fifth of Israeli civilian imports, and that the maritime distance between China and Israel increased by approximately 114% following Red Sea diversion. Despite that severe physical change, total imports from Asia did not decline significantly and import prices did not rise significantly during the studied period, demonstrating substantial commercial adaptability. kamakama.gov.il
The result is strategically important because it identifies resilience already present in the Israeli economy: alternative routing, diversified logistics, adaptive carrier behaviour and reduced wartime demand absorbed the initial shock. At the same time, the Bank of Israel explicitly noted that civilian imports had already fallen following the outbreak of war, meaning the observed resilience occurred under depressed demand conditions rather than a full-capacity peacetime economy. kamakama.gov.il
Israel — Industrial Exposure Matrix
| Exposure | Verified indicator | Strategic interpretation |
|---|---|---|
| Raw-material imports | 42% of June 2026 goods imports | Strong upstream manufacturing dependence |
| Machinery/equipment/vehicles for investment | 19% | Maritime continuity affects capital formation |
| Consumer goods | 27% | Direct household and retail exposure |
| Fuels/ships/aircraft/diamonds | 12% | Energy and specialised asset exposure |
| Maritime imports from Asia/Oceania | ~$20bn in 2023 | Material Asia supply-chain link |
| Share of civilian imports represented by that flow | ~20% | Significant but not dominant economy-wide exposure |
| China–Israel maritime distance increase under Cape diversion | ~114% | Extreme route elasticity requirement |
| Observed first Houthi-shock import decline | No significant exceptional fall detected | Strong demonstrated short-term adaptability |
Sources: Israel Central Bureau of Statistics and Bank of Israel. CBS
The five-year Israeli resilience problem therefore centres on moving from adaptation by commercial improvisation to engineered redundancy: diversified routes, larger strategic stocks for truly irreplaceable goods, supplier diversification, sufficient reefer and pharmaceutical capacity, redundant energy supply, robust port infrastructure and industrial identification of components whose non-arrival would stop critical production.
Israel’s Export Structure Creates a Different Vulnerability from Its Import Structure
Israel’s high-value exports create less mass-shipping exposure than commodity-exporting economies, but they remain vulnerable to reliability and customer-service failure. High-technology manufacturing, chemicals, pharmaceuticals and precision products can frequently tolerate higher freight cost better than low-margin commodities, yet those sectors often depend on imported production inputs whose disruption can halt output before export transport becomes relevant.
The June 2026 CBS release shows that manufactured exports continue to be segmented heavily by technology intensity, while raw materials account for the largest share of import categories. CBS
The critical Israeli metric should therefore not be total containers delayed but production value exposed per unavailable input. This is particularly relevant to electronics, defence, medical technology, chemicals and advanced industrial systems, where a small missing component can have a disproportionate value-chain effect.
Germany: Maritime Risk Reaches the Core of the Export-Manufacturing Model
Germany exported approximately €1.563 trillion of goods and imported €1.363 trillion in 2025, generating a goods surplus of about €200.4 billion. China returned to being Germany’s largest goods trading partner with turnover of €251.8 billion, narrowly ahead of the United States at €240.5 billion. Destatis
Germany’s exposure is structurally different from Israel’s because the German economy combines very large industrial imports with an equally large manufacturing-export machine. Destatis reported that real exports of motor vehicles, machinery and chemical products weakened in 2025, while imports of machinery, electrical equipment, pharmaceuticals and food increased. Destatis
German seaports handled 284.4 million tonnes in 2025, including 171.1 million tonnes received from abroad and 103.7 million tonnes shipped abroad. Containerised or otherwise unidentified cargo represented 87.9 million tonnes, or 30.9% of total maritime throughput, fossil energy represented 40.5 million tonnes, ores and stone products 31.1 million tonnes, and chemicals 20.2 million tonnes. Destatis
Germany — Maritime-Industrial Exposure
| Indicator | 2025 value | Strategic meaning |
|---|---|---|
| Goods exports | €1,562.9bn | Very high export exposure |
| Goods imports | €1,362.5bn | Large upstream import requirement |
| Trade with China | €251.8bn | Strong Asian industrial linkage |
| German seaport freight | 284.4m tonnes | Large maritime physical base |
| Foreign inbound seaport freight | 171.1m tonnes | Input/energy import dependence |
| Containerised/unidentified cargo | 87.9m tonnes | High container-system dependence |
| Fossil-energy cargo | 40.5m tonnes | Maritime energy exposure |
| Chemical cargo | 20.2m tonnes | Direct exposure of chemical industry |
| Hamburg throughput | 99.8m tonnes | Major gateway concentration |
| Bremerhaven throughput | 46.9m tonnes | Automotive/container gateway importance |
Source: German Federal Statistical Office. Destatis
The industrial problem for Germany is therefore not simply whether Hamburg or Bremerhaven can handle additional ships, but whether Germany’s globally distributed automotive, machinery, chemicals, electronics and energy input system can maintain production when maritime reliability deteriorates simultaneously on Asian, Middle Eastern and Black Sea-connected routes.
Germany’s Green Transition Adds New Maritime Dependencies While Reducing Others
Energy transition does not abolish external dependence; it changes its composition. Germany can reduce dependence on imported hydrocarbons while increasing exposure to photovoltaic modules, batteries, power electronics and critical minerals.
The fact that 86.1% of German photovoltaic module and panel imports in the first five months of 2026 originated in China illustrates this substitution clearly. Destatis
The strategic challenge is therefore temporal: fossil-energy dependence remains material while green-technology import dependence rises, producing an overlap during which Germany must maintain both conventional fuel resilience and clean-technology supply-chain resilience.
Italy: Maritime Exposure Intersects with Manufacturing, Energy and a Rapidly Expanding Pharmaceutical Sector
Italy’s external trade generated a €50.7 billion merchandise surplus in 2025, with exports increasing 3.3% and imports 3.1%. The strongest positive export contributions came from pharmaceuticals, metals, non-automotive transport equipment and food/beverages. Pharmaceutical exports alone increased 28.5%. Istat
Italy is also unusually exposed to energy logistics because natural gas represented 36% of the Italian energy mix in 2024, the highest share among the larger EU industrial economies highlighted by Eurostat, while gas represented 37% of Italy’s energy imports. European Commission
The strategic issue is therefore dual. Northern industrial Italy depends on machinery, intermediate inputs and international manufacturing networks, while the national energy system remains deeply connected to imported hydrocarbons and Mediterranean infrastructure. Pharmaceuticals then add a third layer in which Italy has become both a major producer and a significant node inside wider European medicine supply chains.
Italy — Sectoral Maritime Exposure
| Indicator | Verified value/status | Strategic interpretation |
|---|---|---|
| Merchandise trade balance, 2025 | +€50.7bn | Export-oriented industrial economy |
| Export growth | +3.3% | Strong external market integration |
| Import growth | +3.1% | Continued external input demand |
| Pharmaceutical export growth | +28.5% | Rapidly expanding high-value trade node |
| Jan–Oct pharmaceutical export growth | +33.7% | Strong sector momentum |
| Jan–Oct pharmaceutical import growth | +44.6% | Demonstrates two-way supply-chain integration |
| Natural gas share of energy mix | 36% | Significant gas sensitivity |
| Gas share of Italian energy imports | 37% | Maritime/pipeline energy-system exposure |
| Trade balance excluding energy | Structurally much stronger than headline balance | Energy imports remain key external vulnerability |
Sources: Istat and Eurostat. Istat
The policy significance is that Italy should not treat its port strategy merely as a transport policy. Ports connect the country’s industrial north, Mediterranean energy system, pharmaceutical sector, food exports, machinery manufacturing and growing defence-industrial requirements.
France: Aerospace and Pharmaceuticals Turn Supply-Chain Reliability into High-Value Industrial Policy
France handled 333.4 million tonnes of maritime freight in 2025, an increase of 2.4% from 2024, although still 7.3% below the 2019 level. Statistiques Développement Durable
Its industrial exposure is concentrated in several strategically valuable sectors. France imported €711.4 billion of industrial goods and exported €638.6 billion in 2025, while manufactured-goods imports reached €659.5 billion and exports €614.6 billion. Insee
The aerospace and pharmaceutical sectors are especially revealing. French aircraft-related imports increased 24.6% to approximately €35.2 billion in 2025, partly because of increased imports of turbojet components from the United States and Mexico, while pharmaceutical imports increased 14.4% to €38.4 billion. Douane Française
These numbers show that even flagship domestic manufacturing sectors depend heavily on imported industrial inputs. Aerospace sovereignty, for example, does not mean that every engine component, electronic unit, alloy or subassembly is domestically produced; it means that France retains design, manufacturing and systems capabilities within a globally distributed production architecture.
France — High-Value Supply-Chain Exposure
| Indicator | 2025 | Strategic implication |
|---|---|---|
| Maritime freight | 333.4m tonnes | Large maritime physical exposure |
| Industrial-goods imports | €711.4bn | High external input dependence |
| Industrial-goods exports | €638.6bn | Major manufacturing-export system |
| Manufactured-goods imports | €659.5bn | Strong global industrial integration |
| Manufactured-goods exports | €614.6bn | High export exposure |
| Aerospace imports | €35.2bn | Internationalised aircraft supply chain |
| Aerospace import growth | +24.6% | Rapid increase in upstream dependency |
| Pharmaceutical imports | €38.4bn | Major healthcare-industrial exposure |
| Pharmaceutical import growth | +14.4% | Increasing international medicine integration |
| Energy goods balance | −€44.4bn | Continuing external energy vulnerability |
Sources: French Customs, Insee and French transport statistics. Douane Française
France therefore combines strong sovereign industrial capabilities with substantial external supply-chain dependencies. Its resilience advantage lies partly in diversified energy and industrial infrastructure; its vulnerability lies in the complexity of upstream production networks supporting aerospace, pharmaceuticals, chemicals, electronics and defence.
The United Kingdom: An Island Trading Economy with Exceptional Port and Deep-Sea Dependence
The United Kingdom’s geographic structure makes port resilience a foundational economic requirement. UK ports handled 428.3 million tonnes in 2025, including 237.5 million tonnes of imports and 98.6 million tonnes of exports; container tonnage increased 10% to 66.9 million tonnes, while deep-sea container imports reached 25.1 million tonnes, their highest level in the current series. GOV.UK
UK goods imports totalled £603.1 billion in 2025, substantially exceeding goods exports of £377.5 billion, while non-EU machinery and transport-equipment imports alone reached approximately £108.2 billion. Ufficio Nazionale di Statistica
The import exposure is not geographically uniform. Short-sea traffic with Europe represented 65% of international port tonnage in 2025, while deep-sea routes accounted for 35%; EU routes alone represented 52% of UK international port tonnage. GOV.UK
This gives the UK a distinctive resilience profile: European maritime links matter overwhelmingly for routine industrial and consumer flows, while deep-sea connectivity matters for energy, Asian manufactured goods, machinery, electronics and global commodities.
United Kingdom — Maritime and Goods-Trade Exposure
| Indicator | 2025 value | Strategic meaning |
|---|---|---|
| Total port freight | 428.3m tonnes | Very large island-economy maritime dependency |
| Major-port imports | 237.5m tonnes | Import-heavy physical trade |
| Major-port exports | 98.6m tonnes | Lower outward tonnage |
| Container cargo | 66.9m tonnes | High manufactured-goods exposure |
| Container growth | +10% | Increasing container-system importance |
| Goods imports | £603.1bn | Strong external material dependence |
| Goods exports | £377.5bn | Large but significantly lower than imports |
| Non-EU machinery/transport imports | ~£108.2bn | Critical industrial input exposure |
| EU share of international port tonnage | 52% | European short-sea dependence |
| Deep-sea container imports | 25.1m tonnes | Asian/global supply-chain exposure |
Sources: UK Department for Transport and Office for National Statistics. GOV.UK
UK Energy Resilience Has Improved in Some Areas but Remains Maritime
The UK’s domestic production and Norwegian pipeline access reduce some exposure compared with highly import-dependent continental economies, but LNG remains an important resilience source. In 2025 almost 74% of UK LNG imports originated in the United States, with US LNG shipments reaching 10.7 million tonnes, while Norway remained the largest overall natural-gas supplier once pipeline gas was included. GOV.UK
This diversification away from a single Middle Eastern LNG source reduces direct Hormuz exposure, but it does not remove maritime dependence: LNG terminals, Atlantic shipping availability and global gas-price transmission remain integral to UK energy security.
The European Union: Scale Provides Resilience but Also Creates Enormous Import Requirements
The EU’s principal resilience advantage is scale. A 27-state integrated market can draw upon multiple ports, energy terminals, manufacturing centres and transport corridors, allowing disruption at one gateway to be partially absorbed elsewhere. Rotterdam handled 397 million tonnes in 2024, Antwerp-Bruges 244 million tonnes and Hamburg 97 million tonnes, while numerous Mediterranean, Atlantic, Baltic and North Sea ports provide geographic redundancy. European Commission
Yet the same industrial scale creates extraordinary import requirements. Energy import dependency remained 57% in 2024, and external supply continued to dominate oil and natural gas. Net import dependence reached 96.6% for oil and petroleum products and 85% for natural gas. European Commission
The EU’s strategic business model therefore depends on maintaining simultaneous access to Atlantic energy suppliers, Mediterranean and Middle Eastern sources, Asian manufacturing networks, African raw materials and internal European industrial trade.
EU Strategic External Dependencies
| Domain | Verified exposure | Main resilience issue |
|---|---|---|
| Overall energy | 57.3% net import dependency | Persistent external exposure |
| Oil/petroleum | 96.6% net imported | Tanker and terminal dependence |
| Natural gas | 85.0% net imported | Pipeline/LNG infrastructure |
| China goods imports | €559.4bn | Manufacturing and electronics dependence |
| China electrical machinery | €164.9bn | High technology/systemic input concentration |
| China machinery | €106.5bn | Capital/intermediate-goods dependence |
| EU seaport freight | 3.4bn tonnes | Huge physical maritime footprint |
| Strategic raw materials | 2030 diversification benchmarks imposed | Current concentration remains material |
| Critical medicines | Official structural vulnerabilities recognised | Manufacturing and stockpiling challenge |
| Defence supply chains | Critical dependencies formally acknowledged | Readiness/ramp-up constraints |
Sources: Eurostat and European Commission. European Commission
Energy Exposure Remains the Largest Mass-Flow Vulnerability
European diversification since Russia’s invasion of Ukraine materially reduced direct dependence on Russian fossil energy, but it did not convert Europe into an energy-autonomous system. The supply geography shifted toward Norway, the United States, Algeria, the Middle East and other exporters.
In 2024, the United States provided 16% of EU oil and petroleum-product imports, Norway 12%, Kazakhstan 9%, Saudi Arabia 8%, and both the UK and Libya 6%. For gas, Norway supplied 30%, the United States 17%, while Algeria and Russia each represented 14%. European Commission
Diversification therefore creates a resilience gain against political dependence on a single source but simultaneously enlarges the maritime role of tankers and LNG carriers. Europe has exchanged part of a pipeline-concentration risk for a geographically broader portfolio in which maritime terminals, tanker availability, Atlantic routes and multiple producing regions matter more.
Chemicals Are the Hidden Connector Between Energy and Manufacturing
Chemicals warrant separate treatment because they transmit energy and logistics shocks throughout the rest of the industrial economy. Chemical production requires feedstocks and large energy inputs while supplying plastics, pharmaceuticals, fertilisers, coatings, explosives, automotive materials, electronics processing and numerous specialised industrial products.
EU ports handled chemicals, rubber, plastics and nuclear fuel equivalent to 7.2% of maritime freight tonnage in 2024, while chemicals generated the EU’s largest goods-trade surplus category in 2025, approximately €256.7 billion. European Commission
The dual status—as both a major physical maritime flow and one of Europe’s strongest export sectors—makes chemicals one of the clearest examples of upstream maritime disruption becoming downstream industrial and export risk.
Automotive Exposure Is No Longer Only About Imported Cars
The automotive supply chain increasingly integrates batteries, power electronics, semiconductors, magnets, sensors and software-controlled hardware alongside traditional engines, transmissions and mechanical components. As the sector electrifies, its maritime risk increasingly overlaps with China’s dominant position in electrical equipment and battery-related value chains.
Germany’s 2026 import data already show that 23.5% of imported battery-electric passenger cars came from China, while Germany also depends heavily on Chinese photovoltaic modules and numerous electrical products. Destatis
The strategic automotive question is therefore increasingly about imported component ecosystems rather than finished-vehicle imports. A vehicle assembled in Europe can still contain geographically concentrated cells, magnets, semiconductors and electronics, making resilience dependent on deeper supply-chain mapping.
Electronics Have the Highest Potential for Low-Mass, High-Value Disruption
Electronics combine three characteristics that make them especially important for maritime resilience analysis: high unit value, geographic concentration and widespread cross-sector use. Electrical machinery represented €164.9 billion of EU imports from China in 2025, while machinery added another €106.5 billion. European Commission
Some electronics can be moved by air when maritime routes fail, creating greater modal substitutability than crude oil or grain. However, air freight is neither economically nor physically capable of replacing the entire containerised electronics flow, particularly for lower-value assemblies, batteries, solar equipment, servers, motors and electrical systems.
The correct resilience approach is therefore segmentation: reserve expensive alternative transport for genuinely production-critical, high-value, low-mass components while maintaining larger maritime inventories of bulkier electrical products.
Food Resilience Depends on More Than National Agricultural Production
Food security requires distinguishing domestic food output from imported fertiliser, animal feed, edible oils, grain, packaging, refrigerated products and energy required to operate agricultural and food-processing systems.
EU ports handled agricultural, forestry and fishery products equivalent to 6.3% of total port tonnage in 2024, while food products, beverages and tobacco added another 4.9%. European Commission
France’s experience in 2025 demonstrates that even traditionally strong agricultural exporters can experience rapid trade deterioration: its agricultural and agri-food surplus fell by approximately €5 billion to only €0.2 billion, its lowest level in the reported series since at least 2000. Douane Française
The resilience implication is that agricultural capacity and maritime access complement each other. Domestic crops reduce dependence on imported food but cannot eliminate imported fertiliser, animal feed, energy and seasonally unavailable products.
Defence Industrial Ramp-Up Makes Civilian Maritime Resilience a Military Requirement
Europe’s ongoing defence-industrial expansion increases demand for metals, chemicals, electronics, propellants, explosives precursors, machinery, specialised alloys and energy. The European Commission estimated Member State defence expenditure at approximately €381 billion in 2025, 62.8% above 2020, while the EU Readiness Roadmap requires significantly expanded defence-production lines and reduced delivery times by 2030. Defence Industry and Space
The Commission has explicitly identified defence supply-chain resilience and reductions in non-EU dependencies for components and critical raw materials as an industrial priority. Defence Industry and Space
This creates a direct connection between commercial port resilience and military readiness. A defence factory cannot maintain higher ammunition, vehicle, missile, radar or drone output if its upstream chemical, metallurgical or electronic suppliers cannot receive imported inputs reliably.
Defence Supply-Chain Maritime Dependencies
| Defence production layer | Representative maritime-dependent inputs | Failure consequence |
|---|---|---|
| Ammunition | Metals, chemical precursors, energetics inputs | Reduced output |
| Missiles | Electronics, propulsion chemicals, specialty metals | Delivery delays |
| Armoured vehicles | Steel/alloys, engines, electronics | Assembly disruption |
| Drones | Motors, chips, batteries, optics | Production bottlenecks |
| Air defence | Radar electronics, semiconductors, specialised components | Systems delivery constraint |
| Naval construction | Steel, electronics, engines, specialist machinery | Construction delays |
| Aerospace | Engines, alloys, avionics, composite inputs | Long lead-time expansion |
| Communications | Chips, RF components, batteries | Capability degradation |
The interaction between defence demand and civilian industrial demand can itself generate competition for scarce maritime capacity and critical inputs during crisis periods.
Country Comparison: Different Economies Face Different Maritime Failure Modes
The six jurisdictions should not be described with one generic European risk label because their exposure structures differ substantially.
Comparative Maritime-Industrial Resilience Matrix
| Jurisdiction | Dominant exposure | Structural strength | Principal vulnerability | Five-year resilience priority |
|---|---|---|---|---|
| Israel | Raw materials, machinery, Asian imports, fuel, critical goods | Rapid commercial adaptation; high-value economy | Small geography and limited alternative land corridors | Strategic stocks, route redundancy, port continuity, critical-component mapping |
| Germany | Machinery, autos, chemicals, Chinese industrial inputs, energy | Huge diversified industrial base and major ports | Complex global supplier networks | Supplier diversification and Asian input resilience |
| Italy | Energy, machinery, pharma, food, Mediterranean trade | Central Mediterranean geography and manufacturing clusters | Gas exposure and fragmented port/industrial corridors | Port-logistics integration, energy diversification, pharma/industrial continuity |
| France | Aerospace, pharma, chemicals, energy and industrial imports | Nuclear energy, multiple major ports, strong strategic industries | High-value multinational supply chains | Upstream aerospace/pharma mapping and port redundancy |
| United Kingdom | Imported goods, machinery, energy, containers | Atlantic geography, North Sea links, strong ports | Island dependence and high goods deficit | Deep-sea/short-sea redundancy and critical imports strategy |
| European Union | Energy, China industrial inputs, raw materials | Scale, multiple gateways, integrated internal market | External upstream concentration | Diversification, domestic processing, strategic stocks and transport redundancy |
This table does not constitute a ranking of national resilience. Each state combines different exposure mechanisms with different compensating capabilities, and a single numerical score would obscure rather than clarify those distinctions.
Concentration Risk Matters More Than Aggregate Import Dependency
A country can import a large proportion of an input without facing acute strategic risk when the product is widely available from many interchangeable suppliers. Conversely, a modest import share can be dangerous when production depends on one supplier, one qualification, one route or one specialised plant.
The EU’s Critical Raw Materials Act implicitly recognises this distinction through its target that no more than 65% of annual consumption of each strategic raw material at a relevant processing stage should originate from a single third country. European Commission
The same logic should extend beyond critical minerals to industrial components, medicines, electronics and chemicals. A five-year maritime resilience assessment should therefore map concentration × substitutability × transport dependence × inventory cover × time-to-qualification, rather than simply measuring annual import value.
Decision-Relevant Dependency Test
| Question | Low resilience | Higher resilience |
|---|---|---|
| Number of qualified suppliers | One/few | Several |
| Supplier geography | Same region | Multiple regions |
| Maritime route | Same chokepoint | Multiple viable routes |
| Transport mode | Maritime only | Air/rail/road substitute for critical volumes |
| Inventory cover | Days | Weeks/months where economically justified |
| Replacement qualification | Months/years | Pre-qualified alternative |
| Port dependency | One gateway | Multiple capable gateways |
| Equipment requirement | Specialised and scarce | Interchangeable |
| Domestic capacity | None | Partial backup |
| Recycling/recovery | Negligible | Material |
| Demand flexibility | Fixed | Temporarily reducible |
| Strategic stock | None | Defined buffer |
Five-Year Resilience Will Be Determined by Whether Europe Converts Policy Targets into Physical Capacity
The European policy architecture is increasingly aligned with the problem. The Critical Raw Materials Act has set quantified 2030 targets; critical-medicine policy is moving toward diversification, manufacturing and stockpiling; the European Defence Industrial Strategy explicitly requires resilient supply chains; and port infrastructure remains embedded in the functioning of the Single Market. European Commission
The remaining uncertainty concerns execution. A target for 40% domestic processing of strategic raw materials has no resilience value until mines, refineries, processing plants, energy infrastructure and logistics exist. A pharmaceutical strategic project provides no immediate protection until qualification, production capacity and commercial output materialise. Defence industrial investment cannot shorten delivery times if the relevant component bottleneck remains offshore.
The relevant horizon to 2031 is therefore best understood as a race between increasing geopolitical fragmentation and increasing redundancy.
The Most Important Five-Year Indicators Are Physical, Not Political
Monitoring speeches, strategic documents and investment announcements is insufficient because industrial resilience only improves once physical capacities become operational.
Five-Year Strategic Resilience Dashboard
| Indicator | Current anchor | Improvement signal | Deterioration signal |
|---|---|---|---|
| EU energy import dependency | 57.3% in 2024 | Declining without loss of reliability | Rising concentration |
| EU oil import dependence | 96.6% | Diversified suppliers and lower oil intensity | New concentrated supplier dependence |
| EU gas import dependence | 85.0% | Greater diversified supply/domestic substitutes | LNG or pipeline concentration |
| China share in critical industrial imports | High in electronics/machinery | Broader sourcing and EU capacity | Greater concentration |
| CRM extraction target | 10% by 2030 | Projects enter production | Projects delayed |
| CRM processing target | 40% by 2030 | European refining increases | Continued offshore concentration |
| CRM recycling target | 25% by 2030 | Commercial recycling scale | Insufficient feedstock/capacity |
| Single-country CRM ceiling | 65% | Dependencies move below threshold | Persistent >65% dependence |
| EU critical medicine capacity | Vulnerabilities officially recognised | Strategic projects operational | New shortages/concentration |
| Defence supply-chain mapping | Being expanded | Identified bottlenecks mitigated | Ramp-up constrained by inputs |
| EU seaport throughput | 3.4bn tonnes baseline | Multiple gateways retain capacity | Port concentration/congestion |
| Israel Asian maritime imports | ~$20bn 2023 baseline | Supplier/route diversification | Greater critical dependence |
| German China trade | €251.8bn in 2025 | Lower critical-input concentration | Dependence rises in key components |
| UK deep-sea container imports | 25.1m tonnes 2025 | Capacity and gateway diversification | Concentration at limited terminals |
| France aerospace/pharma inputs | Strong import growth | Greater upstream diversity | Single-country component concentration |
| Italy pharmaceutical trade | Rapid expansion | Broader supplier/manufacturing base | Growth accompanied by concentrated inputs |
Sources: Eurostat, European Commission, Bank of Israel, Destatis, UK DfT, French Customs and Istat. European Commission
A Five-Year Resilience Framework Requires Separating Four Different Outcomes
A binary distinction between “resilient” and “not resilient” is analytically inadequate because industrial systems can absorb disruptions in several different ways.
Absorption
Existing inventories, spare shipping capacity and alternative commercial routes allow production to continue without structural change. Israel’s initial response to Red Sea disruption provides evidence of this mechanism because Asian imports remained comparatively resilient despite much longer voyages. kamakama.gov.il
Adaptation
Companies increase inventories, modify shipping routes, use alternative ports, source new suppliers or adjust production schedules. Costs rise, but the industrial system continues operating.
Substitution
External inputs are replaced with domestic or geographically diversified production, recycling or technologically different materials. This is the objective behind much of the Critical Raw Materials Act. Mercato Interno e PMI
Transformation
The structure of the industrial system itself changes: factories relocate, energy systems shift, suppliers cluster nearer final production, port infrastructure expands and strategic inventories become embedded in normal operating models.
The five-year outcome will depend increasingly on substitution and transformation because repeated shocks make indefinite reliance on emergency adaptation progressively more expensive.
Inventory Will Become a Strategic Balance-Sheet Variable
For several decades, companies were rewarded for reducing inventories because low stocks reduced capital requirements and warehouse costs. Persistent maritime uncertainty changes that optimisation problem.
For commodities available from several suppliers, large stocks may still be economically inefficient. For a €5 component capable of stopping a €50,000 industrial product, the economics are completely different. The appropriate strategic inventory is therefore determined less by unit value than by production criticality and replacement lead time.
Inventory Segmentation for Maritime Resilience
| Input class | Example | Appropriate resilience approach |
|---|---|---|
| High-volume, easily substitutable | Basic packaging | Multiple suppliers; limited stock |
| High-volume, route constrained | Fuel/feedstock | Diversified terminals and strategic reserves |
| Low-value, production critical | Specialised connector | Large relative safety stock |
| High-value, low-mass | Semiconductor | Stock plus emergency airfreight |
| Perishable | Food/biologics | Route and cold-chain redundancy |
| Regulated | Pharmaceutical API | Qualified alternative supplier plus inventory |
| Long lead-time | Machine tool component | Advance procurement and repair spares |
| Defence critical | Energetic/electronic component | Strategic inventory and domestic capability |
This framework avoids the economic inefficiency of stockpiling everything while recognising that the absence of a cheap but irreplaceable component can have catastrophic production consequences.
Ports Should Be Treated as Industrial Platforms Rather Than Transport Terminals
The traditional measure of port success—annual tonnage or TEU handled—does not fully capture strategic resilience. A port capable of handling containers but not LNG cannot substitute for an LNG terminal; a deep-water container terminal cannot automatically receive specialised bulk cargo; a port with physical capacity but inadequate rail connections may move congestion inland rather than solve it.
The relevant capability catalogue includes berth depth, cranes, reefer plugs, storage, dangerous-goods handling, energy terminals, rail connectivity, road access, customs capacity, cyber resilience, dredging, labour, repair services and ability to absorb diverted ships.
Europe’s advantage is the presence of multiple large maritime clusters—Rotterdam, Antwerp-Bruges, Hamburg and numerous Mediterranean and Atlantic gateways—but the resilience value depends on whether inland infrastructure can redistribute traffic when a primary port becomes constrained. European Commission
The Emerging Business Model Is Not Deglobalisation but Selective Redundancy
The evidence does not support a conclusion that global maritime trade is being replaced by national self-sufficiency. Germany still trades more than €250 billion annually with China, EU imports from China exceeded €559 billion in 2025, UK deep-sea container imports reached a record level, and European ports continue to handle billions of tonnes of international freight. Destatis
The emerging model is instead selective redundancy. Firms and states retain global trade where its efficiency advantages remain overwhelming but invest in alternatives for inputs whose disruption would impose unacceptable economic or security costs.
That distinction matters because attempting to localise every supply chain would impose enormous economic costs, while leaving every supply chain optimised solely for peacetime efficiency would expose critical production to avoidable strategic failure.
The Five-Year Exposure Is Highest Where Four Conditions Coincide
The most strategically vulnerable business chains are those in which:
- the input is essential to production;
- supply is geographically concentrated;
- shipment depends on one or a small number of maritime corridors;
- substitution or qualification requires months or years.
Critical minerals, selected pharmaceuticals, specialised defence inputs, electronic components, battery materials and some chemicals frequently meet several of these conditions simultaneously.
Bulk consumer products may experience larger freight-rate effects but can often be substituted more rapidly. The distinction between price vulnerability and availability vulnerability is therefore essential.
Price Shock Versus Availability Shock
| Category | Price shock sensitivity | Availability shock sensitivity |
|---|---|---|
| Crude oil | Very high | High but globally fungible to a degree |
| LNG | Very high | High because infrastructure constrains substitution |
| Grain | High | Moderate/high regionally |
| Generic consumer goods | Moderate | Usually moderate |
| Semiconductor | Moderate freight sensitivity | Very high production criticality |
| Pharmaceutical API | Moderate freight sensitivity | Potentially very high |
| Rare-earth magnet | Moderate transport cost | Very high for relevant manufacturing |
| Defence energetic precursor | Transport cost often secondary | Very high |
| Automotive electronic module | Low freight share of final vehicle | Very high |
| Specialised machine component | Low freight share | Potentially very high |
Strategic Resilience Is Increasingly a Balance Between Efficiency and Optionality
The fundamental economic trade-off over the next five years will be between efficiency under normal conditions and optionality under disrupted conditions.
A single Asian supplier accessed through one maritime corridor is often cheaper than maintaining two geographically separated qualified suppliers. A single central warehouse is cheaper than several regional stock points. Just-in-time inventory is cheaper than large strategic stocks. One highly utilised port may be cheaper than maintaining spare gateway capacity.
Each efficiency gain, however, eliminates an option.
The appropriate industrial-resilience strategy is therefore not maximum redundancy but sufficient optionality to keep critical economic functions operating when normal trade geometry breaks down.
Decision-Relevant Country Matrix to 2031
| Jurisdiction | Critical near-term exposure | Medium-term opportunity | Watch threshold |
|---|---|---|---|
| Israel | Imported raw materials and machinery; Asian critical goods | Build highly targeted stocks and dual-route supply structures | Persistent shortages or increased supplier concentration |
| Germany | China-linked industrial inputs; machinery/autos/chemicals | Diversify Asian suppliers while preserving export competitiveness | Critical China dependence increases despite diversification policy |
| Italy | Energy plus manufacturing and pharmaceuticals | Mediterranean logistics hub and pharma/defence industrial expansion | Gas or critical-input diversification stalls |
| France | Aerospace/pharma inputs and energy | Use diversified ports and strategic manufacturing policy | Upstream aerospace/pharma concentration rises |
| UK | High goods-import dependence and deep-sea container flows | Atlantic diversification and strong port investment | Major terminal or energy-source concentration |
| EU | Energy, CRM, medicines, electronics, defence inputs | Scale internal processing, recycling and common procurement | 2030 CRM/medicine/defence capacity projects slip materially |
Key Judgments
Maritime transport should now be understood as industrial infrastructure rather than a downstream logistics service because the production of European machinery, pharmaceuticals, vehicles, defence systems, chemicals and electronics depends upon inputs that frequently cross maritime borders before final manufacture takes place.
The EU’s vulnerability is not primarily excessive trade itself but concentrated upstream dependencies embedded inside otherwise diversified trade, particularly in energy, critical raw materials, Chinese electrical and mechanical equipment, selected pharmaceutical chains and defence components. The Critical Raw Materials Act, medicine-supply initiatives and defence-industrial policy all increasingly acknowledge this structural problem. European Commission
Israel faces the highest geographic constraint among the jurisdictions examined because alternatives to maritime import supply are intrinsically limited, yet the Bank of Israel evidence from the initial Red Sea shock demonstrates that commercial networks can absorb very large route changes without proportional deterioration in import availability. kamakama.gov.il
Germany’s exposure is dominated by the interaction between a highly globalised manufacturing base and concentrated Asian inputs; Italy combines energy dependence with expanding pharmaceutical and industrial exports; France combines strong sovereign industrial capabilities with substantial aerospace, pharmaceutical and energy import requirements; and the United Kingdom combines island geography, a large goods deficit and exceptionally large port flows with strong Atlantic and European connections. Destatis
The EU’s strongest resilience asset is gateway and industrial diversification at continental scale, while its principal weakness is that many strategic value chains still depend on inputs extracted, processed or manufactured outside Europe. European Commission
Over the next five years, the most important shift is unlikely to be wholesale reshoring. The more defensible expectation is selective duplication of critical suppliers, larger targeted stocks, greater recycling, expansion of domestic processing, additional port and energy-terminal redundancy, and deeper mapping of industrial dependencies.
What Would Change the Assessment
The assessment would improve materially if the EU demonstrates sustained progress toward its 10% extraction, 40% processing and 25% recycling targets for strategic raw materials, while simultaneously reducing individual third-country concentration below the 65% ceiling for materials currently dominated by single suppliers. European Commission
A significant expansion of European semiconductor, battery-material, active-pharmaceutical-ingredient and defence-component capacity would further reduce the number of production chains in which maritime interruption of a geographically concentrated supplier creates an availability crisis rather than a manageable price increase.
For Israel, the assessment would strengthen if official or auditable industrial mapping demonstrates that the most production-critical imported inputs are covered by either sufficient domestic inventories, multiple origin countries, multiple maritime service options or prequalified substitutes. It would weaken if raw-material and machinery import concentration increases while regional maritime risk remains elevated.
For Germany, sustained reduction of critical single-country Asian dependencies without deterioration in manufacturing competitiveness would be the most important positive indicator. For Italy and France, pharmaceutical, aerospace and defence growth should be evaluated against the diversification of their upstream materials and component bases rather than export growth alone.
For the United Kingdom, resilience would improve with continued diversification of energy suppliers, maintenance of spare deep-sea port capacity and reduced single-terminal concentration for strategically important cargo classes.
Open Official Record
A decisive information gap remains across all countries: governments possess increasingly detailed statistics on what is imported and from where, but publicly available datasets much less frequently show which imported input is indispensable to which domestic production line, how many days of inventory are held, how long alternative qualification requires and which maritime route physically carries the material.
This is the difference between trade statistics and strategic supply-chain intelligence.
The European defence authorities have explicitly acknowledged that understanding of defence supply-chain composition and dependencies remains incomplete, while the Critical Medicines Alliance has similarly identified data limitations affecting assessment of medicine vulnerabilities. Defence Industry and Space
The most valuable next generation of resilience measurement would therefore integrate customs data, port flows, corporate supplier information, inventory cover, input-output production relationships, supplier concentration, route dependence and substitution lead times at product level.
Without that integration, aggregate trade values can identify broad exposure but cannot determine whether interruption of a specific €10 million imported component flow threatens €100 million, €1 billion or €10 billion of downstream production.
The public record nevertheless supports a firm strategic conclusion: the decisive industrial question is no longer whether Israel or Europe participates in global maritime trade, but which parts of their economies can continue functioning when a normally reliable maritime connection suddenly becomes expensive, irregular or unavailable.
That distinction will determine whether the maritime system remains merely an efficiency mechanism for global business or becomes one of the principal constraints on industrial sovereignty through 2031.


