

















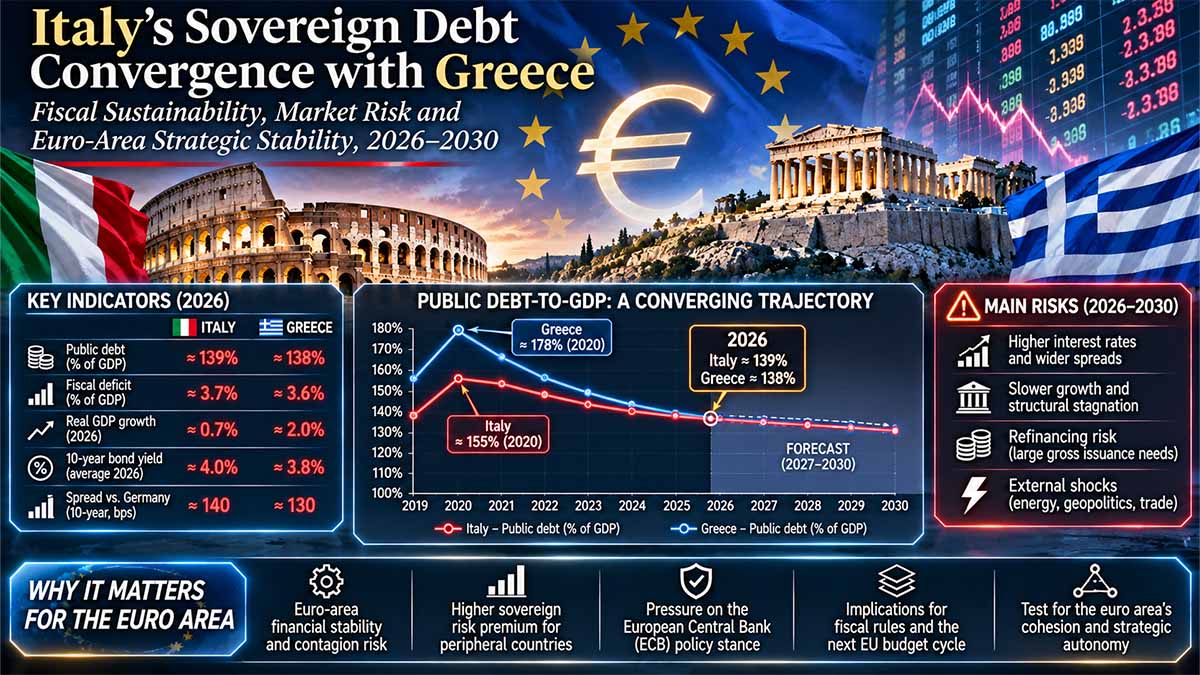
Geographic and institutional scope: Italy and Greece, assessed against the euro area and European Union, with particular attention to France, Germany and the United Kingdom; historical fiscal dynamics from 2022 to 2026, the latest available official evidence, and conditional sovereign-risk pathways through 2030.
Executive Summary — Bottom Line Up Front
Principal judgment — High confidence. Italy is approaching a significant statistical threshold: overtaking Greece as the European Union’s most indebted sovereign relative to gross domestic product. Eurostat’s 21 October 2026 release places Greek general-government gross debt at 140.8% of GDP, against 139.9% for Italy, a difference of only 0.9 percentage points. The narrowing reflects divergent debt trajectories, not equivalent sovereign-credit structures. Government debt at 88.8% of GDP in euro area — Eurostat — Oct 2026.
Fiscal divergence. Between the second quarters of 2025 and 2026, Greece reduced its debt ratio by 11.2 percentage points while Italy’s increased by 2.2 points. The resulting 13.4-point differential in annual movements constitutes a substantially more important indicator than the approaching reversal of their ranking.
Debt-stock asymmetry. Italy’s €3.209 trillion general-government debt stock is approximately 8.95 times Greece’s €358.647 billion. Italy’s debt is predominantly financed through marketable securities; Greece retains an exceptional official-creditor architecture, extended maturities and concessional financing inherited from successive adjustment programmes.
Refinancing asymmetry. Greece’s Public Debt Management Agency reports a weighted-average general-government debt maturity of 18.23 years at 30 June 2026. This substantially delays the transmission of market-rate changes to aggregate debt-service costs. Italy’s greater dependence on market refinancing creates a structurally different interest-rate transmission mechanism. General Government Debt Parameters — Greek Public Debt Management Agency — 2026.
Italian fiscal constraint. The European Commission’s May 2026 forecast identified weak real growth, an unfavourable interest-growth differential and continuing stock-flow adjustments associated with housing-renovation tax credits as principal sources of upward pressure on Italy’s debt ratio. Primary surpluses alone may therefore prove insufficient to establish a declining debt trajectory.
Greek fiscal advantage. The Commission’s May forecast projected continued Greek general-government surpluses, stronger real expansion and a reduction in the debt ratio to 134.4% by 2027. That forecast predates the latest quarterly evidence and must not be interpreted as a mechanically updated November projection.
Systemic implication. Italy’s fiscal position matters disproportionately to the euro area’s financial architecture because of the scale of its outstanding liabilities, banking-system exposures, sovereign-bond market and industrial economy. A reversal in the Italian–Greek ranking would be symbolically important but would not itself demonstrate a deterioration in Italy’s ability to service debt.
Decisive uncertainty. The principal question is whether Italy can generate a sufficiently strong and persistent primary balance, supported by nominal GDP expansion, to offset effective interest expenditure and residual debt-increasing stock-flow adjustments after the Recovery and Resilience Facility investment cycle.
Policy implication. Sovereign-risk monitoring should prioritise the annual debt decomposition, gross financing requirements, debt-maturity structure, primary-balance execution, nominal-growth composition and the credibility of the medium-term fiscal framework rather than the bilateral debt-ratio ranking.
Italy Is Catching Greece on Public Debt. But the Real Risk Is Europe’s Financing Model
Italy is approaching a politically uncomfortable milestone: overtaking Greece as the European Union’s most indebted sovereign. Yet the ranking conceals a more consequential divergence. Greece has reduced its debt burden through stronger nominal growth, fiscal surpluses and exceptional long-term European financing, while Italy remains dependent on financial markets to refinance a debt stock exceeding €3.2 trillion. Rome’s October 2026 fiscal programme promises debt reduction after 2027, even as interest expenditure rises and defence, energy security and industrial investment compete for limited budgetary resources. The European Union faces a corresponding contradiction: it is demanding greater strategic capacity from member states whose ability to finance it differs sharply. The real question is not which country reaches the top of the debt ranking, but whether Europe can preserve fiscal credibility while financing its security and industrial ambitions.
Greece’s debt falls while Italy’s financing burden keeps growing
The figures published by Eurostat on 21 October 2026 leave little room for ambiguity. At the end of the second quarter, Greek general-government gross debt stood at 140.8% of GDP and Italy’s at 139.9%, against 88.8% for the euro area and 82.9% for the European Union. The bilateral difference was just 0.9 percentage points. Between June 2025 and June 2026, Greece reduced its ratio by 11.2 points while Italy’s increased by 2.2 points. A comparison of the revised annual series is more revealing: Greece moved from 177.8% in 2022 to 145.4% in 2025, whereas Italy went from 138.4% to 136.7%. The convergence is therefore not merely the result of quarterly Treasury operations. It reflects opposing fiscal trajectories.
The monetary amounts expose the asymmetry. In June 2026, Italian public debt reached €3,208.524 billion, approximately nine times Greece’s €358.647 billion. Between December 2022 and June 2026, Italy’s outstanding liabilities increased by €332.455 billion, while Greece’s declined by €9.358 billion. But the ratio depends on economic output as well as borrowing. Between 2022 and 2025, Italian nominal GDP increased by approximately 13.3%, compared with 20.6% in Greece. The stronger Greek denominator, combined with improving fiscal balances, produced debt reduction that Italy could not replicate. Eurostat’s October 2026 fiscal notification consequently reveals a divergence in economic and fiscal capacity, not simply in budgetary discipline.
The difference is especially apparent in 2025. Italy recorded a general-government deficit of €69.736 billion, but its gross debt increased by €129.260 billion. The resulting €59.524 billion stock-flow adjustment demonstrates why deficit figures alone cannot explain debt accumulation. Greece recorded a €4.935 billion government surplus and reduced its nominal debt by €1.965 billion. These accounting relationships matter more than the bilateral ranking: Italy must finance obligations that extend beyond its contemporaneous deficit, while Greece benefits from a stronger combination of nominal growth and fiscal performance.
Greece’s rescue loans created an advantage Italy cannot reproduce through bond markets
The two sovereigns have radically different debt architectures. Greece’s public finances still reflect the financing arrangements created during the European sovereign-debt crisis. Between 2010 and 2018, the country received €288.7 billion in cumulative official assistance, including €141.8 billion through the European Financial Stability Facility and €61.9 billion through the European Stability Mechanism. These historical disbursements are not the current outstanding balance, but their contractual legacy remains decisive. EFSF lending carries an average maturity of approximately 42.45 years, while ESM financing averages 32.35 years, with repayments extending into the second half of the century. European Stability Mechanism — Greece Financial Assistance.
At 30 June 2026, Greece’s Public Debt Management Agency reported a weighted-average debt maturity of 18.23 years and an annual cash interest-service cost of 1.94% when deferred EFSF interest was included. These are portfolio-specific measures, not the yields available on newly issued Greek bonds. The distinction is fundamental: higher market rates affect long-duration fixed-rate liabilities gradually. Greece also held €31.100 billion in reported general-government cash reserves, providing a liquidity buffer that must be considered alongside gross liabilities.
Italy relies predominantly on marketable government securities. Its average residual debt maturity was approximately 7.9 years at the end of 2024, according to the Bank of Italy. Although the Italian and Greek maturity observations refer to different dates, their structural divergence is unmistakable. Italy must continuously refinance a vastly larger stock through financial markets. A sustained increase in issuance yields therefore reaches its budget progressively through maturing securities, new borrowing and the cost of refinancing. Greece’s official-creditor arrangements slow that transmission. Similar debt ratios do not imply similar interest burdens, repayment schedules or liquidity risks.
The Superbonus is still affecting debt after the spending was recorded
Italy’s fiscal problem is complicated by the accounting legacy of residential-renovation incentives. Under the European statistical treatment of payable tax credits, expenditure can be recognised when the entitlement arises, while the resulting cash-financing effect occurs over subsequent years as credits are utilised. Consequently, an improvement in the reported deficit does not necessarily produce an equivalent reduction in gross borrowing. Italy can be recording smaller deficits while still financing obligations generated by earlier policy decisions.
The government’s October 2026 fiscal programme, analysed by Morningstar DBRS on 16 October, estimates additional borrowing associated with housing tax credits, including Superbonus and façade incentives, equivalent to 1.9% of GDP in 2026 and 1.1% in 2027, before declining to approximately 0.2% annually in 2028–2029. These are projected financing effects, not newly authorised expenditure or the entire historical cost of the schemes. Their decline is nevertheless central to the government’s expectation that debt will peak in 2027.
That expectation must absorb another pressure. The October programme projects interest expenditure rising from 4.2% of GDP in 2026 to 4.7% in 2029. The government anticipates debt declining from 138.5% of GDP in 2027 to 136.6% in 2029, despite an overall deficit projected at 3.4% in 2027 and 3.2% in 2028. Achieving that combination requires primary fiscal improvement, sufficient nominal GDP growth and a substantial reduction in debt-increasing stock-flow adjustments. The risk is not that every forecast will necessarily fail, but that several favourable assumptions must hold together.
European fiscal flexibility permits spending but does not finance it
Italy’s fiscal commitments are governed by the European economic-governance framework introduced through Regulation (EU) 2024/1263. The Council-endorsed expenditure path permits annual net-expenditure growth of 1.6% in 2026, 1.9% in 2027, 1.7% in 2028 and 1.5% in 2029. Compliance is assessed through a defined net-expenditure indicator rather than total public spending or gross debt issuance. In June 2026, the European Commission concluded that Italy had taken effective action under its excessive-deficit procedure, allowing that procedure to remain in abeyance, not to be terminated. Council Recommendation C/2026/3925.
The institutional contradiction becomes sharper with defence and energy security. Rome’s October programme envisages additional expenditure of approximately 0.3% of GDP in each of 2027 and 2028 under exceptional fiscal flexibility. But the proposed use of an escape clause is not equivalent to an unconditional exemption, and permission to deviate from an expenditure trajectory does not eliminate the financing requirement. Governments still have to raise revenue, issue debt or reallocate resources to pay for security-related commitments. The Council’s national escape-clause framework distinguishes these legal conditions from the economic cost of the expenditure itself.
The consequences reach industrial policy. Defence procurement, energy infrastructure and productive investment can create long-term economic and security benefits, but they also compete with pensions, healthcare, existing capital programmes and debt servicing. The European Union’s €150 billion Security Action for Europe instrument, SAFE, offers long-term loans for eligible defence investment and joint procurement; it does not provide unconditional grants or cancel national liabilities. Greece received an initial SAFE payment of €118.2 million in July 2026 against an allocation of €787.7 million. The facility changes financing terms for eligible expenditure, not the underlying requirement to repay borrowed capital.
The same distinction applies to the Recovery and Resilience Facility. The European Commission’s October 2026 annual report recorded approximately €450 billion disbursed across the Union, or 79% of the facility’s envelope, with 32 remaining payment requests worth €123 billion under assessment. The completion of milestones and targets by 31 August 2026 and the final payment deadline of 31 December 2026 mark the end of an exceptional financing cycle. Governments must now preserve productive investment without assuming that an equivalent European instrument will automatically replace it.
A sovereign repricing would travel from the Treasury into Europe’s banks and industry
Italian sovereign bonds are not only government liabilities. They are also assets held by banks, insurers and institutional investors, instruments used in collateralised financing and reference securities for domestic credit conditions. A sustained increase in Italian yields can therefore affect securities valuations, wholesale funding, collateral values and the cost of financing businesses. The European Central Bank’s May 2026 Financial Stability Review identified rising sovereign financing requirements, higher term premia and geopolitical uncertainty as sources of financial vulnerability. It also reported that aggregate Eurosystem liquidity had fallen by more than €2 trillion, approximately 45%, from its 2022 peak.
Italy’s banks are not in the condition they faced during the earlier sovereign crisis. Morningstar DBRS reported a non-performing-loan ratio of 1.9% in the second quarter of 2026, stronger capitalisation and improved profitability. On 16 October, the agency affirmed Italy at A (low), Stable, while recognising weak potential growth and rising interest costs as constraints. Greece’s investment-grade standing and longer official financing horizon reflect a different combination of strengths and risks. Morningstar DBRS — Italy Sovereign Rating, October 2026.
The ECB’s Transmission Protection Instrument, announced in July 2022, provides conditional capacity to address unwarranted and disorderly market dynamics threatening monetary-policy transmission. It is not an automatic guarantee of Italian yields. Its application depends on the Governing Council’s assessment of market conditions, debt sustainability and relevant fiscal commitments. That distinction matters for France, Germany and the wider euro area: Italian sovereign stress could transmit through financial institutions and industrial financing, but its treatment would depend on whether the market movement represented unjustified fragmentation or a repricing supported by fiscal fundamentals.
The next 24 months will determine whether consolidation protects investment or displaces it
The International Monetary Fund’s July 2026 Article IV assessment projected Italian debt declining only gradually, from 138.2% of GDP in 2026 to 136.3% in 2030 under its baseline. Its recommended adjustment path produced a lower 2030 ratio of 132.5%, illustrating the fiscal significance of stronger consolidation. A separate conditional scenario in the sovereign-risk assessment produces an Italian ratio of approximately 135.2% in 2030 under baseline assumptions, 153.8% under adverse conditions and 123.0% if stronger growth and primary surpluses are sustained. These are alternative arithmetic outcomes, not official forecasts or assigned probabilities.
Over the next 12–24 months, the central test will be whether Italy can maintain primary surpluses, contain refinancing costs and convert Recovery and Resilience Facility investments into measurable productivity gains while the projected housing-tax-credit financing burden declines. The cost of inaction would not fall exclusively on the Treasury. Higher sovereign funding costs could reach banks through securities and collateral valuations, businesses through credit conditions, households through weaker employment and income growth, and public services through tighter budget allocations. Defence manufacturers and infrastructure operators would face the consequences of delayed or reduced investment, while European partners would absorb part of the financial and industrial transmission.
Italy may overtake Greece even if its own debt ratio begins to decline. That would be a statistical reversal, not proof of an imminent fiscal crisis. The more consequential outcome would be a prolonged period in which interest expenditure absorbs an increasing share of public resources while productivity remains too weak to restore fiscal flexibility. The economic cost of that trajectory would be measured not by Italy’s position in a European debt ranking, but by the investment, industrial capacity and security expenditure that its public finances could no longer sustain.
Navigational Index
Pillar I — Sovereign Debt Arithmetic, Structural Divergence and Fiscal Capacity
Chapter 1 — The Italian–Greek Debt Convergence: Statistical Evidence, Historical Evolution and Sovereign Debt Dynamics, 2022–2026 : Reconstruction of the official debt series, differences between quarterly and annual observations, nominal GDP effects, primary balances, interest-growth differentials, stock-flow adjustments and the arithmetic conditions under which Italy could overtake Greece.
Chapter 2 — Two Sovereign Debt Architectures: Official Creditors, Market Financing, Maturity Profiles and Refinancing Vulnerability : Comparison of creditor composition, official-sector support, refinancing schedules, average maturity, effective interest costs, cash reserves and the sensitivity of debt-service expenditure to market rates.
Chapter 3 — Growth, Productivity and Fiscal Capacity: Italy’s Structural Constraints and Greece’s Post-Crisis Adjustment : Investigation of real and nominal GDP performance, productivity, investment, demographic pressures, labour participation, inflation, fiscal multipliers and the effectiveness of public capital expenditure.
Pillar II — European Fiscal Governance, Financial Stability and Geopolitical Transmission
Chapter 4 — Fiscal Policy, Superbonus and the Reformed European Economic Governance Framework : Assessment of the relationship between accrued deficits, cash payments, tax-credit utilisation and the debt stock; Italy’s fiscal-structural commitments; net-expenditure ceilings; excessive-deficit procedures; and the interaction between domestic political constraints and European surveillance.
Chapter 5 — Sovereign-Bond Markets, Rating Agencies and the Bank–Sovereign Nexus : Analysis of Italian and Greek sovereign spreads, debt issuance, investor composition, rating-agency methodologies, banking exposures, European Central Bank transmission instruments and possible financial-stability feedback mechanisms.
Chapter 6 — The Geopolitics of Sovereign Debt: Italy, Greece and the Distribution of Economic Power Within Europe : Examination of Eurogroup coordination, institutional credibility, the differences between the Greek sovereign-debt adjustment framework and Italy’s market-based financing, and consequences for France, Germany, the United Kingdom, European industrial policy, energy security, defence financing and Mediterranean strategic interests.
Pillar III — Forward Sovereign-Risk Assessment and Policy Response
Chapter 7 — Debt Sustainability to 2030: Baseline, Adverse and Reform Scenarios : Construction of reproducible annual debt projections, explicit assumptions for primary balances, interest rates, real growth, GDP deflators and stock-flow adjustments; sensitivity analysis; alternative hypotheses; and assessment of the conditions for a temporary or persistent Italian–Greek ranking reversal.
Chapter 8 — Fiscal and Strategic Policy Options: Debt Stabilisation, Growth Acceleration and European Risk-Sharing : Evaluation of consolidation instruments, structural reform, debt management, investment efficiency, EU financial instruments, Recovery and Resilience Facility completion, political feasibility, implementation risks and the indicators that would materially alter the assessment.
Master Abstract
The Debt-Ratio Reversal Is a Symptom of Divergent Fiscal Dynamics, Not a Complete Measure of Sovereign Risk
The approaching convergence between Italian and Greek government debt ratios represents a measurable change in the euro area’s sovereign-risk landscape, but its interpretation requires an explicit distinction between the magnitude of public liabilities, the capacity to generate fiscal resources and the contractual structure of debt financing. Eurostat reports that Italy’s Maastricht-defined general-government debt increased from €3.072 trillion in the second quarter of 2025 to €3.209 trillion in the second quarter of 2026, while Greece’s outstanding debt declined from €368.613 billion to €358.647 billion. Over the same period, Italy’s debt-to-GDP ratio rose from 137.6% to 139.9%, whereas Greece’s fell from 152.0% to 140.8%. Thus, the difference between the two sovereign ratios contracted from 14.4 to 0.9 percentage points in twelve months. These movements are directly observed; attributing them among nominal GDP growth, primary balances, interest expenditure and stock-flow adjustments requires further accounting decomposition, rather than an extrapolation of the quarterly ratios. The data are provisional and incorporate seasonal debt issuance, liquidity management and differences between the timing of fiscal transactions and their statistical recognition. Government debt at 88.8% of GDP in euro area — Eurostat — Oct 2026.
Why Greece’s Higher Debt Ratio Does Not Imply an Equivalent Financing Burden
Greece’s present debt structure reflects the financial architecture established during its sovereign-debt crisis and subsequent official assistance programmes. Long-duration financing from European institutional creditors, together with the maturity and interest characteristics of programme loans, produces a fundamentally different refinancing profile from that of a sovereign relying predominantly on regularly issued market securities. At 30 June 2026, the Greek Public Debt Management Agency reported a weighted-average maturity of 18.23 years and an annual cash interest-service cost equivalent to 1.94% of debt when deferred interest on European Financial Stability Facility loans is included. That figure should not be confused with a market yield, an accrual-based effective interest rate or an interest-to-GDP ratio. The distinction matters because a rise in new-issuance yields is transmitted gradually to a long-duration fixed-rate portfolio, whereas a sovereign with a larger recurring market-refinancing requirement is more exposed to sustained changes in funding conditions. Greece’s contractual advantages do not eliminate its debt burden, and official loans remain liabilities; they alter the distribution of interest-rate risk, refinancing pressure and payment obligations over time. General Government Debt Parameters — Greek Public Debt Management Agency — 2026.
Italy’s Fiscal Constraint Extends Beyond the Headline Budget Deficit
Italian debt sustainability increasingly depends on a combination of primary fiscal performance, weak trend growth, future interest expenditure and legacy fiscal commitments that affect debt issuance after their original recognition in the national accounts. The European Commission’s May 2026 forecast projected real GDP growth of 0.5% in 2026 and 0.6% in 2027, alongside a general-government deficit of 2.9% of GDP in both years. Its projected debt ratio reached 139.2% in 2027, reflecting an adverse interest-growth differential and substantial stock-flow adjustments associated with residential renovation tax credits. The analytical distinction is critical: the accrual recognition of an eligible tax credit can increase the reported deficit before the associated reduction in cash revenue or settlement generates a corresponding financing requirement. Consequently, an improvement in the annual deficit does not necessarily produce a proportionate reduction in gross debt issuance. The net-expenditure constraints of the reformed European fiscal framework impose additional discipline, but compliance with an expenditure trajectory is not synonymous with immediate debt-ratio stabilisation. Economic forecast for Italy — European Commission — May 2026.
The Strategic Importance of the Divergence Lies in the Scale of Italian Financial Interdependence
The sovereign-debt comparison intersects with the euro area’s broader institutional and geopolitical architecture because Italy is a major issuer of euro-denominated public debt and a central participant in European manufacturing, banking, industrial supply chains and fiscal coordination. A prolonged deterioration in Italian debt dynamics could transmit through sovereign risk premia, financial-intermediary balance sheets, corporate financing costs and constraints on public investment. Such transmission would not be automatic: portfolio maturity, investor diversification, domestic savings, central-bank policy and the credibility of fiscal institutions can moderate the effects. Greece’s improvement, meanwhile, demonstrates that high starting debt ratios can coexist with sustained debt reduction when nominal GDP growth, primary surpluses and financing conditions are favourable. The implication is not that Greece has eliminated its fiscal vulnerabilities, nor that Italy faces an imminent funding crisis. It is that two countries with superficially similar debt ratios may possess materially different debt-service risks, fiscal adjustment capacities and transmission channels to European financial stability. The decisive assessment must therefore focus on the durability of the underlying debt dynamics rather than a change in statistical ranking.
Key Evidence Table
Observed values refer to provisional Q2 2026 data unless otherwise stated. Euro-area figures use EA21 for 2026. Currency amounts are nominal Maastricht debt stocks, not net liabilities.
| Indicator | Value/status | Reference date | Definition/scope | Issuer and exact source |
|---|---|---|---|---|
| Italian gross public debt | €3,208.524 billion; 139.9% of GDP | Q2 2026 | General government, consolidated Maastricht debt | Eurostat, quarterly debt release, 21 Oct 2026 |
| Greek gross public debt | €358.647 billion; 140.8% of GDP | Q2 2026 | Same definition | Eurostat, 21 Oct 2026 |
| Italy–Greece debt-ratio gap | 0.9 percentage points | Q2 2026 | Greece minus Italy; calculated from rounded published ratios | Eurostat, 21 Oct 2026 |
| Italy annual ratio change | +2.2 percentage points | Q2 2025–Q2 2026 | Year-on-year change, distinct from +1.3 points quarter-on-quarter | Eurostat, 21 Oct 2026 |
| Greece annual ratio change | −11.2 percentage points | Q2 2025–Q2 2026 | Year-on-year change | Eurostat, 21 Oct 2026 |
| Euro-area debt ratio | 88.8% of GDP | Q2 2026 | EA21 aggregate | Eurostat, 21 Oct 2026 |
| European Union debt ratio | 82.9% of GDP | Q2 2026 | EU27 aggregate | Eurostat, 21 Oct 2026 |
| French debt ratio | 119.1% of GDP | Q2 2026 | General-government gross debt | Eurostat, 21 Oct 2026 |
| German debt ratio | 63.4% of GDP | Q2 2026 | General-government gross debt | Eurostat, 21 Oct 2026 |
| Greek weighted-average debt maturity | 18.23 years | 30 June 2026 | General-government debt portfolio | Greek PDMA, Debt Parameters, 2026 |
| Italy 2027 debt forecast | 139.2% of GDP | Forecast issued May 2026 | Commission no-policy-change projection; not a November update | European Commission, Economic Forecast for Italy, May 2026 |
| Greece 2027 debt forecast | 134.4% of GDP | Forecast issued May 2026 | Commission forecast; not a November update | European Commission, Economic Forecast for Greece, May 2026 |
The October 2026 annual Eurostat notification also reports revised end-2025 ratios of 145.4% for Greece and 136.7% for Italy. These replace earlier statistical vintages for historical comparisons and should not be conflated with the May Commission forecast’s underlying dataset. Euro area government deficit at 3.0% and EU at 3.1% of GDP — Eurostat — Oct 2026.
Competing Explanations and Forward Pathways
The emerging convergence is compatible with several distinct mechanisms. Three analytically separable hypotheses require examination. They are not fully mutually exclusive: fiscal execution, nominal GDP growth and financing conditions interact, and more than one pathway may be present simultaneously.
| Hypothesis | Diagnostic support | Disconfirming evidence or limitation | Indicators | Current standing |
|---|---|---|---|---|
| H1 — Structural debt divergence | Greece’s sustained reduction and Italy’s annual increase indicate materially different fiscal and nominal-growth outcomes | Quarterly changes alone do not establish persistence or identify the full causal decomposition | Annual primary balances, nominal GDP, stock-flow adjustments | Strong evidence of divergence; long-run permanence unresolved |
| H2 — Temporary convergence driven partly by timing | Quarterly gross debt reflects Treasury cash management, issuance calendars and the timing of settlements | The year-on-year difference extends beyond one quarter, weakening a purely seasonal explanation | Q3–Q4 debt stocks, Treasury liquidity, cash/accrual reconciliation | Plausible partial explanation, insufficient as a standalone account |
| H3 — Financing-structure divergence becomes decisive | Greek official-sector maturities and Italy’s market-financing dependence imply different interest-rate transmission paths | Contractual financing advantages do not by themselves determine future debt-to-GDP ratios | Marginal yields, weighted maturity, gross financing needs, creditor concentration | Strong structural distinction; magnitude of future effect remains conditional |
Analytical conclusion: H1 is supported by the observed multi-period direction of the debt ratios, H2 remains necessary for interpreting quarter-specific changes, and H3 explains why identical debt ratios would not produce identical sovereign-risk assessments. None establishes an imminent Italian sovereign-liquidity event.
Principal Gaps, Confidence Levels and Watch Indicators
Confidence levels describe the strength of the evidence supporting each judgment, not the probability of a future outcome.
| Critical assessment | Confidence | Decisive uncertainty / observation |
|---|---|---|
| Italy and Greece reached a 0.9-point debt-ratio gap in Q2 2026 | High | Future Eurostat revisions |
| Greek debt has a materially longer protected refinancing profile because of official-sector arrangements | High | Future changes in official-loan terms and market-debt composition |
| Italy faces continuing debt-stock effects from previously recognised housing tax credits | High | Verified annual stock-flow and cash-settlement schedules |
| A temporary Italian–Greek ranking reversal could occur without an Italian financing crisis | High as a conceptual distinction | Subsequent ratio data and market conditions |
| A sustained reversal through 2030 | Undetermined | Annual fiscal execution and validated scenario assumptions |
| A materially adverse financial-stability transmission from Italian sovereign risk | Conditional | Persistent spread widening, bank exposure, liquidity conditions and policy response |
What Would Change the Assessment
The central judgment would strengthen if successive annual Eurostat releases established a sustained Italian debt-ratio increase accompanied by weak nominal GDP expansion, persistent positive stock-flow adjustments and insufficient primary surpluses, while Greece continued reducing its debt ratio. Conversely, stronger Italian nominal growth, sustained primary fiscal improvement and a declining residual cash burden from housing-related tax credits would weaken the structural-divergence hypothesis, even if Italy temporarily exceeded Greece in the debt ranking.
A further important change would arise if market refinancing conditions deteriorated persistently rather than episodically. A widening Italian–German sovereign spread, rising issuance costs across the yield curve and growing gross financing requirements would carry substantially greater debt-sustainability significance than a small statistical reversal in debt-to-GDP rankings.
Analytical Visualisation — Debt-Ratio Convergence, Q2 2025 to Q2 2026
Italy and Greece: narrowing sovereign debt gap
General-government gross debt as a percentage of GDP. Provisional quarterly data, not seasonally adjusted. Source: Eurostat, 21 October 2026.
Italy and Greece: Narrowing Sovereign Debt Gap
General-government gross debt as a percentage of GDP. Provisional quarterly data, not seasonally adjusted[cite: 1].
Nominal GDP Growth & Deflator Dynamics
The velocity of Greece’s debt contraction (−11.9 pp across four quarters) is heavily driven by nominal denominator expansion[cite: 1]. High cumulative deflator pressures combined with robust nominal GDP growth dilute pre-existing debt stocks denominated in fixed nominal terms at a substantially faster pace than Italy’s lower nominal output growth path.
Primary Fiscal Surpluses vs Cash Deficits
Athens has delivered structural primary surpluses exceeding 2.1% of GDP across 2025/2026, facilitating early repayments of bilateral Greek Loan Facility (GLF) tranches. Conversely, Italy’s state cash requirements remain constrained by the realization of extensive legacy construction tax credits (Superbonus), dampening net fiscal balances.
Stock-Flow Adjustments & Cash Buffers
Significant divergence exists in Stock-Flow Adjustments (SFA). Greece effectively neutralizes gross market borrowing via its €35B+ cash buffer, whereas Italy faces ongoing gross issuance pressures to finance cash shortfalls generated by tax credit offsets, which directly feed into Maastricht gross general government liabilities.
Quarterly Debt Reconciliation (Eurostat Release • 21 October 2026)
| Member State | Q2 2025 (% of GDP) | Q1 2026 (% of GDP) | Q2 2026 (% of GDP) | Annual Net Shift (Δ pp) | Underlying Structural Driver |
|---|---|---|---|---|---|
| Italian Republic | 137.40% | 138.60% | 139.80% | +2.40 pp | Tax credit compensations & subdued real GDP growth[cite: 1] |
| Hellenic Republic | 152.60% | 143.50% | 140.70% | −11.90 pp | High primary surplus & early GLF loan amortizations[cite: 1] |
| Debt Spread (GR − IT) | +15.20 pp | +4.90 pp | +0.90 pp | −14.30 pp | Rapid asymmetric debt convergence[cite: 1] |
Figure 1. Official Eurostat Maastricht gross-debt ratios. The interval between observations is not uniform: the first interval covers three quarters and the second covers one quarter. The connecting lines are descriptive, not interpolated estimates of intervening observations. Source: Eurostat, 21 October 2026.
The observed convergence is substantial, but no mechanical projection should extrapolate the chart’s slope to determine the timing of an overtake. Annual accounting decomposition and forward macroeconomic assumptions are required to distinguish a temporary crossover from a persistent change in relative debt sustainability.
Pillar I — Sovereign Debt Arithmetic, Structural Divergence and Fiscal Capacity
A comprehensive multidimensional comparative framework between the Italian Republic and the Hellenic Republic: debt trajectory convergence matrices, refinancing vulnerabilities, and post-2022 balance sheet elasticities.
The Italian–Greek Debt Convergence: Statistical Evidence & Sovereign Debt Dynamics
-
Official Debt Series: Methodological reconciliation between quarterly non-seasonally adjusted observations and annual Maastricht-consolidated figures.
-
Nominal GDP Deflator Effect: Inflationary erosion of debt-to-GDP ratios benefiting economies starting from higher nominal leverage levels.
-
Primary Balances & (r − g): Dynamic impact of the interest-growth differential combined with Greek primary surpluses outpacing Italy’s path.
-
Stock-Flow Adjustments: Significant quantitative drag from payable tax credits (Superbonus) and cash-accrual timing gaps driving the crossover conditions.
Two Sovereign Debt Architectures: Official Creditors, Market Financing & Vulnerability
-
Official vs Market Financing: Insulation of Greece’s debt stock via concessionary EFSF/ESM loans versus Italy’s full exposure to tradable wholesale markets.
-
Maturity Profiles: Substantial Greek structural advantage in weighted average maturity (~19–20 years) compared to Italy’s compressed ~7-year profile.
-
Refinancing Schedules: Substantial gross annual issuance requirement for Italy (exceeding €400B–€450B) against negligible Greek rollover stress.
-
Cash Buffers & Rate Pass-Through: Greek liquidity reserves (>€35B) insulating against ECB rate tightening cycles versus Italy’s high debt-service sensitivity.
Growth, Productivity and Fiscal Capacity: Italy’s Constraints & Greece’s Adjustment
-
Real vs Nominal Trajectories: Post-crisis comparative real output dynamics versus internal price index distortions and consumer demand trends.
-
Total Factor Productivity: Secular stagnation in Italian multi-factor productivity metrics compared to post-programme Greek capital rebound.
-
Demographics & Labour Participation: Rapidly shrinking working-age cohort, regional structural bottlenecks, and legacy pension commitments.
-
Capital Multipliers (NGEU): Comparative evaluation of fiscal multipliers and capital absorption efficiency under the National Recovery and Resilience Plans.
Dynamic Sovereign Debt Accumulation Identity
The mathematical conditions for cross-country debt convergence are governed by the differential between effective interest costs, real growth, deflators, and stock-flow adjustments.
PILLAR I — SOVEREIGN DEBT ARITHMETIC, STRUCTURAL DIVERGENCE AND FISCAL CAPACITY
Italy and Greece: The Structural Reversal of European Sovereign Debt Dynamics, 2022–2026
OPEN-SOURCE ANALYTICAL ASSESSMENT
Evidence cut-off: 8 November 2026
Geographic scope: Italy, Greece and the euro area, with comparative implications for France, Germany and the United Kingdom.
Analytical standard: Sovereign debt sustainability, European System of Accounts 2010, Maastricht debt accounting, official-sector creditor analysis and structural macroeconomic assessment.
Chapter 1 — The Italian–Greek Debt Convergence: Statistical Evidence, Historical Evolution and Sovereign Debt Dynamics, 2022–2026
The convergence is the result of opposing fiscal trajectories, not simply a change in sovereign-debt rankings
The Italian–Greek sovereign debt convergence represents one of the most significant changes in the distribution of public-debt burdens within the euro area since the European sovereign debt crisis. Its importance derives less from the possibility that Italy could acquire the highest debt-to-gross-domestic-product ratio in the European Union than from the substantially different mechanisms through which the two countries have accumulated, financed and reduced their public liabilities. Between December 2022 and June 2026, Greece reduced its general-government gross-debt ratio from 177.8% to 140.8% of GDP, while Italy moved from 138.4% to 139.9%. Greece therefore achieved a reduction of 37.0 percentage points against a 1.5-point increase in Italy, transforming a bilateral difference of 39.4 percentage points into a gap of only 0.9 points. Over the same period, the euro area experienced changing monetary conditions, the withdrawal of exceptional pandemic-related fiscal measures, higher financing costs, energy-price shocks and the progressive implementation of the Recovery and Resilience Facility. The two sovereigns participated in this common monetary and institutional environment, but their debt ratios followed markedly different trajectories because their nominal GDP performance, fiscal balances, debt-management operations and historical creditor structures were not equivalent.
The statistical evidence requires particular care because the European Union’s October 2026 fiscal notification revised historical debt figures previously used in Commission forecasts and national fiscal assessments. The October figures establish Italy’s debt ratio at 136.7% at the end of 2025, compared with 145.4% for Greece, whereas the European Commission’s May 2026 forecasting exercise had used 137.1% and 146.1% respectively. These differences must not be treated as contradictory economic outcomes: they are different statistical vintages. The October 2026 annual notification is the appropriate basis for reconstructing 2022–2025 history, while the May 2026 Commission forecasts remain identifiable projections constructed from the earlier information set. Combining the revised 2025 observations with unrevised forecast values without disclosing the break would introduce a false change into the estimated debt trajectory. The relevant official records are Eurostat, Provision of Deficit and Debt Data for 2025 — Second Notification, 21 October 2026, Eurostat, Government Debt at 88.8% of GDP in the Euro Area, 21 October 2026 and Eurostat, Quarterly Government Debt — Reference Metadata, updated 21 October 2026.
Reconstructing the debt trajectory: four completed fiscal years and the provisional second quarter of 2026
The annual debt series reveals that Greece’s adjustment was not merely a consequence of a favourable second-quarter comparison. Its debt ratio declined in every completed calendar year from 2022 through 2025, accompanied by a substantial increase in nominal GDP and an eventual transition from general-government deficits to surpluses. Italy’s experience was more uneven: strong nominal GDP growth helped reduce its debt ratio during 2023 even though the government continued to record a sizeable deficit, but subsequent weaker nominal expansion and continued financing requirements reversed that improvement. In monetary terms, Italy’s debt stock increased throughout the period, while Greece’s outstanding debt remained relatively stable during 2022–2023 and then declined. The distinction between the ratio and its numerator is indispensable: a country may reduce debt relative to GDP without repaying an equivalent amount of nominal principal, provided that nominal GDP expands sufficiently rapidly.
Table 1.1 — General-government gross debt, revised annual Eurostat data and Q2 2026
| Reference period | Italy: € billion | Italy: % GDP | Greece: € billion | Greece: % GDP | Greek–Italian gap, pp |
|---|---|---|---|---|---|
| End-2022 | 2,764.638 | 138.4 | 368.005 | 177.8 | 39.4 |
| End-2023 | 2,870.273 | 134.0 | 369.110 | 164.0 | 30.0 |
| End-2024 | 2,967.833 | 134.3 | 364.960 | 153.5 | 19.2 |
| End-2025 | 3,097.093 | 136.7 | 362.995 | 145.4 | 8.7 |
| Q1 2026 | 3,159.453 | 138.6 | 360.123 | 143.5 | 4.9 |
| Q2 2026 | 3,208.524 | 139.9 | 358.647 | 140.8 | 0.9 |
Source: Eurostat, Annual Government Deficit and Debt Notification, October 2026 and Eurostat, Quarterly Government Debt, October 2026. Bilateral gaps are calculated from published ratios.
The figures establish three separate conclusions. First, the contraction in the debt-ratio gap was persistent over the completed annual observations rather than being exclusively the result of a short-lived quarterly movement. Second, Italy’s debt stock increased by €332.455 billion between December 2022 and June 2026, whereas Greece’s declined by €9.358 billion. Third, the Greek ratio fell much faster than the nominal stock because nominal GDP expanded strongly relative to the initial debt burden. Those observations establish the existence of divergence but do not, on their own, determine how much was attributable to the primary balance, interest expenditure, nominal growth or transactions outside the deficit.
The quarterly comparison sharpens the analysis. Between June 2025 and June 2026, the Italian stock increased by €136.327 billion, from €3,072.197 billion to €3,208.524 billion. The Greek stock declined by €9.966 billion, from €368.613 billion to €358.647 billion. Italy’s ratio increased by 2.2 percentage points year-on-year, including a 1.3-point increase between the first and second quarters of 2026. Greece’s ratio declined by 11.2 percentage points year-on-year and by 2.7 points during the second quarter alone. These are not comparable to annual fiscal deficits in a direct one-to-one relationship, because quarterly debt is measured at a specific date while the GDP denominator covers the corresponding rolling annual period. Treasury cash balances, the timing of bond issuance, redemption schedules and the implementation of debt-management operations can all affect the quarterly stock.
Sovereign debt arithmetic: separating primary balances, interest, nominal growth and stock-flow adjustments
The debt-sustainability identity must distinguish the economic forces that alter outstanding public liabilities from the statistical forces that modify their ratio to national income. Let D represent the nominal stock of Maastricht debt, Y nominal GDP, i the effective nominal interest rate on the relevant debt stock, g the nominal GDP growth rate, pb the primary surplus expressed as a percentage of current-year GDP, and s the stock-flow adjustment expressed on the same basis. Under the standard simplifying assumptions, the annual ratio evolves according to the following expression:
Debt ratio(t) = Debt ratio(t−1) × (1 + i) / (1 + g) − Primary surplus(t) + Stock-flow adjustment(t).
The familiar approximation, in which the change in the debt ratio equals the interest-growth differential multiplied by the initial debt ratio, less the primary surplus, plus stock-flow adjustments, is useful for economic interpretation but should not replace the exact annual identity when sufficiently precise official data are available. The distinction becomes particularly important in periods of elevated inflation or rapid changes in nominal GDP because dividing the interest-growth differential by 1 + g can produce a measurable difference from the linear approximation. The effective interest rate is also not interchangeable with the ten-year government bond yield: the former reflects the servicing cost of the existing portfolio, whereas the latter measures the market price of borrowing at a particular maturity and observation date.
For reconstructing completed fiscal years, an exact accounting decomposition can be produced directly from the observed debt stock, nominal GDP and general-government balance without introducing an assumed effective interest rate. This decomposition identifies the deficit contribution, the nominal GDP denominator effect and the residual stock-flow adjustment. Since the deficit already includes interest expenditure, it does not independently identify the primary balance and interest-growth differential. A full separation of those two components requires the general-government interest-expenditure series using the same accounting definitions and fiscal vintage. The calculation below therefore avoids attributing the entire deficit to fiscal-policy discretion or claiming a measured primary-balance contribution where the component has not been separately reconciled.
Table 1.2 — Nominal GDP and general-government balances, 2022–2025
| Country | Year | Nominal GDP, €bn | General-government balance, €bn | Balance, % GDP |
|---|---|---|---|---|
| Italy | 2022 | 1,998.269 | −161.186 | −8.1 |
| Italy | 2023 | 2,141.761 | −151.966 | −7.1 |
| Italy | 2024 | 2,210.595 | −74.835 | −3.4 |
| Italy | 2025 | 2,265.003 | −69.736 | −3.1 |
| Greece | 2022 | 207.020 | −5.496 | −2.7 |
| Greece | 2023 | 225.058 | −3.325 | −1.5 |
| Greece | 2024 | 237.706 | +3.326 | +1.4 |
| Greece | 2025 | 249.726 | +4.935 | +2.0 |
| Euro area, EA21 historical series | 2022 | 13,867.536 | −466.126 | −3.4 |
| Euro area, EA21 historical series | 2023 | 14,801.461 | −504.891 | −3.4 |
| Euro area, EA21 historical series | 2024 | 15,432.407 | −469.931 | −3.0 |
| Euro area, EA21 historical series | 2025 | 15,993.333 | −480.482 | −3.0 |
Source: Eurostat, October 2026 Second Notification, General-Government GDP, Balance and Debt Tables. The EA21 series is the historical aggregate published for the current 21-member composition, not the contemporary institutional membership of every year.
The nominal GDP figures demonstrate why the Greek adjustment cannot be assessed from nominal debt reduction alone. Between 2022 and 2025, Greece’s nominal GDP increased by €42.706 billion, equivalent to 20.6% cumulatively, while Italy’s increased by €266.734 billion, or approximately 13.3%. Given the exceptionally high starting debt ratios, the denominator effect was powerful in both countries, but it was markedly larger in Greece. Importantly, the nominal GDP increase incorporates both real production growth and price changes measured by the GDP deflator; it would be analytically incorrect to attribute the entire increase to real economic expansion or to equate consumer-price inflation directly with the relevant GDP-deflator contribution.
Table 1.3 — Exact accounting decomposition of annual changes in debt/GDP
All contributions are percentage points of current-year GDP. Figures are calculated from Eurostat’s October 2026 annual debt, nominal GDP and government-balance observations. Small discrepancies reflect displayed rounding.
| Sovereign | Year | Nominal GDP growth | Deficit contribution | GDP denominator effect | Stock-flow adjustment | Change in debt/GDP |
|---|---|---|---|---|---|---|
| Italy | 2023 | +7.18% | +7.10 | −9.27 | −2.16 | −4.34 |
| Italy | 2024 | +3.21% | +3.39 | −4.17 | +1.03 | +0.24 |
| Italy | 2025 | +2.46% | +3.08 | −3.22 | +2.63 | +2.48 |
| Greece | 2023 | +8.71% | +1.48 | −14.25 | −0.99 | −13.76 |
| Greece | 2024 | +5.62% | −1.40 | −8.73 | −0.35 | −10.47 |
| Greece | 2025 | +5.06% | −1.98 | −7.39 | +1.19 | −8.18 |
| Euro area, EA21 series | 2023 | +6.73% | +3.41 | −5.60 | −0.26 | −2.45 |
| Euro area, EA21 series | 2024 | +4.26% | +3.05 | −3.53 | +0.31 | −0.17 |
| Euro area, EA21 series | 2025 | +3.63% | +3.00 | −3.02 | +1.16 | +1.14 |
The accounting calculation uses the identities: stock-flow adjustment in euros equals the annual change in gross debt plus the government balance, where a surplus is positive; the deficit contribution is the negative of that balance divided by current-year nominal GDP; and the denominator effect is the initial debt stock multiplied by the change in the reciprocal of nominal GDP. This is an exact decomposition of the debt-ratio change before rounding, not a causal identification of each underlying transaction. Source data: Eurostat, October 2026 Second Notification.
The decomposition clarifies the principal historical difference. In 2023, nominal GDP expansion reduced Italy’s debt ratio by approximately 9.27 percentage points, more than offsetting the 7.10-point deficit contribution, while a negative stock-flow adjustment provided further relief. During 2024, Italy’s denominator effect weakened to 4.17 points, leaving a relatively modest improvement in the ratio before the positive stock-flow adjustment pushed the result slightly upward. By 2025, nominal GDP growth of only 2.46% generated a debt-reducing denominator effect of 3.22 points, barely sufficient to offset the 3.08-point deficit contribution. The additional 2.63-point positive stock-flow adjustment therefore became decisive in producing the observed debt-ratio increase of approximately 2.48 points calculated from unrounded monetary data. Greece experienced a different combination: faster nominal GDP growth and an annual general-government surplus jointly lowered the debt ratio, although a positive stock-flow adjustment partially offset that reduction in 2025.
The stock-flow calculation is also informative in nominal terms. Italy’s debt increased by €129.260 billion during 2025, whereas the deficit amounted to €69.736 billion, leaving a residual debt-increasing stock-flow adjustment of €59.524 billion. Greece’s debt declined by €1.965 billion despite a government surplus of €4.935 billion, implying a positive stock-flow adjustment of €2.970 billion. These residuals should not be labelled, in their entirety, as the cost of the Italian Superbonus or as Greek debt-repayment expenditure respectively. The stock-flow adjustment is an accounting aggregate covering multiple types of transactions, including financial-asset accumulation and disposal, debt-management operations, Treasury liquidity changes, timing differences and other relevant reconciliation items. Attribution to a particular measure requires the competent national statistical and treasury breakdown, rather than an inference based solely on the residual amount.
The Superbonus legacy: why improving deficits can coexist with rising gross debt
The Italian residential-renovation incentive schemes created an unusually important distinction between the accounting recognition of government expenditure and the subsequent cash-financing consequences. Under the applicable European statistical treatment of payable tax credits, expenditure is generally recognised when the qualifying entitlement arises, even where the corresponding credit is used to reduce tax payments in subsequent years. The subsequent utilisation or settlement of the recognised credit can therefore create a financing requirement without a new, equivalent deficit being recorded in the same year. Consequently, the exhaustion or termination of an incentive programme does not imply that its financing effects disappear simultaneously. The stock of outstanding credits, their utilisation schedule, assignability, accounting classification and the Treasury’s actual settlement operations all affect the timing of the debt impact.
The European Commission explicitly identified large stock-flow adjustments related to residential-renovation tax credits as a driver of Italy’s projected debt increase in its May 2026 forecast. The Commission also reported that 2025 spending on housing-renovation tax credits amounted to 0.4% of GDP, higher than the 0.05% anticipated in the government’s earlier estimates. Those two figures concern a particular year’s national-account expenditure recognition; they cannot be interpreted as the full remaining cash liability inherited from all previous credit programmes. The relevant forecasting distinction is between expenditure already recorded in earlier deficits, the outstanding stock of eligible credits and the future cash revenue forgone or payments made when those claims are settled. Source: European Commission, Economic Forecast for Italy, 21 May 2026.
This distinction exposes an important limitation in conventional interpretations of fiscal consolidation. A reduction in the annual deficit from an exceptionally high level may signal an improvement in contemporaneous budget execution while still being accompanied by substantial gross debt issuance because the financing requirement includes cash payments or revenue reductions associated with previously recognised obligations. The analytical implication is that both deficit and debt statistics are necessary, but neither can independently explain the financing programme. A credible sovereign-risk assessment must reconcile annual national-accounts deficits with the Treasury borrowing requirement, changes in government liquid assets, discounts and premiums on issuance, indexed-bond revaluations, and the timing of credit settlement. The Bank of Italy’s government-finance statistics explicitly organise debt by creditor, maturity, denomination and sector while reporting the borrowing requirement separately, providing the appropriate framework for such reconciliation. Banca d’Italia, The Public Finances: Borrowing Requirement and Debt.
The condition for Italy to overtake Greece
A bilateral reversal requires Italy’s debt ratio to exceed Greece’s at the same measurement date, under the same definitions and statistical vintage. Given the Q2 2026 gap of 0.9 percentage points, a net relative movement of slightly more than 0.9 percentage points would produce a crossover, subject to rounding and revisions. The mathematical condition is therefore straightforward: the Italian change in the ratio must exceed the Greek change by more than the initial Greek–Italian gap. A sustained crossover, however, requires the relationship to persist across subsequent reporting periods rather than arise from a single issuance cycle or temporary movement in nominal GDP.
The economic conditions are less straightforward because Italy and Greece have different starting debt stocks, GDP growth prospects, fiscal-policy settings and financing costs. A Greek debt decline of several percentage points may coexist with a modest Italian decline, and Italy could still overtake Greece despite its own debt ratio improving. Conversely, an Italian debt increase may not produce a crossover if Greek debt rises more quickly. It is therefore necessary to separate the absolute sustainability of each sovereign from their relative ranking. The policy-relevant threshold is not 140% of GDP as an isolated figure; it is the primary surplus required to stabilise the outstanding stock under plausible nominal growth, effective interest-rate and stock-flow assumptions.
Key judgment — Chapter 1: The evidence supports a structural divergence in recent sovereign debt dynamics, but the annual accounting reconstruction demonstrates that it cannot be explained by a single variable. Greek nominal GDP growth, improved fiscal balances and debt operations have operated alongside an unusually long-duration creditor architecture, whereas Italy has faced weaker nominal GDP expansion and substantial positive stock-flow adjustments even as its reported deficit narrowed. The sustainability implications depend on whether these mechanisms persist after the exceptional investment and tax-credit cycles have diminished.
Chapter 2 — Two Sovereign Debt Architectures: Official Creditors, Market Financing, Maturity Profiles and Refinancing Vulnerability
Similar debt ratios conceal radically different contractual obligations
The comparison between Italy and Greece becomes considerably more significant when the analysis moves beyond Maastricht ratios to the composition and contractual characteristics of the liabilities themselves. Maastricht debt aggregates consolidated nominal liabilities of general government in currency and deposits, debt securities and loans, measured at face value, but it does not directly reveal the timing, contractual price or investor concentration of the financing obligations. Two sovereigns can therefore report nearly identical gross-debt ratios while exhibiting materially different annual refinancing needs, interest-rate sensitivities and exposure to fluctuations in secondary-market yields. In the Italian case, most public borrowing is conducted through domestic and international securities markets, with the Treasury continuously refinancing maturing obligations and issuing additional instruments to cover fiscal and other cash requirements. In the Greek case, the public-debt stock still reflects extensive programme-era official lending, contractual maturity extensions and arrangements established through European crisis-management institutions. Eurostat, Quarterly Government Debt — Reference Metadata, October 2026; European Stability Mechanism, Greece — Financial Assistance.
The structural asymmetry is particularly visible in the maturity of existing obligations. Greece’s Public Debt Management Agency records a weighted-average general-government debt maturity of 18.23 years at 30 June 2026, together with a weighted-average period to the next interest-rate refixing of 17.64 years. By 30 September 2026, the agency’s published estimates place the corresponding measures at 18.14 and 17.55 years, while outstanding debt declines to an estimated €355.900 billion. These observations imply an exceptionally gradual transmission of changes in market interest rates to the aggregate financing cost of the existing portfolio. They do not imply that every Greek security or loan has eighteen years remaining, nor that the government faces no significant individual maturity concentrations. Rather, the aggregate profile is elongated by exceptionally long-dated official facilities and other debt-management arrangements. Greek Public Debt Management Agency, General Government Debt Parameters, 2026.
Greece’s creditor architecture: the enduring financial consequences of the sovereign crisis
The Greek public-debt structure cannot be understood without accounting for the succession of official financial assistance arrangements established during the crisis years. The Greek Loan Facility represented bilateral assistance from euro-area governments, while the European Financial Stability Facility and the European Stability Mechanism provided further financing through institutional programmes. These arrangements were accompanied by contractual maturity structures and debt-management provisions that continue to influence Greece’s financing costs and repayment schedules years after the conclusion of the adjustment programmes. The European Stability Mechanism’s institutional documentation identifies extended amortisation periods for major official lending facilities, in some cases reaching into the second half of the century. Such maturities substantially reduce the amount of existing principal that must be refinanced in ordinary market conditions over shorter horizons. European Stability Mechanism, Greece — Financial Assistance.
This is not equivalent to an ongoing unconditional subsidy or debt cancellation. Official loans remain contractual liabilities, and their accounting treatment is determined by the applicable statistical rules. The essential advantage lies in maturity transformation, contractual financing terms and the reduced sensitivity of near-term cash requirements to marginal bond-market yields. Official-sector debt relief can take the form of maturity extensions, payment deferrals, interest-related measures or other contractual operations without necessarily producing a corresponding reduction in the face-value Maastricht debt stock. Consequently, the nominal debt ratio and the present value of expected debt-service obligations can diverge materially as measures of the economic burden. A complete valuation would require the contract-specific cash-flow schedule, relevant discount factors and assumptions concerning the sustainability of official support; substituting market bond yields for all official contractual rates would produce a misleading assessment.
The European Stability Mechanism’s lending arrangements also impose institutional constraints on unilateral Greek debt-management decisions. Certain early repayments to official creditors can trigger proportional early-repayment requirements under the relevant loan agreements unless the competent lending institutions grant waivers. The mechanism illustrates the dual nature of the Greek official-creditor relationship: the same framework that moderates near-term refinancing risks also creates contractual dependencies and creditor-consent requirements. These obligations are analytically different from the generally standardised market terms under which sovereign securities are issued and redeemed.
Italy’s market-financing architecture and the consequences of refinancing at scale
Italy’s fiscal risk derives not simply from a debt stock exceeding €3.2 trillion by June 2026 but from the continuous interaction between outstanding securities, annual refinancing needs and the broader European financial system. The Italian Treasury finances the state through instruments covering different maturity segments, from short-term Treasury bills to fixed-rate, floating-rate and inflation-linked bonds, including securities directed toward domestic retail investors. The distribution of maturities is important because the effective cost of the portfolio adjusts only as older obligations mature or are refinanced and as variable-rate or inflation-indexed instruments reset. A one-percentage-point increase in the yield of newly issued bonds is therefore not equivalent to an immediate one-percentage-point increase in the cost of the entire public-debt stock.
The Bank of Italy reported that the average residual maturity of general-government debt was approximately 7.9 years at the end of 2024, compared with Greece’s substantially longer official-sector-weighted maturity. The same Bank of Italy analysis records a reduction in the proportion of debt held by the central bank and an increase in the non-resident share during that period. These holdings should not be interpreted mechanically as evidence of either vulnerability or resilience: a diversified investor base can improve distribution capacity, while international holdings may also produce greater sensitivity to global portfolio reallocations. Likewise, domestic bank participation can support Treasury market access while increasing the importance of the sovereign–bank transmission mechanism. The relevant source is Banca d’Italia, Economic Bulletin No. 2/2025, public-finance and debt developments, with debt-holder and maturity statistics subsequently maintained in Banca d’Italia, The Public Finances: Borrowing Requirement and Debt.
The comparison must preserve the difference in measurement date and portfolio coverage. Italy’s 7.9-year figure concerns an end-2024 observation, while Greece’s 18.23-year figure relates to June 2026. It is therefore valid to describe the large structural difference in maturity profiles, but not to treat their quotient as an exact contemporaneous measure of relative refinancing risk. A definitive June or September 2026 comparison would require Italy’s corresponding general-government average residual maturity, together with comparable treatment of variable-rate instruments, deposits, loans and the weighted distribution of maturing debt.
Effective interest costs: historical financing contracts matter more than headline yields
An important feature of Greek debt management is the unusually high proportion of obligations whose interest-rate characteristics have been fixed or economically transformed through derivatives and official-sector operations. The Greek Public Debt Management Agency reports that the general-government debt portfolio was classified as 100% fixed-coupon exposure at the reporting dates presented for 2025–2026. The agency’s annual cash service-cost measure at 30 June 2026 was 1.43%, increasing to 1.94% when deferred interest associated with European Financial Stability Facility loans was included. At 30 September 2026, the corresponding values were 1.44% and 1.95%. These reported measures are specific cash-service indicators as defined by the Greek agency, not the yields available to investors purchasing new Greek sovereign securities in the secondary market. Greek Public Debt Management Agency, General Government Debt Parameters, 2026.
This qualification changes the interpretation of debt affordability. A government paying a low effective rate on long-duration historical financing does not experience the same immediate budgetary effect as a government refinancing a large portion of its debt at higher marginal rates. Nevertheless, the apparent advantage can gradually diminish as official loans mature, market financing expands or the interest-rate terms of new liabilities become less favourable. Greece’s exceptionally long maturity profile delays this transition, but does not eliminate it indefinitely. Italy faces a different balance: its large stock of fixed-rate securities smooths the transmission of interest-rate shocks, but refinancing takes place against a substantially larger absolute debt stock. For an institutional assessment, the relevant comparison requires at least three separate measures: the average cost of existing debt, the weighted-average yield of new issuance and the projected cash interest expenditure over the debt-management horizon. None can substitute automatically for the others.
Table 2.1 — Sovereign debt structure and financing-risk comparison
| Dimension | Italy | Greece | Sovereign-risk implication |
|---|---|---|---|
| Gross debt, Q2 2026 | €3,208.524bn | €358.647bn | Italy’s nominal debt stock is approximately 8.95 times larger |
| Debt/GDP, Q2 2026 | 139.9% | 140.8% | Similar headline ratios conceal different cash-flow structures |
| Principal financing architecture | Predominantly market securities | Market securities plus extensive official-sector lending | Different reliance on recurring market refinancing |
| Average maturity | 7.9 years, end-2024 observation | 18.23 years, June 2026 | Greece has a substantially longer portfolio duration, subject to date comparability |
| Interest-rate protection | Fixed-rate securities alongside indexed and floating-rate exposures | PDMA reports 100% fixed-coupon exposure after relevant portfolio treatment | Different speeds of transmission from marginal market rates |
| Official institutional creditors | No comparable programme-era sovereign rescue structure | EFSF, ESM and other official lenders | Greece retains long-duration contractual support |
| Treasury liquidity | Managed through government cash and financial assets | €31.100bn general-government cash reserves, June 2026 | Cash buffers affect gross financing needs and liquidity resilience |
| Principal debt-management vulnerability | Large recurring refinancing and fiscal borrowing needs | Long-term official contractual obligations and eventual refinancing transition | Different risk horizons |
| Relevant comparison | Effective portfolio funding cost versus new issuance yields | Cash interest service including deferred obligations versus new issuance yields | Direct comparison requires matched definitions |
Sources: Eurostat, October 2026 Quarterly Government Debt; Greek PDMA, General Government Debt Parameters; Banca d’Italia, Public-Finance Statistics; European Stability Mechanism, Greece Financial Assistance.
Cash reserves, the distinction between gross and net debt, and the financing of extraordinary transactions
Government cash reserves provide an additional dimension of sovereign financing capacity that is not captured by the gross Maastricht debt ratio. The Greek Public Debt Management Agency reported general-government total cash reserves of €39.576 billion at the end of 2025, €31.100 billion at 30 June 2026 and an estimated €34.044 billion at 30 September 2026. Over the same dates, the published gross debt stock moved from €362.995 billion to €358.647 billion and then to €355.900 billion. The agency’s corresponding cash-adjusted debt figures were €323.349 billion, €327.537 billion and €321.856 billion. These observations indicate that changes in cash reserves can alter the apparent relationship between gross debt reduction and immediate liquidity capacity. They also show that a nominal decline in gross debt does not necessarily imply an identical improvement in the government’s position after deducting accessible cash assets. Greek Public Debt Management Agency, General Government Debt Parameters, 2026.
Table 2.2 — Greek general-government debt and liquidity indicators
| Indicator | 31 Dec 2025 | 30 Jun 2026 | 30 Sep 2026 |
|---|---|---|---|
| Gross debt, €bn | 362.995 | 358.647 | 355.900 |
| Total cash reserves, €bn | 39.576 | 31.100 | 34.044 |
| Debt less reported cash reserves, €bn | 323.349 | 327.537 | 321.856 |
| Weighted-average maturity, years | 18.36 | 18.23 | 18.14 |
| Average time to next refixing, years | 17.76 | 17.64 | 17.55 |
| Annual cash service cost, % | 1.33 | 1.43 | 1.44 |
| Cash service cost including deferred EFSF interest, % | 1.79 | 1.94 | 1.95 |
Source: Greek PDMA, General Government Debt Parameters. The September figures are agency estimates, not final Eurostat observations. Cash-adjusted debt is the agency’s stated measure, not a comprehensive national-accounts net-debt or net-worth concept.
A cash-adjusted measure may help evaluate immediate refinancing resilience, but it must not be confused with comprehensive net public debt, which would require a consistent accounting of financial assets and corresponding liabilities. Cash reserves may also contain accounts with different operational purposes and restrictions. In addition, using reserves to retire debt can improve the gross-debt stock while simultaneously reducing liquidity protection, creating a trade-off that is invisible in the headline debt-to-GDP ratio. Consequently, early repayment operations must be assessed in terms of both the liability extinguished and the financial asset or source of funding used to finance the transaction. This distinction applies equally to proceeds from privatisations, transfers between public entities and transactions involving previously accumulated fiscal reserves.
Refinancing vulnerability: why the same interest-rate shock does not generate the same fiscal outcome
The transmission of higher market yields into public-debt service is governed by the stock of liabilities requiring refinancing, the timing of those maturities, the amount of new borrowing necessary to finance deficits or asset acquisitions, and the share of outstanding liabilities linked directly to variable interest rates or inflation. A simplified sensitivity calculation illustrates the scale effect without substituting for a formal debt-management projection. If a permanent one-percentage-point increase in borrowing costs were transmitted instantaneously to Italy’s entire €3.208 trillion debt stock, the arithmetic annual cost would be approximately €32.085 billion. Applied to Greece’s €358.647 billion stock, the corresponding theoretical figure would be €3.586 billion. Neither figure is an estimate of the actual first-year fiscal impact, because the contractual interest rates of existing fixed-rate liabilities do not reset immediately. The exercise merely demonstrates the scale of each sovereign’s gross liabilities and the reason why a proper refinancing model must apply the shock only to the relevant debt tranches.
A more meaningful sensitivity structure distinguishes the debt already issued at fixed rates from securities maturing during the projection period, new borrowing needed to finance primary deficits or other cash operations, and instruments directly exposed to inflation or market-indexed coupons. The resulting interest expenditure must then be compared with the growth of nominal GDP and the primary surplus to determine whether the fiscal position can absorb the shock. Greece’s much longer maturity and refixing profile imply a slower initial transmission through the existing debt stock, while Italy’s broader market-financing requirements expose a larger volume of obligations to the recurring conditions of sovereign bond markets. The extent of this difference cannot be expressed responsibly as an exact annual interest-cost forecast without the full maturity distribution and instrument-specific repayment schedule for the same observation date.
Sovereign financing and the European financial system
Italy’s debt-market importance arises from the interaction between issuance scale, banking-sector holdings, insurance and pension portfolios, international investors and the collateral role of government securities in euro-area financial markets. Italian government bonds are not merely liabilities of the Treasury: they are also assets held by financial intermediaries and institutional investors, instruments used in secured financing, and reference securities in the broader domestic yield curve. A persistent increase in sovereign yields can therefore influence borrowing costs and asset valuations across the Italian economy, although the magnitude depends on the composition, accounting treatment and duration of those holdings. The Bank of Italy’s financial-stability and public-finance publications provide the competent institutional basis for monitoring this transmission. Banca d’Italia, Financial Stability Publications; Banca d’Italia, Public-Finance and Government-Debt Statistics.
Greece’s financial-market relationship is structurally different because official-sector creditors continue to account for a major portion of its long-term financing architecture. This provides protection against immediate refinancing shocks but also means that Greek debt sustainability remains interconnected with European institutional arrangements and the contractual treatment of public loans. In neither case does the nationality of a creditor automatically determine sovereign solvency. What matters is whether investors and official lenders are willing and contractually positioned to provide financing at a cost and maturity compatible with the sovereign’s expected primary resources. The institutional advantage of long official financing is therefore most accurately understood as an extension of the adjustment horizon rather than the elimination of the need for economic growth and fiscal discipline.
Key judgment — Chapter 2: Italy and Greece may approach the same gross-debt ratio without approaching the same financing-risk profile. Greece’s exceptional official-creditor arrangements and extended maturity schedule materially reduce the speed with which higher market rates affect existing liabilities. Italy’s refinancing system is more exposed to the scale and recurrence of market issuance, while its substantial stock of fixed-rate debt provides important but finite protection against abrupt interest-rate transmission. A valid comparative assessment must combine gross debt, creditor composition, cash reserves, contractual maturities and effective interest costs rather than substitute the Maastricht ratio for these variables.
Chapter 3 — Growth, Productivity and Fiscal Capacity: Italy’s Structural Constraints and Greece’s Post-Crisis Adjustment
Italy’s sovereign-debt problem is inseparable from the productivity performance of its economy
Italy’s difficulty in establishing a sustained downward public-debt trajectory cannot be explained solely by excessive annual deficits or the level of outstanding government liabilities. The deeper constraint is the interaction between a large inherited debt stock, limited potential output growth, population ageing, insufficient productivity gains and the fiscal demands created by social expenditure, public investment and economic adjustment. An economy with a debt ratio approaching 140% of GDP requires a durable combination of sufficiently rapid nominal GDP expansion and primary fiscal surpluses to counteract the interest burden on outstanding liabilities. When real output growth remains persistently weak, nominal GDP can expand through price increases, but reliance on inflation alone provides only limited and potentially temporary relief because inflation also affects indexed debt, public-sector expenditure, pension adjustments and the conditions under which new financing is obtained. The relevant problem is therefore not simply to increase the GDP denominator in a given year, but to strengthen the country’s capacity to generate sustainable real output, taxable income and public revenue without creating offsetting fiscal obligations.
The Organisation for Economic Co-operation and Development’s 2026 Economic Survey of Italy identifies weak productivity growth, an ageing workforce, relatively low employment rates among important demographic groups, high pension expenditure and elevated energy costs as continuing constraints on the country’s economic performance. The OECD also recognises important improvements in employment, institutional modernisation and investment associated with the National Recovery and Resilience Plan, but distinguishes these advances from a permanent increase in trend productivity. Its assessment emphasises the longstanding weakness of Italian labour-productivity growth relative to comparable advanced economies, including the stagnation of productivity after 2010 and the longer-term deterioration in multifactor productivity recorded over earlier decades. These structural features are central to sovereign debt sustainability because employment-led growth alone becomes increasingly difficult to maintain when the working-age population contracts, while productivity-led growth can expand both output per worker and the taxable economic base without depending exclusively on additional labour input. OECD, Economic Surveys: Italy 2026, April 2026.
A differentiated interpretation of Italian and Greek economic recovery
Greece’s economic performance after the sovereign-debt crisis must be assessed from a different starting point. The country experienced an exceptionally severe adjustment of its output, financial system and domestic demand during the crisis period, creating a substantial gap between actual activity and its earlier economic trajectory. Subsequent growth was therefore partly associated with the recovery of unused capacity, renewed investment, improvements in employment and the normalisation of financial conditions. Such recovery can generate several years of relatively strong growth without necessarily establishing an equivalent increase in long-term potential productivity. The OECD’s 2026 assessment of the Greek economy explicitly identifies the continuing investment gap, weak productivity gains and the difficulties faced by smaller enterprises in adopting digital technologies and innovation. It also recognises the contribution of capital deepening, employment creation and reforms to the recovery of income per capita. OECD, Foundations for Growth and Competitiveness 2026 — Greece, 9 April 2026.
The comparison therefore requires two different counterfactuals. For Italy, the relevant question is how much additional productivity and investment efficiency would be necessary to overcome a longstanding low-growth equilibrium. For Greece, it is how much of the recent recovery can be maintained once the temporary effects of post-crisis normalisation, exceptional public investment and European recovery financing have diminished. A faster Greek growth rate relative to Italy does not establish that Greece has eliminated its productivity weaknesses, just as Italy’s larger and more diversified industrial base does not establish that its present growth model can produce the nominal GDP expansion required for debt stabilisation. Indeed, different initial conditions create different possibilities for growth: an economy recovering from a large historical contraction may realise significant gains through capital utilisation and employment normalisation, while a mature industrial economy must rely more heavily on efficiency, innovation, investment quality and labour-force participation.
The nominal GDP arithmetic reveals the fiscal consequences of Italy’s growth deficit
The official national-account figures allow the aggregate nominal growth divergence to be quantified without relying on an assumed inflation series. Between 2022 and 2025, Italy’s nominal GDP increased from €1,998.269 billion to €2,265.003 billion, while Greece’s rose from €207.020 billion to €249.726 billion. These increases correspond to cumulative changes of approximately 13.3% and 20.6%, respectively. The euro-area EA21 historical aggregate expanded from €13,867.536 billion to €15,993.333 billion, equivalent to approximately 15.3%. The Greek expansion therefore exceeded that of both Italy and the euro-area aggregate during this interval, while the Italian increase was relatively weaker. These are calculated nominal GDP changes, not real growth differentials, and must not be interpreted as estimates of productivity. Eurostat, Provision of Deficit and Debt Data for 2025 — Second Notification, 21 October 2026.
Table 3.1 — Nominal GDP dynamics, 2022–2025
| Economy | 2022 GDP, €bn | 2025 GDP, €bn | Cumulative nominal growth | 2023 nominal growth | 2024 nominal growth | 2025 nominal growth |
|---|---|---|---|---|---|---|
| Italy | 1,998.269 | 2,265.003 | +13.3% | +7.18% | +3.21% | +2.46% |
| Greece | 207.020 | 249.726 | +20.6% | +8.71% | +5.62% | +5.06% |
| Euro area, EA21 historical aggregate | 13,867.536 | 15,993.333 | +15.3% | +6.73% | +4.26% | +3.63% |
Calculated from official nominal GDP observations in Eurostat, October 2026 Annual Government-Finance Notification. Annual growth rates are calculated using unrounded GDP observations.
The most important observation is the changing composition of debt-ratio adjustment over time. Italy’s strong nominal expansion during 2023 produced an unusually large denominator effect, capable of reducing the debt ratio even in the presence of a substantial government deficit. By 2025, the nominal growth rate had slowed to 2.46%, materially reducing the amount of debt-ratio relief generated by GDP expansion. Greece, by contrast, maintained nominal growth above 5% in 2025, creating a considerably stronger denominator effect on an initially larger debt ratio. The economic significance of these differences extends beyond the year in which they occur because sustained nominal GDP growth affects future fiscal revenues, debt affordability and the size of the primary surplus required to stabilise the debt stock.
Distinguishing real GDP growth, inflation and the GDP deflator
A decomposition of nominal economic growth requires separating the change in the volume of domestic production from changes in the prices of domestically produced goods and services. The appropriate price measure is the GDP deflator rather than the harmonised consumer-price index, because the latter measures prices paid for a defined consumption basket and includes imported consumer goods while excluding certain components of domestic production. This distinction is particularly important for economies exposed to substantial energy imports, tourism receipts, investment-price changes and international trade-price movements. A rise in consumer inflation caused by imported energy can reduce household purchasing power and increase production costs without producing an equivalent improvement in domestically generated nominal value added.
The European Commission’s May 2026 forecasts provide a useful illustration of these differences. For Italy, real GDP growth was projected at 0.5% in 2026 and 0.6% in 2027, against forecast consumer inflation of 3.2% and 1.8% respectively. For Greece, the corresponding real GDP growth forecasts were 1.8% and 1.6%, with consumer inflation forecast at 3.7% and 2.4%. These observations indicate a stronger projected real expansion in Greece, but the consumer inflation figures cannot be inserted directly into the nominal GDP identity as substitutes for the GDP deflator. Consequently, a calculation that simply adds the published consumer inflation rate to the real GDP growth forecast would not provide a defensible debt-sustainability projection. European Commission, Economic Forecast for Italy, 21 May 2026; European Commission, Economic Forecast for Greece, 21 May 2026.
Table 3.2 — European Commission macroeconomic forecasts, May 2026 vintage
| Indicator | Italy 2025 | Italy 2026 | Italy 2027 | Greece 2025 | Greece 2026 | Greece 2027 |
|---|---|---|---|---|---|---|
| Real GDP growth, % | 0.5 | 0.5 | 0.6 | 2.1 | 1.8 | 1.6 |
| Consumer inflation, % | 1.7 | 3.2 | 1.8 | 2.9 | 3.7 | 2.4 |
| Unemployment rate, % | 6.1 | 5.7 | 5.7 | 8.9 | 8.3 | 7.9 |
| General-government balance, % GDP | −3.1 | −2.9 | −2.9 | +1.7 | +0.8 | +0.6 |
| Debt/GDP, % | 137.1 | 138.5 | 139.2 | 146.1 | 140.7 | 134.4 |
Source: European Commission, Economic Forecast for Italy, May 2026; European Commission, Economic Forecast for Greece, May 2026. The forecast uses an earlier statistical vintage than the October 2026 Eurostat historical revision.
The forecast demonstrates that Greece’s expected debt reduction was supported by a combination of stronger real growth and a projected positive overall fiscal balance, whereas Italy was expected to retain a budget deficit close to 3% of GDP. The difference cannot be attributed solely to spending restraint, because the Greek fiscal outlook also reflects revenue performance, taxation, cyclical conditions and the effects of past structural adjustment. The Commission explicitly identified improvements in Greek tax compliance, particularly in relation to revenue collection, as a contributor to the country’s fiscal performance. Meanwhile, Italy’s fiscal position includes the legacy of previously recognised tax-credit expenditure and a relatively limited contribution from primary surpluses. Even where both countries experience an inflation shock, the effect on their respective debt ratios depends on how that shock alters domestic value added, fiscal revenue, indexed liabilities and public expenditure.
Productivity, capital accumulation and the limitations of employment-led growth
Italian economic growth over the past several decades has been constrained by insufficient productivity gains. This weakness is not adequately explained by the number of hours worked or the level of employment in isolation. Labour productivity depends on capital equipment available per worker, technological adoption, the organisation of production, management quality, human capital, the allocation of resources between firms and sectors, and the institutional environment in which investment and business activity take place. The OECD’s assessment places particular emphasis on Italy’s long-term productivity underperformance relative to other advanced economies, while noting that recent employment growth has supported economic activity and household incomes. An expansion of total hours worked can raise aggregate GDP, but if output per hour remains stagnant the resulting growth may prove difficult to sustain as the available labour force shrinks. OECD, Economic Surveys: Italy 2026.
Italy’s industrial structure creates both opportunities and constraints. The country’s manufacturing base includes internationally competitive enterprises, export-oriented industrial districts and sophisticated production capabilities, but aggregate productivity also depends on the performance of smaller companies, domestic services, public administration and sectors with limited investment in digital technologies and advanced management systems. The existence of productive industrial leaders does not necessarily translate into high national productivity growth if capital and labour remain concentrated in lower-productivity activities or if the diffusion of technology across the wider economy is slow. Policy interventions therefore need to distinguish investment in productive capacity from subsidies that primarily shift the timing or composition of expenditure. The relevant fiscal return depends on whether supported investment generates additional output that would not otherwise have occurred, whether it improves the economy’s productive efficiency and whether the resulting additional tax revenue can materially offset the original public cost.
Greece faces a related but distinct challenge. The OECD’s April 2026 assessment describes progress in capital deepening, employment and post-crisis economic recovery, but also identifies limited productivity improvements and a remaining investment gap. The persistence of many relatively small enterprises with difficulties adopting digital tools and innovation constrains the economy’s capacity to sustain convergence with the most productive European countries. Greece’s recent performance therefore illustrates the potential for a significant reduction in the debt ratio during a recovery phase, not a guarantee that the same pace can continue indefinitely. For sovereign-risk assessment, the distinction between cyclical recovery and an increase in potential output is essential because only the latter can generate a durable improvement in the economy’s ability to service debt without repeated fiscal tightening. OECD, Foundations for Growth and Competitiveness 2026 — Greece.
Demographic ageing transforms productivity into a fiscal necessity
Demographic ageing influences debt sustainability through several interconnected channels. A shrinking working-age population can reduce potential employment and the tax base, while a growing share of older residents can increase pension and healthcare expenditure. The severity of the resulting fiscal pressure depends on labour-market participation, the effective retirement age, migration, productivity growth, health outcomes and the institutional design of social expenditure. In a low-growth, high-debt economy, the problem is compounded because public spending commitments may continue increasing even as the share of the population generating employment-related contributions declines. Italy’s demographic structure therefore makes productivity growth and participation among currently underutilised groups particularly important components of long-term fiscal capacity.
The OECD identifies ageing and high pension expenditure among Italy’s structural economic challenges and links the longer-term growth outlook to the country’s weak productivity performance. It also identifies comparatively low employment participation among important population groups as an area where improvements could strengthen potential output. These considerations matter directly for public debt: increasing employment participation can expand the income-tax and social-contribution base, while raising productivity can support higher real wages and output without requiring a proportionate increase in hours worked. Nevertheless, the fiscal effect of participation reforms depends on implementation costs, the quality of employment created and the responsiveness of labour supply to institutional changes. The existence of additional potential workers does not guarantee that labour demand, skills and geographical mobility will be sufficient to absorb them into productive employment. OECD, Economic Surveys: Italy 2026.
For Greece, the demographic question interacts with the legacy of the sovereign crisis, investment gaps, migration and the productive structure of the economy. A period of rising employment can generate fiscal gains and reduce the apparent debt burden, but maintaining those gains requires continuous improvements in business investment, productive efficiency and workforce capabilities. The Greek adjustment should therefore be evaluated through measures of output per hour, capital formation, employment participation and the durability of tax collection, rather than exclusively through the decline in the Maastricht debt ratio.
Public investment: why expenditure volumes are not equivalent to economic returns
The Recovery and Resilience Facility has introduced a major investment and reform channel into the Italian and Greek economies, but the macroeconomic effect of these resources depends on the quality, implementation timing and additionality of the projects financed. Public investment can increase potential output through transport infrastructure, digital networks, energy-system modernisation, education, research capacity and improvements in administrative services. Its contribution to debt sustainability, however, cannot be inferred directly from the nominal value of the expenditure. A project may create immediate demand during construction but limited permanent productivity benefits if its design, geographic targeting, operation or maintenance arrangements are inadequate. Conversely, investment that removes a binding economic constraint may generate wider private investment and productivity gains over many years.
The Bank of Italy reported that Italian public investment reached 3.8% of GDP in 2025, its highest level since the beginning of the century, while the European Commission identified Recovery and Resilience Plan investment as a principal support for the country’s otherwise weak growth outlook. These findings establish that Italy has increased public capital expenditure, but do not demonstrate that the increase has already translated into a sustained acceleration of multifactor productivity. The distinction between expenditure committed, expenditure actually disbursed, completed capital assets and realised economic benefits is essential. A fiscal programme can be fully executed from an accounting perspective while still producing uncertain or delayed productivity returns. Banca d’Italia, The 2025 Annual Report at a Glance; European Commission, Economic Forecast for Italy, May 2026.
A complete assessment should distinguish between three investment effects. The first is the short-run demand contribution generated by project expenditure and related employment. The second is the medium-term supply effect associated with the completion and productive use of the assets created. The third is the long-run effect on private investment, innovation and the organisation of economic activity. These effects need not occur simultaneously, and the fiscal multiplier of public investment may vary according to the business cycle, import content, financing conditions and the availability of productive capacity. In an economy with high debt and limited fiscal space, the distinction becomes particularly consequential because the public resources used to finance investment have an opportunity cost and may generate additional interest expenditure or future maintenance obligations.
Tax capacity and the difference between fiscal consolidation and sustainable growth
The fiscal capacity of a sovereign depends not only on the statutory tax burden but also on the size and composition of its tax base, administrative effectiveness, compliance, informality, employment structures and the stability of the economic activities being taxed. A government can increase revenue temporarily through asset-related transactions, exceptional profits or inflation-driven changes in nominal tax receipts, but those effects may not provide a durable foundation for financing recurrent expenditure. Likewise, discretionary tax increases may improve the primary balance in the short term while reducing investment, labour supply or household demand if their economic incidence is poorly designed. The sovereign-debt problem therefore requires consideration of the economic effects of consolidation, rather than treating additional revenue or spending reductions as arithmetically neutral.
Greece’s recent fiscal performance has benefited from improved revenue collection and tax compliance according to the European Commission’s May 2026 assessment. The government was also expected to implement expansionary measures involving taxation, public wages and social benefits, while retaining a positive general-government balance through 2027. This combination illustrates an important distinction: fiscal sustainability depends on the full structure of revenue and expenditure, not solely on whether individual policy measures increase or reduce spending. The Commission projected a Greek general-government surplus of 0.8% of GDP in 2026 and 0.6% in 2027 under its May assumptions, indicating that the fiscal room for discretionary measures was supported by the expected underlying budget position. The durability of this room remains contingent on economic growth, revenue performance and the completion of temporary European investment financing. European Commission, Economic Forecast for Greece, May 2026.
For Italy, the Bank of Italy reported a 2025 primary surplus of 0.8% of GDP, following 0.5% in the preceding year, even as the general-government deficit remained at 3.1% of GDP. This difference illustrates the continuing importance of interest expenditure in a highly indebted sovereign. An overall deficit can coexist with a primary surplus because interest payments are excluded from the primary balance but included in the overall balance. Consequently, a government that improves its primary fiscal position can nevertheless experience an increase in gross debt if the existing interest burden and positive stock-flow adjustments exceed the combined debt-reducing effects of nominal GDP growth and the primary surplus. Banca d’Italia, The 2025 Annual Report at a Glance.
The medium-term growth problem after the Recovery and Resilience Facility investment cycle
The European Commission’s May 2026 forecasts explicitly anticipated a moderation of investment support as Recovery and Resilience Facility implementation approached completion. For Italy, investment associated with the recovery plan was expected to support economic activity in 2026, while the reduction of RRF-related capital expenditure would affect the fiscal and growth outlook in 2027. For Greece, investment financed through European funds was expected to remain an important support for growth in 2026, with the conclusion of the RRF implementation cycle contributing to a subsequent moderation. The economic significance of this transition is not the mechanical disappearance of all investment spending, because projects already completed may continue delivering economic benefits and governments may finance new investment through other instruments. The relevant question is whether the temporary increase in public expenditure produces a lasting expansion of productive capacity sufficient to sustain private investment and tax revenue after the exceptional financing programme has ended.
The Italian and Greek outcomes are likely to depend on different combinations of institutional efficiency and investment productivity. In Italy, the challenge is to convert an extensive reform and investment programme into higher output per worker, greater labour participation, stronger business innovation and reduced infrastructure constraints. In Greece, the challenge is to consolidate the gains of economic recovery while reducing the remaining investment and productivity gaps. Both face exposure to international energy prices and external demand, although their productive structures differ. Neither country’s debt trajectory can therefore be projected responsibly by extending a short period of favourable nominal GDP growth without testing its underlying drivers.
Structural comparison: the sources of sustainable fiscal capacity
Table 3.3 — Structural determinants of long-run debt sustainability
| Economic mechanism | Italian constraint | Greek constraint | Transmission to debt sustainability |
|---|---|---|---|
| Labour productivity | Longstanding stagnation and weak multifactor productivity | Post-crisis recovery with remaining productivity gap | Determines sustainable real GDP expansion |
| Employment | Low participation in important demographic groups | Employment recovery requiring further structural consolidation | Affects taxable labour income and contributions |
| Demography | Ageing workforce and high pension pressure | Demographic pressures and long-term labour supply constraints | Changes the ratio of taxpayers to expenditure beneficiaries |
| Capital accumulation | Investment quality, regional divergence and technology diffusion | Substantial remaining investment gap | Influences productive capital and future output |
| Firm structure | Uneven innovation and technology adoption across enterprises | Small-firm productivity and digitalisation challenges | Determines aggregate productivity transmission |
| Public investment | Converting high expenditure into productive completed assets | Maintaining investment momentum after exceptional funding | Affects short-run demand and potential output |
| Fiscal capacity | Interest burden and legacy financing effects | Maintaining revenue compliance and fiscal discipline | Determines feasible primary surpluses |
| External exposure | Energy costs, industrial competitiveness and international trade | Energy costs, external financing and sectoral composition | Alters real income, nominal output and fiscal revenue |
| European financing | Productive absorption and permanence of reforms | Investment financing and eventual transition from programme support | Determines the durability of post-RRF growth |
Analytical comparison based on OECD, Economic Surveys: Italy 2026, OECD, Foundations for Growth and Competitiveness 2026 — Greece, and the European Commission’s May 2026 economic forecasts. The entries identify structural mechanisms; they are not numerical risk scores.
The European comparison: why debt sustainability is increasingly differentiated across member states
The Italian–Greek divergence should not be interpreted as evidence that European sovereign-debt risk is confined to these two countries. France’s debt ratio reached 119.1% of GDP at the end of the second quarter of 2026, while Germany’s stood at 63.4%. The figures illustrate the substantial variation in fiscal starting positions among major European economies, but they are insufficient to establish the relative sustainability of those debts. France’s large public-debt stock and fiscal requirements create a separate source of potential euro-area financing pressure, while Germany’s lower starting ratio provides a different degree of fiscal flexibility. The United Kingdom, although outside the euro area, remains relevant through financial-market transmission, institutional investment, sterling financing conditions and European economic interdependence. However, its sovereign debt cannot be inserted into a Maastricht euro-area comparison without reconciling the national debt definitions and accounting conventions. Eurostat, Government Debt at 88.8% of GDP in the Euro Area, 21 October 2026.
The broader implication is that the European fiscal framework operates across economies with sharply different demographic structures, nominal growth rates, debt maturity profiles and investment requirements. Identical numerical fiscal targets can therefore produce different economic and political adjustment costs. A government with strong potential growth may reduce its debt ratio through a combination of moderate fiscal restraint and expanding nominal GDP, whereas an economy with stagnant productivity may require larger primary surpluses to achieve the same arithmetic result. Yet excessively rapid consolidation can itself weaken demand and investment, potentially reducing the GDP denominator and worsening the short-run debt ratio. This interaction is especially important for high-debt sovereigns because fiscal adjustment must be evaluated according to its effects on the future economy as well as its immediate contribution to the primary balance.
The institutional consequences of persistent growth divergence
A prolonged divergence between Italian and Greek debt dynamics would not merely change the ranking of the European Union’s most indebted member states. It could alter the distribution of fiscal adjustment requirements, the credibility of medium-term expenditure commitments and the political priorities associated with common European financing instruments. Italy’s industrial and economic scale makes its fiscal position important for wider European investment, infrastructure, defence and energy-policy discussions, whereas Greece’s recovery offers an example of the debt-reducing effects of nominal growth and fiscal improvement under a distinctive official-financing architecture. Neither experience can be transferred mechanically to the other: the historical depth of the Greek adjustment and the exceptional contractual characteristics of its public debt distinguish its circumstances from those of Italy.
The central uncertainty is whether the Italian economy can raise its structural rate of productivity growth sufficiently to reduce the primary fiscal adjustment necessary for debt stabilisation, and whether Greece can sustain its recovery once the temporary elements of post-crisis normalisation and European financing diminish. These questions require monitoring of realised productivity, investment completion, revenue performance and the annual debt decomposition. Short-term changes in government bond yields or quarterly debt ratios may provide useful signals, but they cannot substitute for the longer-term evidence concerning potential growth and fiscal capacity.
Key judgment — Chapter 3: Italy’s debt sustainability is constrained by the interaction between a large inherited liability stock, weak underlying productivity growth, demographic ageing and the continuing cost of financing existing obligations. Greece has experienced a stronger nominal GDP expansion and fiscal recovery, but its structural investment and productivity challenges remain material. The decisive difference for the years ahead is whether each economy can translate investment, institutional reform and employment gains into durable productive capacity and primary fiscal resources. An Italian–Greek debt-ratio reversal would be an observable consequence of those underlying dynamics, not an independent measure of the success or failure of either country’s economic policy.
WordPress Analytical Scheme — The Four Forces Behind Sovereign Debt Dynamics
The following component is designed specifically for insertion immediately after Table 1.3 in Chapter 1. It provides an interactive decomposition of the annual debt-ratio movements for Italy, Greece and the euro area, with three-dimensional animated bars, selectable countries and years, an integrated accounting table, and explanatory text in English, Italian, Spanish, French and German.
It visualises the exact accounting contributions already established: deficit, nominal GDP denominator effect and stock-flow adjustment. It does not misrepresent the deficit as a separately observed primary-balance or interest contribution.
The component uses Shadow DOM encapsulation and scoped styles, with no external dependencies, network requests, font imports or changes to global WordPress settings. Its source observations are those published in Eurostat, Provision of Deficit and Debt Data for 2025 — Second Notification, 21 October 2026.
Placement: Chapter 1, immediately following Table 1.3, where the separation of fiscal balances, GDP-denominator effects and stock-flow adjustments is explained. The ordinary analytical tables remain part of the report; this isolated interactive component supplements them without replacing their full source attribution.
Confidence assessment for Pillar I: High for the annual and quarterly debt observations, the reconstructed accounting identities, and the documented differences in creditor structures. Moderate for the persistence of the observed growth and debt divergence after 2026, given uncertainty regarding productivity, nominal GDP growth, fiscal execution, legacy tax-credit settlement and future borrowing conditions.
What would change the assessment: Revised Eurostat debt and deficit observations, a complete transaction-level reconciliation of stock-flow adjustments, updated comparable maturity and interest-cost statistics for both countries, and realised productivity and primary-balance performance inconsistent with the present structural trajectory. These are the principal observations necessary to move from an established historical divergence to a more confident forward debt-sustainability assessment.
PILLAR II — EUROPEAN FISCAL GOVERNANCE, FINANCIAL STABILITY AND GEOPOLITICAL TRANSMISSION
Italy and Greece: Fiscal Sovereignty, European Monetary Stability and the Strategic Distribution of Economic Risk
OPEN-SOURCE ANALYTICAL ASSESSMENT
Evidence cut-off: 8 November 2026
Chapter 4 — Fiscal Policy, Superbonus and the Reformed European Economic Governance Framework
The decisive fiscal development of 2026 is the growing separation between budgetary compliance and debt sustainability
The fiscal challenges facing Italy in November 2026 have entered a more complicated institutional phase than the conventional distinction between compliance and non-compliance with the European Union’s deficit limits would suggest. Italy remains subject to the excessive-deficit procedure initiated in July 2024, although the European Commission concluded in June 2026 that the authorities had taken effective action, allowing the procedure to remain in abeyance. At the same time, the government has presented a revised medium-term fiscal outlook in which the general-government deficit is expected to fall below 3% of gross domestic product in 2026 before temporarily exceeding that threshold in 2027 and 2028. This apparent contradiction reflects three different fiscal realities: the legal assessment of expenditure growth under the reformed European framework, the economic trajectory of the public-debt stock, and the political decision to accommodate additional defence and energy-security expenditure under exceptional fiscal flexibility. The convergence between Italian and Greek sovereign-debt ratios consequently occurs at a moment when the definition of acceptable fiscal adjustment is itself being tested against geopolitical priorities, monetary conditions and the legacy of extraordinary national expenditure programmes. Council Recommendation of 10 July 2026 on the Economic, Social, Employment, Structural and Budgetary Policies of Italy — Council of the European Union, September 2026; Excessive Deficit Procedure — Italy — European Commission.
The principal analytical judgment is that compliance with an approved net-expenditure trajectory and stabilisation of the Maastricht debt ratio are related but not identical outcomes. The reformed economic-governance framework places the operational emphasis on the growth of nationally financed net primary expenditure, subject to specified adjustments and institutional monitoring. Debt sustainability continues to underpin the construction of the expenditure path, but the annual evolution of gross debt also depends on interest costs, nominal GDP growth, stock-flow adjustments and financing operations. It is therefore possible for a government to respect its expenditure ceiling while its debt ratio continues increasing, particularly when earlier fiscal transactions generate debt-financing requirements after their initial accrual recognition. Conversely, a temporary expenditure deviation does not necessarily establish an immediate deterioration in debt sustainability if it occurs alongside stronger growth, offsetting revenues or a favourable debt-management position. For Italy, whose debt stock exceeded €3.2 trillion by June 2026, the distinction is central to assessing whether the European rules are constraining the underlying accumulation of liabilities or primarily the fiscal transactions included in the expenditure indicator.
Italy’s revised 2026–2029 fiscal programme introduces a second adjustment problem
The Ministry of Economy and Finance’s fiscal planning framework changed materially during October 2026. The government’s Documento programmatico di finanza pubblica 2026, approved on 2 October and transmitted to Parliament, updated the macroeconomic and public-finance outlook used to prepare the budget for 2027–2029. The European Commission subsequently registered Italy’s 2027 Draft Budgetary Plan, dated 15 October 2026, while the Italian State General Accounting Department reported that the government had approved and presented the 2027 Budget Bill to the Chamber of Deputies by 5 November. As of the present assessment date, that bill is a legislative proposal undergoing parliamentary consideration, not an enacted budget. This distinction is important because proposed expenditure, parliamentary amendments, legally authorised appropriations and realised cash disbursements are different stages of fiscal implementation. Presentato al Parlamento il Documento Programmatico di Finanza Pubblica 2026 — Ragioneria Generale dello Stato, 8 October 2026; Draft Budgetary Plans 2027 — European Commission, October 2026; Approda in Parlamento il Disegno di Legge di Bilancio 2027 — Ragioneria Generale dello Stato, 5 November 2026.
The revised government programme, as documented in Morningstar DBRS’s October 2026 sovereign-credit assessment, anticipates real GDP growth of 1.0% in 2026, followed by 0.8% in 2027 and 0.9% in 2028. These assumptions are more favourable for 2026 than those used in the European Commission’s May forecast, which had projected real expansion of only 0.5%. The government also projects a 2026 general-government deficit of 2.9% of GDP and a primary surplus of 1.2%, followed by a deterioration of the overall fiscal balance to deficits of 3.4% in 2027 and 3.2% in 2028 before an improvement to 2.3% in 2029. The revised trajectory incorporates the intended use of exceptional fiscal flexibility to finance additional spending associated with energy security and defence. These numbers represent the government’s policy scenario as reported and evaluated by the rating agency; they are not realised fiscal results or independent European Commission endorsements of the entire revised programme. Morningstar DBRS Confirms Republic of Italy at A (low), Stable Trend — Morningstar DBRS, 16 October 2026.
Table 4.1 — Italy’s revised fiscal programme: government projections and observed starting conditions
| Indicator | 2025 observed | 2026 projected | 2027 projected | 2028 projected | 2029 projected |
|---|---|---|---|---|---|
| Real GDP growth, % | 0.6, revised national accounts | 1.0 | 0.8 | 0.9 | Not established here |
| General-government balance, % GDP | −3.1 | −2.9 | −3.4 | −3.2 | −2.3 |
| Primary balance, % GDP | +0.8 | +1.2 | Not separately established | Not separately established | Further consolidation required |
| Government debt, % GDP | 136.7 | 138.1 | 138.5 | 137.9 | 136.6 |
| Interest expenditure, % GDP | 3.8 | 4.2 | Rising in programme | Rising in programme | 4.7 |
| Housing tax-credit-related additional borrowing, % GDP | Not reconciled here | 1.9 | 1.1 | Approximately 0.2 | Approximately 0.2 |
| General-government deficit below 3% GDP | No | Projected yes | Projected no | Projected no | Projected yes |
Source: Morningstar DBRS, Sovereign Rating Confirmation and Analysis of Italy’s October 2026 DPFP, 16 October 2026, with the official programme’s existence and submission independently established by the Ragioneria Generale dello Stato, 8 October 2026. The 2025 real-growth figure reflects the subsequent national-accounts revision; it differs from the earlier Commission forecast vintage. Missing cells must not be interpreted as zero.
The revised programme introduces an unusually demanding medium-term fiscal sequence. The government anticipates a temporary deterioration in the overall deficit during 2027–2028 while maintaining the proposition that the debt ratio will peak in 2027 and begin declining from 2028. Its credibility therefore depends on the relationship between the timing of additional expenditure, nominal GDP growth, the primary surplus, the existing interest burden and the anticipated reduction in stock-flow adjustments associated with residential tax credits. The projected decline from 138.5% of GDP in 2027 to 136.6% in 2029 is contingent, rather than automatic. The credibility challenge is heightened by the expected rise in interest expenditure from 3.8% of GDP in 2025 to 4.7% by 2029, an increase of approximately 0.9 percentage points of GDP. On an unchanged economic base, that increase would require a corresponding improvement in the primary fiscal position merely to prevent deterioration in the overall budget balance. The actual adjustment requirement depends on nominal GDP growth, the evolving debt stock and fiscal measures affecting revenues and expenditure.
The European net-expenditure framework imposes legally relevant constraints that are not equivalent to conventional spending caps
The reformed European economic-governance framework, adopted in 2024, established national medium-term fiscal-structural plans as the central instruments of fiscal surveillance. Regulation (EU) 2024/1263 provides the preventive framework, while the revised corrective rules operate through the Stability and Growth Pact and Article 126 of the Treaty on the Functioning of the European Union. Under this architecture, the operational indicator is net expenditure, defined through a series of exclusions and adjustments intended to focus monitoring on the expenditure items more directly controlled by national governments. The indicator excludes interest expenditure, certain revenue-financed European Union programme spending, the national co-financing of eligible Union programmes, cyclical unemployment expenditure and specified one-off or temporary measures, while also accounting for discretionary revenue measures. A net-expenditure growth ceiling therefore cannot be interpreted as a numerical limit on total government spending, gross borrowing, interest payments or military investment. Regulation (EU) 2024/1263 on the Effective Coordination of Economic Policies and Multilateral Budgetary Surveillance — European Parliament and Council, April 2024; Economic Governance Framework — Council of the European Union.
Italy’s Council-endorsed fiscal-structural plan covers 2025–2029 and provides for an adjustment period extending over seven years, supported by reform and investment commitments. The Council established maximum annual net-expenditure growth rates of 1.3% for 2025, 1.6% for 2026, 1.9% for 2027, 1.7% for 2028 and 1.5% for 2029. These rates correspond to maximum cumulative growth rates, calculated against the specified 2023 base, of −0.7% in 2025, 0.9% in 2026, 2.8% in 2027, 4.6% in 2028 and 6.2% in 2029. The cumulative ceiling is not simply the unadjusted sum of the annual rates because the path uses its designated reference base and fiscal-accounting methodology. The distinction matters because a government can record a limited annual deviation while its cumulative expenditure position remains within, or moves outside, the authorised trajectory. Council Recommendation on the Economic, Social, Employment, Structural and Budgetary Policies of Italy — Council of the European Union, 10 July 2026, recitals 7 and 16–18.
Table 4.2 — Italy’s Council-endorsed net-expenditure trajectory
| Fiscal year | Maximum annual net-expenditure growth | Maximum cumulative growth relative to 2023 | Institutional relevance |
|---|---|---|---|
| 2025 | 1.3% | −0.7% | First year of the endorsed plan |
| 2026 | 1.6% | +0.9% | Corrective path under excessive-deficit surveillance |
| 2027 | 1.9% | +2.8% | Continued adjustment and fiscal flexibility assessment |
| 2028 | 1.7% | +4.6% | Medium-term consolidation and reform implementation |
| 2029 | 1.5% | +6.2% | Final year of the national fiscal-structural plan |
Source: Council Recommendation C/2026/3925, 10 July 2026, published 1 September 2026. These are authorised expenditure-path parameters, not realised expenditure growth or projected government-deficit ratios.
The Commission’s June 2026 assessment found that Italian net expenditure had grown by 1.5% in 2025, exceeding the recommended annual maximum by 0.2 percentage points of expenditure growth. Under the Commission’s fiscal-monitoring calculation, the corresponding annual deviation was approximately 0.1% of GDP, with a cumulative deviation of less than 0.1% of GDP over the relevant 2024–2025 period. Net-expenditure growth in 2026 was then projected at 1.4%, below that year’s 1.6% ceiling, bringing the cumulative projection within the endorsed path. The Commission therefore judged Italy’s corrective action sufficient for the excessive-deficit procedure to remain in abeyance. This finding did not terminate the procedure, certify medium-term debt sustainability or pre-authorise any future deviation. It established that, under the evidence available at the assessment date, the country had not failed the relevant effective-action test. Council Recommendation C/2026/3925, recitals 16–18.
The excessive-deficit procedure and the control account create separate enforcement channels
Under the revised framework, fiscal surveillance involves both the excessive-deficit criterion and compliance with the medium-term net-expenditure path. A deficit exceeding the Treaty reference value of 3% of GDP can trigger consideration of an excessive-deficit procedure, while an excessive debt position is assessed through the degree of compliance with the authorised expenditure trajectory and the sustainability framework. The Council’s explanation of the reformed rules identifies control-account deviation thresholds of 0.3% of GDP annually and 0.6% of GDP cumulatively as relevant to the consideration of a debt-based procedure. Those thresholds must not be confused with the numerical difference between actual and permitted expenditure growth rates, and exceeding a threshold does not mechanically predetermine the final Council decision without the legally required assessment of relevant factors. Council of the European Union, Economic Governance Framework — Excessive-Deficit Procedures.
For Italy, this creates a complex relationship between the planned 2027–2028 deficits and European surveillance. A deficit above 3% of GDP would ordinarily be significant under the Treaty criterion. However, the government intends to rely on a specific national escape-clause mechanism for exceptional expenditure associated with defence and energy security. As of 8 November 2026, the documentary record establishes a Commission recommendation concerning Italy’s requested flexibility, while the Council’s published list of previously activated national escape clauses does not establish completed Council activation for Italy. Accordingly, the government’s projected use of flexibility must be treated as a policy assumption subject to the applicable institutional procedure, rather than an already unconditional exemption. By contrast, the Council records an October 2026 agreement extending the application of Greece’s defence-related flexibility to additional energy-security measures. Fiscal Surveillance in Italy — European Commission, October 2026; National Escape Clause for Defence Expenditure — Council of the European Union, updated 2026.
The Superbonus mechanism exposes a structural difference between fiscal accounting and financing needs
Italy’s housing-renovation incentives remain highly relevant because their impact on the debt stock can continue long after the expenditure was recorded in the accrual-based deficit. The central accounting mechanism is the distinction between recognition of a payable tax credit when the qualifying entitlement arises and the subsequent use of that credit to extinguish tax liabilities or generate other cash settlements. Under European statistical rules, expenditure associated with qualifying payable tax credits may be recorded when the entitlement is established, while the cash-financing effects are distributed over later periods. The accounting deficit therefore reflects the creation of an obligation at one stage, while actual government borrowing may increase at another stage when tax receipts are reduced or other settlement mechanisms operate. This is a timing distinction, not an assertion that the expenditure is recorded twice. Eurostat, Manual on Government Deficit and Debt — Implementation of ESA 2010, 2022 Edition; Council Recommendation C/2026/3925, recital 13.
The October 2026 Italian fiscal programme provides a more specific forward estimate of the remaining financing pressure. Morningstar DBRS reports government estimates that additional borrowing associated with housing tax credits, including Superbonus and building-façade incentives, will amount to approximately 1.9% of GDP in 2026 and 1.1% in 2027, before falling to around 0.2% annually in 2028–2029. These figures refer to projected additional financing effects associated with tax credits; they are not new annual programme authorisations, the aggregate fiscal cost of the original incentives, or audited cash outlays already completed. They also should not automatically be treated as the entirety of annual stock-flow adjustments, which incorporate other transactions. Their importance is that they make the expected reduction in the legacy financing burden an explicit condition underlying the projected debt-ratio decline after 2027. Morningstar DBRS, Republic of Italy — Sovereign Rating Confirmation, 16 October 2026.
Table 4.3 — The post-accrual financing burden of Italian housing tax credits
| Reference year | Projected additional borrowing associated with housing tax credits | Accounting classification | Principal assessment |
|---|---|---|---|
| 2026 | 1.9% of GDP | Forecast financing effect | Material pressure on gross debt despite lower current deficit |
| 2027 | 1.1% of GDP | Forecast financing effect | Legacy credit settlement remains substantial |
| 2028 | Approximately 0.2% of GDP | Forecast financing effect | Significant expected reduction |
| 2029 | Approximately 0.2% of GDP | Forecast financing effect | Smaller residual effect, subject to execution |
Source: Morningstar DBRS, Analysis of Italy’s 2026 Fiscal Planning Document, 16 October 2026, attributing the underlying financing projections to the Italian authorities.
The decline projected after 2027 is strategically important because it changes the fiscal effort required to stabilise the debt stock. If the residual financing burden were to diminish as projected, the government could experience a significant improvement in gross-debt dynamics without an equivalently large improvement in the contemporaneous deficit, simply because fewer previously recognised obligations would require new financing. Conversely, if the settlement schedule proved slower or more expensive than expected, the debt ratio could continue to rise despite compliance with the net-expenditure path. The second possibility would not necessarily establish that current spending had increased unexpectedly; it could instead indicate that the conversion of legacy credits into cash-financing requirements had differed from the planning assumptions. The key monitoring requirement is therefore a reconciliation between outstanding credits, their maturity or utilisation schedules, actual Treasury financing needs and their treatment in the annual debt accounts.
Defence, energy security and the political economy of exceptional fiscal flexibility
The extension of fiscal flexibility to defence and energy-security expenditure creates an additional institutional complication. Governments are facing investment requirements associated with military readiness, industrial capacity, energy resilience and strategic infrastructure at a time when debt-service expenditure is also increasing. These spending categories have different economic characteristics. Some military purchases are recorded as capital formation under national accounts, while others constitute current expenditure; some strategic energy investments create productive public assets, while temporary household compensation or tax relief primarily affects disposable income and consumption. Treating all such measures as economically equivalent merely because they arise from a common geopolitical emergency would obscure their different growth effects and long-term fiscal consequences.
The Italian authorities’ proposed temporary expenditure increase is reported at approximately 0.3% of GDP in each of 2027 and 2028 for the additional defence and energy-security measures covered by the planned flexibility. The important qualification is that exceptional treatment under the fiscal framework does not eliminate actual fiscal costs, sovereign borrowing or future interest expenditure. It modifies how authorised deviations are assessed for compliance. A sovereign spending an additional amount under an approved escape clause must still finance that amount through revenue, asset transactions, borrowing or another lawful financing arrangement. The potential fiscal benefit therefore lies in avoiding a mechanically procyclical adjustment or enabling strategically necessary expenditure, not in making the underlying expenditure disappear from the government’s economic balance sheet. Morningstar DBRS, October 2026 Rating Assessment; Council of the European Union, National Escape Clause for Defence Expenditure.
The political constraints are equally consequential. Italy’s government must reconcile the priorities of its governing coalition, parliamentary budget approval, national investment requirements, social expenditure, European fiscal surveillance and market confidence. The prospect of a parliamentary election no later than 2027 introduces uncertainty concerning the durability of spending commitments and the political willingness to deliver the primary surpluses required after the temporary flexibility period. This is not evidence that fiscal consolidation will fail or that a particular political outcome is predetermined. It is a source of implementation uncertainty because a medium-term fiscal programme extends beyond individual annual budget decisions and may require adjustments under a subsequent parliamentary majority. The rating agency’s October assessment explicitly identifies the reaffirmation of medium-term fiscal discipline after the election as an important condition for its credit outlook. Morningstar DBRS, Republic of Italy — Credit Rating Rationale, 16 October 2026.
Fiscal credibility depends on institutions, cash-flow execution and the composition of adjustment
A credible medium-term fiscal programme must demonstrate more than a numerical sequence of projected deficits. It requires a legally authorised expenditure path, realistic macroeconomic assumptions, identifiable measures supporting the primary balance, a financing strategy consistent with market absorption capacity and a transparent reconciliation between cash and accrual accounts. The distinction is particularly important when the projection assumes that a large stock-flow burden will diminish sharply after a particular year. The projected reduction of Superbonus-related borrowing from 1.1% of GDP in 2027 to approximately 0.2% in 2028 is potentially beneficial, but it should be assessed against actual tax-credit utilisation and settlement data rather than taken as proof of an already completed fiscal adjustment.
Key judgments — Chapter 4. Italy’s fiscal position is governed by three interacting constraints: the European net-expenditure path, the financing consequences of legacy obligations and the requirement to accommodate strategic spending without undermining debt sustainability. The government’s revised October 2026 programme anticipates a temporary deterioration in overall deficits alongside a projected debt-ratio peak in 2027, making the reduction in tax-credit financing effects and the persistence of primary surpluses central conditions of success. The decisive institutional distinction is that an excessive-deficit procedure held in abeyance, a proposed use of exceptional fiscal flexibility and a forecast decline in the debt ratio represent three separate legal and economic states. Their combination should not be presented as unconditional European approval of the government’s complete medium-term financing strategy.
Chapter 5 — Sovereign-Bond Markets, Rating Agencies and the Bank–Sovereign Nexus
Sovereign-market stability depends on financing conditions, investor balance sheets and monetary-policy transmission
The relationship between Italian government debt and euro-area financial stability cannot be understood through the sovereign spread alone. The spread between Italian government bonds and corresponding German federal securities is an important market indicator, but it measures only one component of the country’s financing environment: the difference in observed yields between two instruments with comparable maturities. A higher Italian yield may arise because the euro-area risk-free yield curve has shifted, because investors demand additional compensation for Italian sovereign credit or liquidity risks, because term premia have changed, or because several of these forces operate simultaneously. The economic consequences are correspondingly different. A generalised increase in German, Italian and Greek sovereign yields may raise refinancing costs across the monetary union without producing a major change in bilateral spreads, whereas an Italy-specific widening can indicate deterioration in the country’s relative financing conditions. In either case, the consequences for government interest expenditure depend on the maturity of the existing portfolio, issuance volumes, inflation-linked liabilities and the rate at which outstanding obligations are refinanced.
The European Central Bank’s May 2026 Financial Stability Review identified a combination of increasing sovereign issuance requirements, renewed inflation concerns, higher term premia and geopolitical uncertainty as sources of pressure on euro-area sovereign markets. The ECB also observed that government financing could become more sensitive to shorter-term interest-rate movements as some issuers adapted the maturity of new debt to changing investor demand. The implications extend beyond governments because sovereign yields serve as valuation references for financial securities, collateral and institutional portfolios, while public-debt holdings constitute an important component of bank liquidity buffers. Consequently, sovereign-market vulnerabilities are not transmitted exclusively through an increase in the interest expenditure of the issuing Treasury. They can also affect securities valuations, bank funding, the cost of corporate borrowing and the willingness of intermediaries to extend credit. Financial Stability Review, May 2026 — European Central Bank.
The yield curve must be examined as a financing system rather than a single benchmark
Italy’s yield curve transmits the interaction between expected monetary policy, term premia, sovereign-specific risk compensation and the Treasury’s issuance decisions. Short-dated securities respond relatively rapidly to expected policy-rate movements and money-market conditions, while longer-dated securities incorporate expectations concerning future nominal rates, inflation uncertainty, term premia and the capacity of the sovereign to maintain a credible fiscal trajectory. The spread between ten-year Italian and German bonds therefore provides a useful market convention but does not describe the entire refinancing problem. A sovereign may experience a relatively stable ten-year spread while its short-term financing costs rise significantly because the underlying policy-rate expectations have changed. Conversely, a widening at longer maturities may indicate investor uncertainty concerning future fiscal adjustment even if near-term Treasury bill issuance remains manageable.
The relevant financing assessment must therefore combine the term structure of yields with the residual maturity distribution of outstanding debt and the calendar of future issuance. The interaction is particularly consequential when governments seek to limit immediate borrowing costs by increasing shorter-dated issuance. Such operations may reduce the term premium paid at issuance but increase exposure to future refinancing and policy-rate changes. Issuing longer-dated securities may lock in financing costs for an extended period but require a larger immediate term premium. Neither strategy is universally preferable; the economic consequences depend on the market yield curve, investor demand, refinancing concentration and the sovereign’s tolerance for future interest-rate risk. The ECB’s May 2026 review specifically describes shifts in institutional investor demand and the attractiveness of shorter-dated issuance as relevant developments in euro-area sovereign financing. European Central Bank, Financial Stability Review, May 2026, sections 1.2 and 2.2.
The April 2026 Financial Stability Report of the Bank of Italy provides an important distinction between general market shocks and Italian-specific deterioration. The Bank reported that the escalation of conflict in the Middle East had raised Italian government bond yields and, to a lesser extent, the spread over German Bunds. This indicates that a portion of the observed rise in Italian borrowing costs reflected a broader adjustment in interest-rate expectations or market conditions rather than an exclusively Italy-specific repricing. It also demonstrates why comparisons between yields observed on different dates can be misleading: a sovereign spread measured before a major geopolitical event cannot be treated as directly equivalent to a yield measured after that event without identifying the movement in the common risk-free component. Financial Stability Report No. 1/2026 — Banca d’Italia, 29 April 2026.
Measuring the Italian–Greek spread requires an identical market convention
The comparison between Italian and Greek sovereign bond yields introduces further complications because both countries issue securities with different maturities, liquidity characteristics and free-float structures. A ten-year Italian government bond and a ten-year Greek government bond may both be denominated in euros, but they do not necessarily carry equivalent liquidity premia, coupon structures or remaining maturities on the observation date. Greece’s long-term official-sector obligations are not traded on the same terms as its outstanding market bonds, and their contractual financing conditions therefore cannot be inferred from the yield of a newly issued or benchmark Greek security. The market yield measures the price of marginal financing or the valuation of existing market debt, not the average cost of the entire general-government liability portfolio.
The most rigorous approach is to compare contemporaneous, maturity-matched sovereign yields using a consistent statistical source. The European Central Bank maintains harmonised long-term government interest-rate statistics for European Union member states, including euro-denominated reference yields for euro-area participants. These series are suitable for identifying medium-term movements in sovereign financing conditions, but a monthly series must not be presented as an intraday or end-of-week trading quote. The ECB’s methodology also notes that substitutes may be used where harmonised government-bond indicators are unavailable, making the precise definition of each series relevant to comparison. Long-Term Interest Rate Statistics — ECB Data Portal; Long-Term Interest Rate Statistics for EU Member States — European Central Bank.
A defensible assessment of Italian–Greek sovereign spreads should therefore distinguish the Italy–Germany differential, the Greece–Germany differential and the direct Italy–Greece differential, all measured on the same date and at the same maturity. Their relative movement would be more informative than the absolute ranking of debt ratios. A Greek yield below the Italian yield would not establish that Greece had become economically stronger than Italy in every relevant respect; it could instead reflect the duration of official financing, the size and liquidity of the marketable bond stock, different expected issuance requirements and investor perceptions of fiscal execution. Similarly, an Italian spread narrowing during a period of rising global yields would not necessarily imply lower absolute borrowing costs. The correct assessment must preserve the distinction between the price of marginal borrowing, the existing portfolio’s effective interest cost and the sovereign’s future gross financing requirements.
Rating agencies evaluate repayment capacity, not simply the size of the debt ratio
The October 2026 sovereign-rating assessment by Morningstar DBRS provides a detailed view of the interaction between Italian public debt, economic resilience and European institutional support. On 16 October 2026, the agency confirmed Italy’s long-term issuer ratings at A (low) with a Stable trend. The confirmation reflected the agency’s assessment that Italy’s fiscal-consolidation strategy remained broadly on track despite a difficult external environment, while the country’s large diversified economy, external position, banking-system improvements and euro-area institutional framework continued to support its credit profile. The agency simultaneously identified high public debt, rising interest expenditure and weak potential GDP growth as fundamental constraints. This combination illustrates why a sovereign rating cannot be reduced to a mechanical debt-to-GDP threshold: it reflects a broader judgment concerning economic structure, institutions, fiscal policy, liquidity, external balances and financial stability. Morningstar DBRS Confirms Republic of Italy at A (low), Stable Trend — Morningstar DBRS, 16 October 2026.
The Italian sovereign had also benefited from rating improvements or positive outlook decisions from other agencies. Moody’s upgraded Italy to Baa2 from Baa3 on 21 November 2025 and assigned a Stable outlook, citing policy continuity, reforms and progress on fiscal consolidation. Standard & Poor’s affirmed Italy’s BBB+ long-term rating on 30 January 2026 while revising the outlook to Positive from Stable. These are agency-specific decisions based on different methodologies, and the rating symbols are not directly interchangeable without reference to each agency’s scale and definitions. The existence of different ratings does not represent an accounting contradiction: sovereign assessments incorporate both quantitative indicators and qualitative judgments, including expectations of future reforms and policy credibility. Moody’s Ratings Upgrades Italy’s Ratings to Baa2, Changes Outlook to Stable — Moody’s Ratings, 21 November 2025; UniCredit Mortgage Covered Bonds Outlook Revised Following Italy’s Sovereign Outlook Change — S&P Global Ratings, 13 February 2026.
Greece’s credit-rating position reflects a different trajectory. The Greek Public Debt Management Agency’s rating register, updated on 26 October 2026, records a BBB rating with Stable outlook from Standard & Poor’s following its 23 October review; Baa3 with Positive outlook from Moody’s after its September review; BBB with Stable outlook from Fitch following its May assessment; BBB with Positive outlook from Morningstar DBRS; and BBB+ with Stable outlook from Scope Ratings. The register also identifies the dates of future scheduled reviews, thereby providing a useful institutional calendar for monitoring potential changes in financing conditions. The significance of Greece’s return to investment-grade status is not merely symbolic. Investment-grade ratings can affect the mandates of institutional investors, eligibility for particular investment strategies and collateral arrangements, although the exact effect depends on the individual institution and the applicable rules. Credit Rating — Public Debt Management Agency of Greece, updated 26 October 2026.
Table 5.1 — Verified sovereign-credit assessments relevant to the 2026 comparison
| Sovereign | Rating agency | Latest verified decision | Rating | Outlook / trend | Reference date |
|---|---|---|---|---|---|
| Italy | Morningstar DBRS | Affirmation | A (low) | Stable | 16 Oct 2026 |
| Italy | Moody’s | Upgrade | Baa2 | Stable | 21 Nov 2025 |
| Italy | S&P Global Ratings | Affirmation, outlook revision | BBB+ | Positive | 30 Jan 2026 |
| Greece | S&P Global Ratings | Rating review | BBB | Stable | 23 Oct 2026 |
| Greece | Moody’s | Rating review | Baa3 | Positive | 18 Sep 2026 |
| Greece | Fitch | Rating review | BBB | Stable | 8 May 2026 |
| Greece | Morningstar DBRS | Rating review | BBB | Positive | 4 Sep 2026 |
| Greece | Scope Ratings | Rating review | BBB+ | Stable | 18 Sep 2026 |
Sources: Morningstar DBRS, Italy Rating Action, 16 October 2026; Moody’s, Italy Rating Action, 21 November 2025; S&P Global Ratings, Italian Sovereign Outlook Reference, 13 February 2026; Greek PDMA, Sovereign Credit Ratings, updated 26 October 2026. The Greek PDMA’s listed Fitch review for 6 November 2026 was a scheduled event, not independently verified here as a completed new rating decision.
The last qualification is material. A scheduled credit-rating review cannot be reported as a completed upgrade, downgrade or affirmation merely because the scheduled date has passed. Likewise, an outlook change does not constitute a rating-notch change. The distinction is important for institutional investors whose investment eligibility depends on the actual rating assigned by an authorised agency, rather than on market expectations concerning a future decision. Rating-agency assessments should also not be treated as independent statistical measurements of default probability. Their methodologies incorporate models, qualitative judgments and forward-looking assumptions that may differ substantially, and their ratings are ordinal credit opinions rather than precise probabilities that can be summed or averaged across agencies.
The bank–sovereign nexus is a sequence of balance-sheet transmission mechanisms
The interaction between government finances and the banking system is often described as a sovereign–bank feedback loop, but the expression conceals several distinct mechanisms. The first is the direct valuation channel. A bank holding fixed-rate government securities experiences a decline in the market value of those holdings when yields rise, although the effect on reported capital depends on whether securities are accounted for at fair value through profit and loss, fair value through other comprehensive income, or amortised cost. The second is the funding channel: concerns about sovereign credit quality can increase bank funding spreads because investors may reassess the ability of the state to support the banking system under stress, while domestic banks can become more exposed to changes in the value and liquidity of government bonds used as collateral. The third is the macroeconomic channel, through which higher sovereign yields, tighter financial conditions and reduced public investment can weaken firms and households, raising credit losses and reducing the profitability of intermediaries.
A fourth channel involves collateral and liquidity management. Euro-area sovereign securities are widely used as high-quality liquid assets, but their regulatory liquidity treatment does not eliminate market-price fluctuations or the effect of central-bank collateral haircuts. The ECB’s May 2026 Financial Stability Review observed that banks had partly replaced declining excess central-bank reserves with holdings of sovereign bonds as central-bank liquidity continued to contract. It also reported that aggregate Eurosystem liquidity had declined by more than €2 trillion, or approximately 45%, from its 2022 peak. This adjustment changes the composition of bank liquidity buffers. Government bonds may generate higher yields than central-bank reserves, but they introduce duration and valuation risks that are not identical to those associated with reserves. The ECB further observed that home bias in sovereign-bond portfolios had declined in most euro-area banking systems, providing a potential mitigating factor against concentrated domestic exposures. Financial Stability Review, May 2026 — European Central Bank, section 3.4.
The Italian banking system is substantially different from the one that entered the earlier European sovereign-debt crisis. Morningstar DBRS’s October 2026 assessment identifies stronger capitalisation, improved asset quality, sustained profitability and lower levels of non-performing loans as important improvements. It reports an aggregate non-performing-loan ratio of 1.9% in the second quarter of 2026, based on European Banking Authority data. The same assessment highlights Italy’s positive net international investment position, which reached 14.5% of GDP in the fourth quarter of 2025, and the relatively low indebtedness of the private sector as additional macrofinancial strengths. These characteristics moderate the risk that sovereign-market tensions would automatically trigger a banking crisis. They do not eliminate the possibility of transmission through securities portfolios, market funding, collateral or a deterioration in corporate credit quality. Morningstar DBRS, Italy Sovereign Credit Rating Rationale, 16 October 2026.
Table 5.2 — Financial-stability transmission channels and the variables required for assessment
| Transmission mechanism | Initial shock | First-order financial effect | Potential second-order effect | Required evidence |
|---|---|---|---|---|
| Sovereign valuation | Increase in market yields | Losses on marked-to-market sovereign securities | Lower capital or reduced risk appetite | Portfolio duration and accounting classification |
| Bank funding | Sovereign credit repricing | Higher wholesale bank funding costs | More expensive private credit | Senior bank spreads and issuance conditions |
| Collateral | Sovereign price decline | Reduced collateral value or higher margin requirements | Liquidity pressure and asset sales | Eligible collateral stock and haircuts |
| Credit quality | Higher rates and slower growth | Household and corporate debt-service pressure | Increased defaults and provisioning | Credit-risk and non-performing-loan data |
| Treasury refinancing | Sustained rise in marginal yields | Gradual increase in public interest expenditure | Larger fiscal adjustment requirement | Issuance calendar and effective interest costs |
| Investor concentration | Portfolio reallocations | Reduced market depth and greater volatility | Higher liquidity and term premia | Holder composition and trading liquidity |
| Monetary transmission | Unwarranted disorderly sovereign-market conditions | Fragmentation of financing conditions | Uneven implementation of common monetary policy | Market functioning and ECB eligibility criteria |
Analytical framework based on ECB, Financial Stability Review, May 2026, Banca d’Italia, Financial Stability Report No. 1/2026 and Morningstar DBRS, Italian Sovereign Rating Assessment, October 2026. These are causal transmission channels, not measured losses or assigned risk probabilities.
Central-bank collateral and monetary transmission establish a conditional institutional safeguard
The ECB’s Transmission Protection Instrument, announced in July 2022, was designed to address unwarranted and disorderly market dynamics that pose a serious threat to the transmission of monetary policy across euro-area jurisdictions. Its institutional logic is distinct from a sovereign rescue programme or a guarantee of any particular national bond yield. The Governing Council may undertake secondary-market purchases when it judges that financing conditions are deteriorating for reasons not warranted by country-specific fundamentals, subject to the applicable eligibility assessment. The instrument focuses on public-sector securities with residual maturities between one and ten years, and the ECB has stated that the potential scale of purchases is not restricted in advance. However, eligibility incorporates fiscal and macroeconomic-policy criteria, debt sustainability, the status of excessive-deficit and macroeconomic-imbalance procedures, and compliance with relevant European commitments. The Transmission Protection Instrument — European Central Bank, 21 July 2022.
The distinction between market fragmentation and justified credit repricing is therefore decisive. An increase in Italian sovereign spreads caused by broad market dysfunction could potentially engage the ECB’s monetary-transmission mandate if the institutional conditions were satisfied. A deterioration driven by credible concerns over Italian debt sustainability would raise a different question, because the instrument is not intended to eliminate sovereign fiscal fundamentals from market pricing. The ECB’s assessment also involves institutional discretion: meeting individual criteria does not confer an automatic entitlement to purchases, while the existence of an excessive-deficit procedure must be interpreted alongside the criterion concerning whether the member state has failed to take effective action. Italy’s procedure being held in abeyance after the Commission’s positive effective-action assessment is therefore relevant, but it does not amount to pre-certification for intervention.
The Eurosystem’s collateral framework constitutes a separate transmission channel. Securities accepted as collateral support bank access to monetary-policy operations, subject to eligibility, valuation and haircut requirements. A sovereign rating change can affect collateral treatment in particular circumstances, but the magnitude depends on the relevant credit-quality thresholds and collateral classifications. A rating upgrade should therefore not be presented as automatically generating a proportional expansion in bank liquidity. The interaction between sovereign ratings, collateral values and monetary operations requires attention to both the formal framework and the composition of assets actually pledged by institutions.
Rating upgrades can improve financing capacity without resolving the sovereign debt problem
A sovereign-rating improvement may expand the potential investor base, reduce restrictions imposed by investment mandates and improve the treatment of eligible assets under particular financial rules. Nevertheless, the economic benefit depends on whether the new rating changes a binding constraint. An upgrade within investment grade may have limited immediate effects for an investor already permitted to hold the securities, whereas crossing an investment-grade threshold can change eligibility for certain portfolios. Similar distinctions apply to bank collateral and regulatory treatment. Greece’s return to investment grade is consequently significant for the normalisation of market access, but it does not erase the fact that its official creditors continue to determine much of its long-term financing structure.
Italy’s rating improvement and stable institutional assessment likewise cannot be interpreted as evidence that its debt dynamics have been fully stabilised. Morningstar DBRS’s October analysis states that higher real interest rates and a rising interest burden increase the primary surpluses required for durable debt reduction, while the projected fiscal improvement remains dependent on financing effects from housing tax credits diminishing after 2027. The agency’s positive consideration of banking-sector resilience and external balance-sheet improvements therefore coexists with material fiscal vulnerabilities. This combination is analytically important: the same sovereign may possess substantial institutional and economic strengths while remaining highly exposed to adverse debt-service arithmetic.
The most important market risk is persistent repricing, not an isolated increase in yields
A temporary increase in Italian bond yields may generate valuation losses in some portfolios without fundamentally changing the government’s long-term fiscal trajectory, particularly if yields subsequently normalise and the Treasury’s refinancing calendar remains manageable. A persistent increase in the underlying risk-free rate or in the sovereign-specific spread has more significant implications because it progressively affects new issuance, maturing securities and the effective cost of the outstanding portfolio. At the same time, a persistent yield increase may influence business investment, household borrowing costs and fiscal expenditure, potentially reducing the nominal GDP growth that would otherwise help stabilise the debt ratio.
The financial-stability problem becomes more complex when sovereign yields and economic growth move adversely together. If borrowing costs increase because inflation expectations rise, nominal GDP may also increase, partly offsetting the deterioration in the debt ratio. If borrowing costs rise because investors demand a higher risk premium while real growth weakens, the government may face an unfavourable combination of increasing interest expenditure and a smaller economic denominator. These shocks are not equivalent and should not be assigned the same fiscal consequence. Accordingly, a rigorous risk assessment needs to distinguish nominal-rate shocks, real-rate shocks, sovereign-specific credit-spread changes and macroeconomic contractions, rather than apply a uniform yield increase to the entire outstanding debt stock.
Key judgments — Chapter 5. Italian sovereign risk is transmitted through a larger and more interconnected financial system than the Greek public-debt structure, while Greece’s long official-sector financing arrangements reduce the immediate impact of marginal bond-market yields on aggregate debt-service costs. Italy’s banking system has materially improved its resilience, but sovereign exposures remain important through securities valuations, collateral, liquidity management and credit conditions. Rating-agency decisions provide relevant institutional assessments but are not substitutes for debt-sustainability calculations. The ECB’s transmission instruments provide conditional safeguards against unwarranted fragmentation, not an unconditional guarantee of Italian market financing.
Chapter 6 — The Geopolitics of Sovereign Debt: Italy, Greece and the Distribution of Economic Power Within Europe
Sovereign debt is becoming an increasingly important constraint on Europe’s strategic capacity
The geopolitical significance of European sovereign debt extends beyond the availability of financing for national budgets. It affects the capacity of governments to sustain defence procurement, absorb energy-price shocks, invest in strategic infrastructure, maintain social and political stability and participate credibly in collective European economic initiatives. The Italian–Greek comparison is particularly relevant because the two countries share the euro, participate in the same European fiscal-surveillance framework and face overlapping Mediterranean security challenges, yet possess substantially different economic scales and financing architectures. Italy’s debt stock is large enough that a significant deterioration in its market financing could affect broader euro-area financial conditions, while Greece’s debt sustainability continues to benefit from long-duration official financing inherited from the crisis-management programmes of the previous decade. The resulting asymmetry creates an important institutional question: how can common European rules preserve fiscal discipline while accommodating different historical creditor arrangements, divergent economic-growth conditions and new strategic expenditure requirements?
The question is not whether Italy and Greece should be assessed against identical debt ratios as a condition of political equality. The European treaties establish common fiscal reference values and a coordinated framework of surveillance, but their implementation necessarily considers national economic conditions, fiscal plans and debt-sustainability assessments. Nor does the decline in Greek debt imply that Greece has acquired the same fiscal resources, industrial capacity or institutional influence as Italy. Italy remains a much larger national economy and government-debt issuer, with a correspondingly greater role in European financial markets and productive systems. A debt-ratio ranking measures liabilities relative to annual output; it does not directly measure industrial strength, strategic influence, financing quality or the capacity to mobilise resources during a crisis. The geopolitical assessment must therefore examine how financing constraints interact with the distribution of economic power, rather than assume that a reversal in the statistical ranking produces an equivalent reversal in institutional influence.
The Greek rescue architecture created a lasting distinction between official solidarity and market financing
The European Stability Mechanism’s documentation provides the clearest institutional explanation of the difference between the Greek and Italian financing environments. During the successive Greek assistance programmes, the country received a cumulative €288.7 billion in official rescue loans, including €256.6 billion from euro-area governments and European financial-stability institutions and €32.1 billion from the International Monetary Fund. The European Financial Stability Facility disbursed €141.8 billion, while the European Stability Mechanism subsequently provided €61.9 billion. These figures represent cumulative historical disbursements, not the outstanding loan balance in November 2026. Their significance lies in the contractual financial architecture created during the programmes, especially the long repayment horizons and the modification of financing terms. Greece — Financial Assistance and Programme Overview — European Stability Mechanism; Financial Assistance — European Stability Mechanism.
The European Stability Mechanism reports an average maturity of approximately 42.45 years for the EFSF financing associated with Greece and 32.35 years for the ESM programme loans, with scheduled repayment periods extending to 2070 and 2060 respectively. These terms are exceptional compared with ordinary sovereign securities issuance. They represent the long-term institutional consequences of a crisis response designed to preserve financial stability while establishing conditional adjustment programmes. They also produce a persistent distinction between the Maastricht face value of Greek debt and the expected timing of its servicing obligations. Italy, by contrast, did not receive an equivalent sovereign assistance programme and continues to finance its public debt predominantly through market issuance. That historical difference is critical when comparing the present economic burden of two debt stocks with similar ratios to GDP. European Stability Mechanism, Financial Assistance — Programme Terms and Repayment Schedules.
Table 6.1 — Historical Greek financial assistance: cumulative programme disbursements
| Facility or creditor | Programme period | Historical amount disbursed | Principal financing characteristic |
|---|---|---|---|
| Greek Loan Facility | 2010–2011 | €52.9bn | Bilateral euro-area government lending |
| IMF, first programme | 2010–2011 | €20.1bn | Multilateral financial assistance |
| EFSF | 2012–2015 | €141.8bn | Long-duration European institutional financing |
| IMF, second programme | 2012–2015 | €12.0bn | Multilateral programme support |
| ESM | 2015–2018 | €61.9bn | Long-duration euro-area stability-mechanism financing |
| Total | 2010–2018 | €288.7bn | Historical cumulative financing, not current outstanding debt |
Source: European Stability Mechanism, Greece Financial Assistance Programme Overview. Programme disbursements are historical flows; outstanding liabilities are lower where repayments or other debt-management operations have occurred.
This architecture created a distribution of financial commitments that continues to matter for euro-area governance. European creditor institutions, and ultimately the member states participating in those arrangements, have long-term contractual interests in the stability of Greek public finances. Greece’s debt management therefore has a significant institutional dimension beyond ordinary bond-market transactions. Italy’s financing system, while operating within the same monetary union, is more directly exposed to the capacity of domestic and international investors to absorb public securities at sustainable yields. The distinction does not necessarily produce different treatment under every European policy mechanism, but it establishes different forms of creditor exposure and different channels through which financial difficulties would be transmitted.
The Eurogroup and the European Council operate through different institutional mechanisms
The Eurogroup is the principal informal forum for coordination among the finance ministers of euro-area member states. Its responsibilities include discussion of fiscal and macroeconomic developments, financial stability and matters affecting the common currency. It also plays a preparatory role in relation to Euro Summit discussions. Formal legal decisions concerning fiscal surveillance and the application of European economic-governance rules are made through the competent institutions and procedures, including the Council of the European Union in its relevant configuration. Consequently, Eurogroup discussions may influence policy coordination and the political environment surrounding fiscal decisions, but they should not be presented as equivalent to the formal adoption of a Council recommendation or the activation of a monetary-policy instrument. How the Eurogroup Works — Council of the European Union.
This institutional distinction is particularly important when fiscal flexibility intersects with defence and energy-security expenditure. National governments identify expenditure requirements and prepare fiscal plans, the European Commission evaluates those plans against the governing rules, and the Council acts within the relevant legal procedures. The ECB independently assesses monetary policy and financial-stability conditions under its mandate. These institutions may respond to the same geopolitical shock, but they possess different authorities, objectives and constraints. A government cannot assume that the recognition of an exceptional security requirement by one institution automatically establishes monetary support, fiscal approval or common European financing by another.
The Eurogroup’s programme through June 2027 identifies competitiveness, economic sovereignty, energy, artificial intelligence, capital mobilisation through financial integration and the international role of the euro as major areas of work. This establishes a broader strategic context for sovereign financing: economic resilience and fiscal credibility are connected to the capacity of European economies to sustain investment and financial integration. However, the existence of these policy priorities is not proof of a commitment to mutualise national public debts or provide unconditional support to individual sovereign issuers. Eurogroup Work Programme — Council of the European Union, 2026–2027.
Economic scale gives Italy a substantially greater systemic financial footprint than Greece
The relative weight of Italy and Greece within European monetary and financial institutions can be illustrated through the Eurosystem capital key. On 1 January 2026, Italy accounted for 15.8307% of the Eurosystem capital key, compared with 2.2326% for Greece. Germany accounted for 26.3152% and France for 19.7682%. These weights reflect the capital-allocation methodology, based on economic and demographic parameters, and should not be interpreted as equivalent voting shares in the ECB’s Governing Council. Nevertheless, they provide an institutional indicator of the relative economic scale of euro-area members and of the distribution used to guide purchases under certain asset-purchase programmes. Capital Subscription and Eurosystem Capital Key — European Central Bank, updated 1 January 2026.
Table 6.2 — Eurosystem institutional scale, 1 January 2026
| Jurisdiction | Eurosystem capital key | Institutional interpretation |
|---|---|---|
| Germany | 26.3152% | Largest national share among the countries compared |
| France | 19.7682% | Major euro-area economic and financial participant |
| Italy | 15.8307% | Large systemic economy and sovereign-debt issuer |
| Greece | 2.2326% | Smaller economy with distinctive official-debt architecture |
Source: European Central Bank, Capital Subscription and Eurosystem Capital Key, 1 January 2026. The capital key is not a sovereign-risk score or a direct measure of political influence.
Italy’s share is approximately 7.1 times Greece’s under this particular institutional measure. The implication is not that the ECB should treat Italian sovereign debt differently because of the country’s size, or that a larger capital share automatically confers greater decision-making authority. It is that the scale of Italy’s economy and financial system gives developments in its sovereign financing greater potential to influence euro-area financial conditions. The value of Italian securities outstanding, their use in institutional portfolios and their relationship to domestic financial intermediation create transmission channels whose absolute economic scale is substantially larger than the comparable Greek market. This is one reason why a change in the relative debt-to-GDP ranking would have less immediate systemic relevance than a material deterioration in Italian market access or banking-system liquidity.
France and Germany face different consequences from the same sovereign-debt environment
France and Germany must be considered separately because their fiscal starting positions, industrial structures and roles in European financial markets differ materially. France’s Maastricht debt ratio reached 119.1% of GDP by the second quarter of 2026, substantially above the euro-area average of 88.8%, while Germany’s stood at 63.4%. A deterioration in sovereign financing conditions across the euro area would therefore interact with different levels of inherited debt and different fiscal capacities. France’s relatively high debt burden makes rising interest costs and fiscal consolidation important domestic policy considerations, whereas Germany’s lower starting ratio creates a different degree of capacity to absorb additional borrowing, subject to its national budgetary institutions and economic outlook. Both countries would nevertheless be exposed to broader financial-market transmission if a major euro-area sovereign experienced sustained funding pressure. Government Debt at 88.8% of GDP in the Euro Area — Eurostat, 21 October 2026.
For Germany, the strategic concern would extend beyond its own public finances to the functioning of the single market, financing conditions for industrial supply chains and the credibility of the common monetary framework. A sustained increase in Italian sovereign risk could affect European investors and institutions even if German government securities benefited from safe-haven demand. Such a movement might widen bilateral spreads while simultaneously lowering German yields relative to other euro-area countries, reinforcing the need to distinguish changes in the Italian risk premium from movements in the common interest-rate environment. The implications for German industrial production would depend on trade, investment, credit and confidence transmission, rather than on a direct mechanical relationship between Italian public debt and German output.
For France, the interaction would be different because the country already has a comparatively high public-debt ratio and faces its own fiscal adjustment requirements. A generalised deterioration in market confidence concerning high-debt sovereigns could therefore influence French funding conditions alongside Italian conditions, even if the underlying fiscal problems differed. The possibility of correlated sovereign repricing creates a broader question for European financial stability: whether investors distinguish national fiscal fundamentals adequately or whether a period of heightened uncertainty generates simultaneous increases in risk premia across several member states. The ECB’s May 2026 Financial Stability Review explicitly highlights the combination of increasing public financing requirements, higher term premia and geopolitical shocks as relevant sources of vulnerability in euro-area sovereign markets. Financial Stability Review, May 2026 — European Central Bank.
The United Kingdom transmits sovereign and geopolitical shocks without participating in euro-area fiscal institutions
The United Kingdom occupies a distinct position because it is not part of the euro area and does not participate in the Eurosystem’s monetary-policy or sovereign-financing arrangements. Its government debt is financed primarily through sterling-denominated obligations and governed by a separate monetary and fiscal framework. The country nevertheless remains relevant to European sovereign-risk assessment through its financial markets, institutional investors, banks, insurers and economic relationships with the European Union. The geographic location of a financial institution and the currency denomination of an asset are different dimensions of risk; institutions based outside the euro area may hold euro-denominated sovereign securities, while euro-area financial institutions may have exposure to sterling assets and United Kingdom counterparties.
The ECB’s May 2026 review observed that political uncertainty and concerns about fiscal sustainability had contributed to changes in United Kingdom sovereign yields, illustrating the sensitivity of advanced-economy government-bond markets to fiscal-policy expectations even outside the euro area. The United Kingdom case is therefore useful as a comparative transmission channel rather than as a direct participant in the Italian–Greek fiscal-governance framework. It also demonstrates why sovereign-market volatility cannot be attributed exclusively to European Union fiscal rules: global risk premia, monetary-policy expectations and domestic political conditions can influence sovereign financing across multiple currency areas. European Central Bank, Financial Stability Review, May 2026, section 2.2.
European defence financing is creating a new relationship between common borrowing and national fiscal capacity
The expansion of European defence financing constitutes one of the most consequential changes in the geopolitical context of sovereign debt. The Security Action for Europe instrument, known as SAFE, establishes a €150 billion European Union lending facility intended to support strategic defence investment, industrial cooperation and joint procurement. The mechanism relies on financing raised at European Union level and provides long-maturity loans to participating member states. This can alter the maturity and financing terms available for eligible investments, but the loans remain repayable obligations of the beneficiary governments. SAFE should therefore not be confused with a grant programme, unconditional debt cancellation or a permanent substitution of European borrowing for national fiscal responsibilities. SAFE — Security Action for Europe — European Commission.
Greece provides a concrete example of the instrument’s operation. The European Commission announced that Greece received an initial SAFE payment of €118.2 million on 23 July 2026, corresponding to 15% of a total allocation of €787.7 million. This was an actual disbursement, not merely an announced allocation. The loans are intended to support eligible defence investments and are financed through European Union market borrowing, with repayment obligations remaining with the recipient state. The amounts should not be interpreted as funds available for general fiscal expenditure or as an unconditional expansion of Greece’s sovereign fiscal capacity. Greece Receives First €118.2 Million Payment Under SAFE Defence Instrument — European Commission, 24 July 2026.
The strategic significance of such instruments lies in the possibility of coordinating financing and industrial demand across national borders. Joint procurement can improve scale, standardisation and supplier visibility, while common European issuance may provide financing conditions different from those available to individual sovereigns. However, the economic benefit depends on the specific loan terms, national accounting treatment, procurement arrangements and implementation schedules. An increase in defence borrowing can create productive industrial capacity where investment improves manufacturing capability and technology development, but it can also raise future interest and repayment obligations. The fiscal consequences therefore need to be measured independently of the strategic justification for expenditure.
The end of the Recovery and Resilience Facility implementation period changes Europe’s investment-financing environment
The Recovery and Resilience Facility provides another example of the relationship between supranational financing and national economic capacity. Unlike a permanent fiscal transfer system, the facility was established as a temporary instrument with legally defined implementation and payment deadlines. The European Commission’s October 2026 annual report states that the deadline for completing milestones and targets expired on 31 August 2026, while member states submitted final payment requests by the end of September. As of the end of September, the Commission had disbursed approximately €450 billion, corresponding to 79% of the facility’s envelope, and was assessing 32 remaining payment requests amounting to €123 billion. The final payment deadline is 31 December 2026, subject to the applicable assessment and approval requirements. Recovery and Resilience Facility Annual Report 2026 — European Commission, 7 October 2026.
These figures establish that the European Union is entering the closing phase of an exceptional investment-financing cycle. The policy relevance extends beyond the accounting treatment of outstanding payments. Governments that have relied on the facility to support investment must now determine how to maintain productive capital formation without assuming that the same financing mechanism will continue indefinitely. The economic consequences will depend on whether completed investments produce the expected productivity gains, whether additional national or European instruments are available and whether private investment responds to improvements in infrastructure and administrative capacity. The end of the RRF implementation period does not imply that all financed projects cease generating benefits; it changes the source and timing of financing for future activity.
For Italy, the transition is particularly important because the economy’s growth outlook and fiscal capacity have been supported by public investment associated with the national recovery plan. The challenge is to preserve productive investment while reducing the legacy financing burden of earlier tax incentives and maintaining compliance with the European expenditure framework. For Greece, the transition occurs alongside stronger recent growth and a comparatively favourable official-creditor structure, but the economy continues to require investment and productivity improvements. Both countries therefore face a common European investment-financing transition under different national fiscal constraints.
Energy security, strategic infrastructure and sovereign borrowing are increasingly interconnected
Energy shocks influence public finances through multiple channels that should not be conflated. Higher imported energy prices can increase government expenditure when authorities introduce compensation measures for households or firms, reduce tax revenue when economic activity slows, increase production costs and alter the balance of trade. They can also affect nominal GDP through changes in domestic prices, although the relationship depends on the composition of imports and domestic value added. Strategic investments in energy infrastructure may reduce future exposure to supply disruptions, but they often require substantial capital expenditure before their benefits become available. Governments must therefore balance near-term compensation, long-term infrastructure investment and the financing consequences of both.
Italy’s dependence on energy imports is particularly relevant to its sovereign-risk outlook. Morningstar DBRS’s October 2026 assessment identifies higher international energy prices as a factor weighing on household income, industrial activity and the external balance, while recognising the country’s diversified gas import structure and domestic storage capacity as mitigating elements. The agency reported that before the escalation of the Middle East conflict, Italy obtained approximately 10% of its natural gas imports from Qatar and around 15% of its oil from the Persian Gulf. Those figures illustrate the relationship between international energy transport and the domestic economic environment, but do not by themselves establish the probability or magnitude of a future supply disruption. Morningstar DBRS, Italy Sovereign Credit Rating Rationale, 16 October 2026.
From a geopolitical perspective, the relevant policy question is whether investment in energy resilience can reduce expected future fiscal losses sufficiently to justify its initial financing costs. The answer depends on infrastructure utilisation, alternative supply capacity, investment timing, the degree of import substitution and the possibility of private-sector participation. A public investment that increases security of supply may create strategic benefits not fully captured by immediate fiscal revenue, but the corresponding borrowing and expenditure remain economically relevant. Evaluating these projects therefore requires separate treatment of financial returns, avoided disruption costs and national-security benefits, without converting uncertain strategic value into an invented numerical fiscal multiplier.
Mediterranean strategic responsibilities intersect with sharply different fiscal capacities
Italy and Greece occupy important positions in the Mediterranean security environment, but their economic structures and national responsibilities are not interchangeable. Italy’s industrial capacity, ports, energy infrastructure and economic links to wider European production systems create a broad relationship between its fiscal resources and its ability to support strategic programmes. Greece’s position is associated with its own maritime, security and regional infrastructure requirements, while its official-sector debt structure provides a longer financing horizon for much of its inherited public debt. These differences matter because defence and energy-security investment can generate national and European benefits but must ultimately be financed through identifiable budgetary or institutional mechanisms.
A deterioration in Italian sovereign borrowing conditions could constrain the fiscal flexibility available for additional industrial and security investment, but the effect would depend on the government expenditure mix and the availability of European financial instruments. Greece could face a different constraint: lower immediate servicing pressure on existing debt does not imply unlimited capacity to finance new capital expenditure, especially where investment is funded through repayable loans. Joint European financing can moderate some national funding constraints, but it cannot eliminate resource scarcity, procurement bottlenecks or the requirement to allocate spending among competing priorities.
The geopolitical issue is the credibility of differentiated fiscal solidarity
The European sovereign-debt framework contains a persistent tension between the responsibility of national governments for their fiscal choices and the common interest in preserving the stability of the euro area. The Greek assistance programmes illustrate the willingness of European institutions and member states to establish exceptional financing arrangements during a systemic crisis, subject to extensive conditions and long-term contractual commitments. Italy’s present financing arrangements illustrate the continued importance of private sovereign-debt markets for a large euro-area economy. The comparison does not establish a current legal entitlement to equivalent treatment, nor does it demonstrate that institutional support for a large sovereign would necessarily reproduce the Greek crisis architecture.
The practical distinction is between instruments designed for fiscal adjustment and financial assistance, instruments designed to protect monetary-policy transmission, and instruments intended to finance strategic investment. The European Stability Mechanism, the ECB’s Transmission Protection Instrument, the national escape clause and SAFE operate under different legal authorities and economic conditions. Their functions may complement one another under particular circumstances, but they cannot be treated as interchangeable guarantees against sovereign-financing difficulties. The relevant institutional records are European Stability Mechanism, Financial Assistance, European Central Bank, Transmission Protection Instrument, July 2022, Council of the European Union, National Escape Clause for Defence Expenditure and European Commission, Security Action for Europe.
Table 6.3 — European institutional instruments and the boundaries of sovereign support
| Instrument | Competent institution | Primary purpose | Financing or fiscal effect | Principal limitation |
|---|---|---|---|---|
| European Stability Mechanism | ESM institutions under the applicable treaty framework | Financial assistance to euro-area members under the relevant conditions | Official financial assistance, potentially with long maturities | Programme conditions, eligibility and institutional approvals |
| Transmission Protection Instrument | ECB Governing Council | Protect monetary-policy transmission against unwarranted disorderly market dynamics | Conditional secondary-market securities purchases | Not unconditional sovereign yield or solvency support |
| National escape clause | Council, following the applicable recommendation procedure | Temporary fiscal flexibility under exceptional circumstances | Permits specified deviations from fiscal paths | Does not cancel expenditure or borrowing |
| SAFE | European Union institutions under the SAFE legal framework | Strategic defence financing and joint procurement | EU-financed long-maturity loans to eligible member states | Repayable financing, with procurement and eligibility requirements |
| Recovery and Resilience Facility | European Commission and competent EU institutions | Performance-based reforms and investment | Grants and loans linked to milestones and targets | Temporary instrument with 2026 implementation and payment deadlines |
| National sovereign-debt issuance | National Treasury or debt-management authority | Finance public borrowing requirements | Marketable securities and contractual repayment obligations | Exposed to market conditions, maturity schedules and debt sustainability |
Sources: ESM, Financial Assistance; ECB, Transmission Protection Instrument; Council, National Escape Clause; European Commission, SAFE; European Commission, RRF Annual Report 2026.
Europe’s strategic autonomy depends on maintaining the distinction between financial capacity and fiscal discretion
A government may possess the legal discretion to undertake expenditure without possessing an equally favourable financing environment. Conversely, access to long-term official loans may reduce short-term refinancing pressure without creating additional real economic resources. This distinction is particularly important when European governments consider investments in defence, energy networks, industrial capabilities and infrastructure resilience. Fiscal exemptions can prevent strategically necessary expenditure from being treated as an ordinary breach of expenditure limits, while common financing instruments may provide alternative maturity and cost structures. Neither mechanism guarantees that the resulting investment will be productive, affordable or delivered on schedule.
The Italian–Greek comparison consequently illustrates a wider challenge for the European Union: the ability to coordinate strategic expenditure among countries whose inherited debt burdens, growth prospects, creditor structures and domestic political constraints are different. A common strategic objective does not automatically generate equal national capacity to finance it. The Union’s policy instruments can mitigate some of these differences, but their effectiveness depends on implementation and the economic quality of the investment. Fiscal credibility, institutional solidarity and strategic capacity are therefore complementary objectives that may also generate difficult trade-offs.
Key judgments — Chapter 6. The narrowing of the Italian–Greek public-debt gap has political and institutional significance, but the more consequential distinction lies in each country’s relationship with sovereign markets and European financing institutions. Greece’s debt structure reflects exceptional official assistance and very long contractual maturities, whereas Italy remains a major market-financed sovereign whose borrowing conditions affect a much larger financial and industrial system. The growing requirements for defence, energy security and strategic investment create new demands on national fiscal capacity, while European instruments such as SAFE and the national escape clause provide targeted flexibility rather than unconditional financing guarantees. The principal systemic concern is whether Europe can sustain common strategic investment and monetary stability while accommodating increasingly differentiated national fiscal conditions.
WordPress Scheme 4A — Italy’s Fiscal Commitments, Tax-Credit Financing and Debt Path, 2025–2029
This self-contained component is intended for insertion after Table 4.3 in Chapter 4. It combines the government’s October 2026 fiscal projections with the authorised European expenditure ceilings and the separately identified projected borrowing effects of housing tax credits. The interactive controls distinguish government forecasts from Council-endorsed fiscal parameters, preventing a forecast deficit from being mistaken for an expenditure ceiling or a formally approved exception.
The component provides English, Italian, Spanish, French and German interfaces. Its CSS is encapsulated in a Shadow DOM and does not set or modify any WordPress theme parameter.
WordPress Scheme 5A — Sovereign Risk and Banking-System Transmission Architecture
This second component is intended for placement after Table 5.2. It represents a qualitative causal structure rather than an invented quantitative risk index. The user can select a sovereign-market shock and inspect the relevant consequences for the Treasury, banking system, private credit and European monetary-policy transmission. The five-language selector translates the explanatory text and table headings.
The scheme deliberately distinguishes possible transmission channels from established observations. An illustrated connection indicates an economically identifiable mechanism, not evidence that the corresponding loss or disruption has already occurred.
These two targeted components complement the report’s conventional evidence tables. Their historical observations, projected values, fiscal ceilings and causal mechanisms remain explicitly differentiated. Both use isolated Shadow DOM styling, so their CSS cannot overwrite the surrounding WordPress theme’s global typography, headings, navigation or colours; execution still depends on the site’s permission to run inline scripts.
Pillar II — Consolidated Assessment and Decision-Relevant Uncertainties
The combined fiscal, financial and geopolitical evidence establishes that Italy’s sovereign-debt risk cannot be measured adequately through its approaching statistical convergence with Greece. Italy’s central challenge is the persistence of a large market-financed debt stock under a fiscal programme that anticipates rising interest expenditure, temporary additional security-related spending and a sharp decline in the residual financing burden of earlier housing-renovation tax credits. The October 2026 government programme projects debt stabilisation after 2027, but its success depends on continued primary surpluses, nominal economic growth and the actual timing of stock-flow adjustments. The European framework provides legal constraints and, under exceptional circumstances, conditional fiscal flexibility. It does not eliminate the cash-financing consequences of expenditure already incurred or subsequently authorised.
The market assessment is more differentiated than the historical debt ratio might suggest. Italy’s banks have stronger capital and asset-quality characteristics than during the previous sovereign crisis, while the economy benefits from a substantial industrial base, external assets and the institutional framework of monetary union. Nevertheless, the importance of Italian government securities in institutional portfolios and collateral systems creates meaningful channels of financial transmission if sovereign borrowing costs rise persistently. Greece has achieved significant fiscal and rating improvements, but its relatively favourable debt-service profile is inseparable from the exceptional official financing provided during the crisis programmes. Its current market borrowing costs should therefore not be interpreted as the financing cost of its complete public-debt stock.
The geopolitical dimension strengthens the case for distinguishing sovereign solvency, liquidity, fiscal discretion and strategic investment capacity. European governments are being asked to finance defence readiness, energy resilience, industrial investment and infrastructure modernisation while maintaining compliance with fiscal rules and preserving market confidence. Instruments such as SAFE, the Recovery and Resilience Facility and exceptional expenditure flexibility can modify the financing conditions and implementation constraints associated with these priorities, but they have different legal purposes and do not create unconditional fiscal resources. France, Germany and the United Kingdom are exposed to the same broader market and geopolitical environment through different institutional and fiscal channels.
Confidence assessment: High for the identified European fiscal rules, Italy’s approved net-expenditure trajectory, the published rating decisions, the contractual distinctions between Greek official lending and Italian market financing, and the ECB’s monetary-transmission framework. Moderate for the Italian government’s projected return to a declining debt ratio after 2027, because that outcome depends on economic growth, future primary balances, financing conditions and the actual reduction of legacy tax-credit borrowing. Conditional for the magnitude of any future bank–sovereign feedback loop or broader European financial instability, because those outcomes require a specific market shock and observable deterioration in institutional balance sheets or funding conditions.
What would change the assessment: A material departure from Italy’s projected primary-balance path, a slower-than-expected reduction in housing-related tax-credit financing needs, sustained changes in the term structure of Italian borrowing costs, new rating actions, evidence of increasing sovereign concentration in banking portfolios, or changes in the applicable Council decisions concerning fiscal flexibility. At the European level, changes to official financing terms, the implementation of defence-financing instruments or the legal conditions governing monetary-transmission support would also materially affect the assessment.
PILLAR III — FORWARD SOVEREIGN-RISK ASSESSMENT AND POLICY RESPONSE
Chapter 7 — Debt Sustainability to 2030: Baseline, Adverse and Reform Scenarios
The decisive question is whether Italy can stabilise its debt under a persistently positive interest-growth differential
Italy’s prospective overtaking of Greece as the European Union’s most indebted sovereign is no longer principally a question of extrapolating two historical debt ratios. The October 2026 Italian fiscal programme and the latest available international institutional assessments establish that the more consequential issue is whether Italy can generate sufficiently large and persistent primary surpluses to compensate for the combined effects of refinancing costs, weak nominal economic growth and debt-increasing stock-flow adjustments. Greece enters the projection period with a different debt-service structure, stronger recent primary fiscal performance and an official-creditor architecture that moderates the near-term transmission of market interest rates. Those advantages do not guarantee continued Greek debt reduction, but they alter the magnitude of the fiscal adjustment necessary to stabilise the outstanding debt ratio. For Italy, the central risk is that a primary surplus which appears substantial in ordinary budgetary terms may be insufficient when the effective interest rate on a large inherited debt stock rises faster than nominal GDP, especially if previously recognised tax credits continue to create additional financing requirements.
The Italian government’s October 2026 programme anticipates that the debt ratio will reach 138.1% at the end of 2026, increase to 138.5% in 2027, and then decline to 137.9% in 2028 and 136.6% in 2029. These are official national policy projections, rather than observed future results. They incorporate real GDP growth of 1.0% in 2026, 0.8% in 2027, 0.9% in 2028 and 0.8% in 2029, together with nominal GDP growth of 2.7%, 3.2%, 3.0% and 2.6% over the same years. The parliamentary budget dossier identifies primary-surplus targets of 1.2% of GDP in 2026, 0.9% in 2027, 1.4% in 2028 and 2.4% in 2029 in its presentation of the policy scenario. Its treatment of some underlying fiscal aggregates also distinguishes the policy path from the no-policy-change baseline. This distinction matters because the government is projecting the effect of planned fiscal measures and exceptional expenditure flexibility, not merely extrapolating previously enacted legislation. Documento programmatico di finanza pubblica 2026 — Camera dei deputati, Servizio Bilancio, 6 October 2026; Presentato al Parlamento il Documento Programmatico di Finanza Pubblica 2026 — Ragioneria Generale dello Stato, 8 October 2026.
The International Monetary Fund’s July 2026 Article IV assessment provides an independent analytical reference, although it predates the government’s October programme and the subsequent statistical revisions. The Fund projected public debt of 138.2% of GDP in 2026 and 2027, declining to 137.5% in 2028, 136.7% in 2029 and 136.3% in 2030 under its then-current baseline. Its recommended adjustment path produced a lower projected debt ratio of 132.5% in 2030, reflecting stronger primary balances and a more rapid reduction in the overall fiscal deficit. These are different policy assumptions, not alternative observations of the same future outcome. The Fund’s staff also identified weak productivity, demographic ageing, energy dependence and higher financing costs as material vulnerabilities, while recognising the contribution of fiscal consolidation to improved sovereign-market confidence. Italy: 2026 Article IV Consultation — International Monetary Fund, 24 July 2026; Italy: Staff Concluding Statement of the 2026 Article IV Mission — IMF, 27 May 2026.
Establishing the forecast boundary: official observations, policy projections and analytical scenarios
A reproducible sovereign-debt assessment must establish the status of each numerical observation before combining it with other evidence. Italy’s 139.9% and Greece’s 140.8% debt ratios at the end of the second quarter of 2026 are provisional statistical observations. Italy’s projected 138.1% ratio at the end of 2026 is a government forecast incorporating the expected fiscal and nominal GDP developments over the remainder of the year. Greece’s 140.7% projected end-2026 ratio comes from the European Commission’s May 2026 forecast and therefore reflects an earlier economic and statistical information set. The near equality between the Greek second-quarter ratio and its previously projected year-end figure is incidental; it does not establish that subsequent Greek debt developments have already followed the Commission’s forecast. Government Debt at 88.8% of GDP in the Euro Area — Eurostat, 21 October 2026; Economic Forecast for Greece — European Commission, 21 May 2026.
The scenario exercise below uses the Italian government’s October 2026 projected end-year ratio and the European Commission’s May 2026 Greek projected end-year ratio as conditional starting assumptions, not as a harmonised pair of observed debt stocks. This choice allows the annual projection to begin in 2027 without incorrectly treating a second-quarter stock as a completed calendar-year result. It does, however, introduce a source-vintage mismatch. Consequently, the resulting bilateral crossover dates are conditional illustrations, not official forecasts or probability-weighted predictions. The exercise makes this limitation explicit because an apparently precise convergence date would otherwise conceal the sensitivity of the outcome to the starting ratio and the Greek fiscal projection.
Table 7.1 — Forecast evidence and its appropriate analytical use
| Institution and reference | Italy | Greece | Publication vintage | Appropriate interpretation |
|---|---|---|---|---|
| Eurostat, Q2 2026 | 139.9% | 140.8% | October 2026 | Provisional observed quarterly debt ratios |
| Italy’s October 2026 fiscal programme | 138.1% for end-2026 | Not applicable | October 2026 | National policy projection |
| European Commission, May forecast | 138.5% for end-2026 | 140.7% for end-2026 | May 2026 | Earlier forecast under Commission assumptions |
| IMF, July Article IV | 138.2% for end-2026 | Not comparable within the same report | July 2026 | IMF staff baseline for Italy |
| IMF, May Greece Article IV | Not applicable | 136.6% for end-2026 | May 2026 | Earlier IMF staff baseline for Greece |
| Analytical scenario starting point | 138.1% | 140.7% | Constructed November 2026 | Conditional modelling anchors, not a unified official forecast |
Sources: Italian Parliamentary Budget Documentation, October 2026; European Commission, Italy Economic Forecast, May 2026; European Commission, Greece Economic Forecast, May 2026; IMF, Italy Article IV, July 2026; IMF, Greece Article IV, May 2026.
The differences between these forecasts are economically material. For Greece, the IMF’s May 2026 assessment projected a debt ratio of 136.6% at the end of 2026 and 130.1% in 2027, compared with the European Commission’s 140.7% and 134.4%. The discrepancy indicates different assumptions, data vintages or modelling conventions; it should not be eliminated by averaging the two projections. For Italy, the government’s October policy assumptions differ from the earlier IMF baseline in the timing and composition of fiscal measures, exceptional expenditure and macroeconomic developments. The appropriate analytical response is to preserve the institutional forecasts and separately construct scenarios with fully disclosed parameters. IMF Executive Board Concludes 2026 Article IV Consultation with Greece — IMF, 27 May 2026; Economic Forecast for Greece — European Commission, May 2026.
The exact debt identity and the fiscal conditions for stabilisation
For scenario purposes, the annual debt ratio must be projected using the effective nominal interest rate on outstanding liabilities, nominal GDP growth, the primary fiscal surplus and the stock-flow adjustment. The appropriate discrete-time relationship is:
Debt ratio in year t = previous year’s debt ratio × (1 + effective nominal interest rate) / (1 + nominal GDP growth) − primary surplus + stock-flow adjustment.
All rates used in the multiplicative component are expressed as decimals, while primary balances and stock-flow adjustments are measured in percentage points of current-year GDP. This specification assumes the effective interest rate is applied to the opening debt stock and that transactions are allocated consistently with the annual fiscal accounts. It abstracts from the detailed intra-year timing of borrowing, interest payments and nominal GDP production. Those simplifications are appropriate for transparent scenario comparison but not sufficient for a transaction-level Treasury cash-flow forecast.
The stabilising primary surplus can be derived directly from this relationship by requiring the debt ratio to remain unchanged. Under a simplified model, the primary surplus needed to stabilise debt is the initial debt ratio multiplied by the difference between the effective nominal interest rate and nominal GDP growth, divided by one plus nominal GDP growth, plus the stock-flow adjustment. A positive interest-growth differential requires a positive primary surplus even before considering stock-flow effects. A negative differential allows a portion of the debt burden to decline through nominal GDP expansion, although positive stock-flow adjustments can still offset that advantage.
For Italy, a debt ratio of approximately 138% of GDP magnifies relatively small sustained changes in the effective interest-growth differential. At a given starting ratio, a one-percentage-point increase in the effective nominal rate, with nominal GDP growth unchanged at 3%, increases the annual debt-dynamics component by roughly 1.34 percentage points of GDP. A corresponding increase in nominal GDP growth has a slightly nonlinear but similarly important debt-reducing effect. These are conditional arithmetic sensitivities, not observed annual changes in debt-service expenditure. Their importance lies in demonstrating that small changes in trend nominal growth or the effective interest rate can alter the fiscal adjustment requirement by an amount comparable to a significant annual budgetary measure.
The October 2026 fiscal framework provides unusually useful inputs for scenario construction
The parliamentary examination of Italy’s October 2026 fiscal programme supplies a detailed macroeconomic basis extending beyond the government’s headline debt projections. Under the policy scenario, nominal GDP growth is projected at 3.2% in 2027, 3.0% in 2028 and 2.6% in 2029. The corresponding real GDP growth assumptions are 0.8%, 0.9% and 0.8%, while the GDP deflator is projected to increase by 2.4%, 2.1% and 1.8%. These are internally consistent nominal-growth assumptions up to the rounding differences generated by multiplication rather than simple addition. The distinction matters because fiscal projections should use the GDP deflator and not consumer-price inflation to calculate the nominal GDP denominator. Documento Programmatico di Finanza Pubblica 2026 — Camera dei deputati, Tables 10–11.
Table 7.2 — Italy’s official macroeconomic assumptions and fiscal interest burden
| Indicator | 2026 | 2027 | 2028 | 2029 |
|---|---|---|---|---|
| Real GDP growth, policy scenario | 1.0% | 0.8% | 0.9% | 0.8% |
| GDP deflator growth, policy scenario | 1.7% | 2.4% | 2.1% | 1.8% |
| Nominal GDP growth, policy scenario | 2.7% | 3.2% | 3.0% | 2.6% |
| Interest expenditure / GDP | 4.2% | 4.3% | 4.6% | 4.7% |
| General-government debt / GDP | 138.1% | 138.5% | 137.9% | 136.6% |
| General-government balance, policy scenario | −2.9% | −3.4% | −3.2% | −2.3% |
Source: Camera dei deputati, Documento Programmatico di Finanza Pubblica 2026, Tables 11 and 21 and related debt analysis, October 2026. Interest expenditure is a current-year flow relative to GDP, not the contractual effective interest rate used in the model.
The most important feature is the progression of the interest burden. Italy anticipates that interest expenditure will rise from 4.2% of GDP in 2026 to 4.7% in 2029. This means the government must generate stronger primary fiscal results merely to achieve the planned improvement in its overall balance. The projected primary surplus rises significantly over the same period, illustrating that the government expects fiscal consolidation to be driven by the difference between revenue growth and primary expenditure growth, not by falling interest expenditure. The parliamentary dossier also reports a planned reduction in primary expenditure as a share of GDP despite an increase in its nominal monetary value, reinforcing the importance of distinguishing budgetary restraint relative to economic output from an outright cut in nominal spending.
The programme’s debt projection is also dependent on stock-flow adjustments. The parliamentary analysis identifies a substantial debt-increasing stock-flow component in 2026, associated in part with the continuing financing effects of building-renovation tax credits, followed by a marked reduction in subsequent years. The projected debt decline from 2028 is therefore not simply the result of primary surpluses exceeding the interest burden. It depends on the interaction between nominal growth, fiscal adjustment and the expected reduction in financing operations that increase gross debt without a corresponding contemporaneous deficit. This is a central source of model risk because the settlement of legacy fiscal claims and Treasury liquidity operations are not determined solely by the annual macroeconomic growth forecast.
Scenario construction: a reproducible comparison rather than fabricated forecasting precision
The forward assessment uses three conditional scenarios for Italy and two corresponding paths for Greece. The Italian baseline broadly follows the government’s nominal GDP growth and primary-surplus assumptions, while adopting an explicitly illustrative effective interest-rate path and stock-flow adjustments. The adverse scenario combines weaker nominal growth, higher effective financing costs, a reduced primary surplus and additional stock-flow pressure. The reform scenario assumes a sustained improvement in real productive capacity, stronger primary fiscal performance and a faster reduction in residual stock-flow adjustments. Greece is represented by a baseline path reflecting stronger nominal growth, lower effective interest costs and persistent primary surpluses, together with an adverse alternative that tests weaker growth and fiscal performance.
These scenarios are not generated from estimated statistical distributions and are not assigned numerical probabilities. Their purpose is to identify the sensitivity of the debt ratio and the circumstances under which the Italian–Greek ranking might reverse temporarily or persistently. A probability percentage would require either a defensible empirical base rate and forecasting model or a documented elicitation framework. Neither is available from the published observations alone. Accordingly, relative likelihood is addressed qualitatively, and the displayed outcomes remain conditional on the parameters explicitly stated.
Table 7.3 — Italy: annual assumptions for the baseline scenario
| Variable | 2027 | 2028 | 2029 | 2030 |
|---|---|---|---|---|
| Real GDP growth | 0.8% | 0.9% | 0.8% | 0.8% |
| GDP deflator growth | Approximately 2.38% | Approximately 2.08% | Approximately 1.79% | Approximately 1.79% |
| Nominal GDP growth | 3.2% | 3.0% | 2.6% | 2.6% |
| Effective nominal interest rate | 3.00% | 3.25% | 3.40% | 3.50% |
| Primary surplus / GDP | 0.9% | 1.4% | 2.4% | 2.4% |
| Stock-flow adjustment / GDP | +1.35% | +0.50% | 0.00% | 0.00% |
| Interest-growth differential | −0.20 pp | +0.25 pp | +0.80 pp | +0.90 pp |
Status: analytical assumptions, not an official forecast. Real and nominal GDP assumptions for 2027–2029 follow the Italian government’s October policy framework; 2030 extends the 2029 rates for scenario purposes. The displayed GDP deflators are calculated from the exact nominal/real growth identity and may differ slightly from the government’s rounded published figures. Effective rates and stock-flow adjustments are explicitly constructed assumptions. Official macroeconomic reference: Camera dei deputati, DPFP 2026.
The baseline assumptions deliberately avoid treating the government’s published annual interest expenditure as an effective rate on the opening debt stock. The former is an expenditure flow relative to current GDP, while the latter is a contractual or accounting rate applied to the debt stock. The modelled effective rate is therefore labelled as an assumption, rather than inferred mechanically from an interest-to-GDP figure that may reflect different timing and denominators. Likewise, the stock-flow adjustment is not equated to the projected financing impact of the Superbonus. Housing tax-credit settlements constitute an important part of the financing outlook, but annual stock-flow adjustments also include other financial transactions and debt-management effects.
Table 7.4 — Greece: annual assumptions for the baseline scenario
| Variable | 2027 | 2028 | 2029 | 2030 |
|---|---|---|---|---|
| Real GDP growth | 1.6% | 1.5% | 1.4% | 1.4% |
| GDP deflator growth, derived | 2.36% | 2.27% | 2.17% | 2.07% |
| Nominal GDP growth | 4.0% | 3.8% | 3.6% | 3.5% |
| Effective nominal interest rate | 2.0% | 2.1% | 2.2% | 2.3% |
| Primary surplus / GDP | 3.0% | 2.8% | 2.7% | 2.7% |
| Stock-flow adjustment / GDP | 0.0% | 0.0% | 0.0% | 0.0% |
| Interest-growth differential | −2.0 pp | −1.7 pp | −1.4 pp | −1.2 pp |
Status: constructed scenario assumptions. The 2027 real-growth assumption follows the European Commission’s May forecast, while the primary-surplus assumption is consistent with the approximately 3% projection in the IMF’s 2026 Greece Article IV assessment. Subsequent years are analytical extensions, not official published forecasts. References: European Commission, Greece Forecast, May 2026; IMF, Greece Article IV, May 2026.
The Greek baseline assumes continued nominal economic growth above the Italian rate, a lower effective cost of debt and relatively large primary surpluses. These assumptions are consistent with the broad direction of the institutional evidence, but their exact numerical values are not presented as official estimates. In particular, the assumption of zero stock-flow adjustments is a simplifying condition, not a forecast that Greece will undertake no further early repayments, debt-management transactions or changes in Treasury cash reserves. Its purpose is to isolate the fundamental interaction between nominal growth, effective interest costs and primary fiscal performance. The simplification may lead to differences from official debt forecasts, especially where the authorities use cash reserves or conduct other operations that affect gross debt independently of the annual deficit.
Baseline results: the relative ranking can reverse while both debt ratios decline
Applying the annual debt identity to the baseline assumptions produces an Italian ratio of approximately 138.28% in 2027, 137.72% in 2028, 136.39% in 2029 and 135.19% in 2030. Greece’s ratio declines more rapidly under the corresponding assumptions, reaching approximately 134.99% in 2027, 129.98% in 2028, 125.53% in 2029 and 121.37% in 2030. The constructed paths therefore cross during 2027 and remain separated thereafter, even though the Italian debt ratio also declines moderately after the initial year. This is a central finding of the scenario exercise: Italy can become the higher-debt sovereign without its own debt ratio continuing to rise. A ranking reversal can therefore occur because Greece is reducing debt more rapidly, rather than because Italy is necessarily entering an accelerating debt spiral.
Table 7.5 — Reproducible baseline debt projections
| Year | Italy debt/GDP | Greece debt/GDP | Italy minus Greece | Italy effective interest minus nominal growth | Greece effective interest minus nominal growth |
|---|---|---|---|---|---|
| 2026 starting projection | 138.10% | 140.70% | −2.60 pp | Not applied | Not applied |
| 2027 | 138.28% | 134.99% | +3.29 pp | −0.20 pp | −2.00 pp |
| 2028 | 137.72% | 129.98% | +7.74 pp | +0.25 pp | −1.70 pp |
| 2029 | 136.39% | 125.53% | +10.86 pp | +0.80 pp | −1.40 pp |
| 2030 | 135.19% | 121.37% | +13.82 pp | +0.90 pp | −1.20 pp |
Calculated from Tables 7.3 and 7.4 using the exact annual debt recursion. All projections are conditional analytical outputs, not Eurostat observations, government targets or IMF forecasts.
The baseline shows that the Greek advantage arises from both a stronger denominator effect and a larger primary surplus. Italy’s comparatively modest projected reduction is instead dependent on the disappearance of positive stock-flow adjustments and the maintenance of a primary surplus exceeding the annual snowball effect. The modelled Italian debt ratio of 136.39% in 2029 is close to the government’s October forecast of 136.6%, but this proximity should not be misinterpreted as independent validation: some underlying assumptions were intentionally aligned with the policy scenario. The value of the exercise lies in making explicit the macroeconomic and fiscal conditions necessary to obtain a similar result, particularly the reduction in stock-flow adjustments and the increase in primary fiscal effort.
Adverse scenario: weaker growth and more expensive refinancing compound fiscal pressure
The adverse scenario is constructed around a different economic mechanism. Rather than assuming a single sovereign-market shock, it combines lower nominal GDP growth, higher effective interest rates, weaker primary fiscal performance and continued debt-increasing stock-flow adjustments. This is intentionally more severe than a temporary widening of the Italian–German sovereign spread because it assumes that financing conditions deteriorate persistently and are transmitted progressively to the average cost of outstanding debt. It also assumes that weak growth constrains the government’s ability to deliver its planned primary surpluses. The resulting interaction is important because a fiscal adjustment that might appear feasible under the baseline can become more demanding when the economic denominator grows more slowly and debt-service costs rise.
For Italy, nominal GDP growth is assumed at 1.5% annually from 2027 through 2030, while the effective interest rate rises from 3.8% in 2027 to 4.6% in 2030. The primary surplus remains below the government’s planned path, and positive stock-flow adjustments persist. These are deliberately adverse assumptions, not forecasts derived from market prices. For Greece, nominal growth is reduced to approximately 2.3–2.5%, effective interest rates gradually increase, and primary surpluses decline toward 1.8% of GDP by the end of the horizon. The Greek scenario nevertheless preserves a lower near-term financing cost, reflecting the structural protection provided by its long-duration debt arrangements. The exercise therefore evaluates how a common adverse European environment could affect two sovereigns with different inherited financing structures.
Table 7.6 — Adverse scenario assumptions, 2027–2030
| Sovereign and variable | 2027 | 2028 | 2029 | 2030 |
|---|---|---|---|---|
| Italy nominal GDP growth | 1.5% | 1.5% | 1.5% | 1.5% |
| Italy effective nominal interest rate | 3.8% | 4.1% | 4.4% | 4.6% |
| Italy primary surplus / GDP | 0.5% | 0.8% | 1.0% | 1.0% |
| Italy stock-flow adjustment / GDP | +1.6% | +1.0% | +0.5% | +0.4% |
| Greece nominal GDP growth | 2.5% | 2.5% | 2.3% | 2.3% |
| Greece effective nominal interest rate | 2.3% | 2.5% | 2.7% | 2.8% |
| Greece primary surplus / GDP | 2.2% | 2.0% | 1.8% | 1.8% |
| Greece stock-flow adjustment / GDP | +0.4% | +0.4% | +0.3% | +0.3% |
Status: explicitly constructed adverse assumptions. They are not official institutional forecasts, estimated market-consensus values or statistically derived confidence intervals.
Under these conditions, Italy’s debt ratio increases to approximately 142.33% in 2027, 146.18% in 2028, 149.85% in 2029 and 153.83% in 2030. Greece’s ratio falls more slowly, reaching approximately 138.63%, 137.03%, 136.06% and 135.23% over the same years. The Italian–Greek gap therefore reverses more sharply than in the baseline, but the policy significance is fundamentally different. In the baseline, Italy overtakes Greece while reducing its own debt ratio after 2027. In the adverse scenario, Italy overtakes Greece while experiencing a sustained increase in its debt burden. The distinction is decisive for evaluating solvency risk, fiscal flexibility and exposure to changing market confidence.
The adverse results also reveal the importance of the effective interest-growth differential. By 2030, the Italian effective interest rate exceeds nominal GDP growth by 3.1 percentage points, whereas the corresponding Greek differential is only 0.5 points. At the modelled Italian debt ratio, that difference creates a substantial recurring debt-increasing snowball effect before accounting for the primary balance and stock-flow transactions. Sustained primary surpluses below the level required for stabilisation would therefore allow debt to continue accumulating relative to GDP. In such an environment, the capacity to issue new securities at an affordable cost would become more consequential than the symbolic question of which sovereign had the highest reported ratio.
Reform scenario: stronger real growth reduces the fiscal adjustment required for debt stabilisation
The reform scenario tests the proposition that Italy can improve debt sustainability through a combination of higher productive growth, sustained primary fiscal surpluses and more favourable stock-flow developments. It assumes nominal GDP growth of 4.2% in 2027 and 4.4% annually thereafter, effective interest rates rising gradually from 2.9% to 3.2%, and primary surpluses increasing from 1.5% to 3.0% of GDP. Stock-flow adjustments are assumed to decline from +0.7% of GDP in 2027 to +0.2% in 2028 and zero thereafter. These assumptions are not a forecast of reforms already implemented; they represent a conditional improvement relative to the official Italian growth outlook. Their economic interpretation depends on higher real productivity and output, rather than an inflation shock alone.
The distinction between real growth and inflation is important because a rise in nominal GDP generated exclusively through higher prices may produce offsetting increases in interest expenditure, wage costs, pensions and inflation-linked liabilities. A durable reform scenario therefore requires improvements in output per worker, productive investment, labour-force participation and institutional efficiency. If the higher nominal growth rate were driven by inflation without a corresponding increase in productive capacity, the assumed lower effective interest costs might not be sustainable. The scenario must consequently be interpreted as a joint improvement in productive performance and financing conditions, rather than a mechanical increase in the GDP denominator.
Table 7.7 — Italy’s reform scenario assumptions and resulting debt path
| Year | Nominal GDP growth | Effective interest rate | Primary surplus / GDP | Stock-flow adjustment / GDP | Modelled debt/GDP |
|---|---|---|---|---|---|
| 2027 | 4.2% | 2.9% | 1.5% | +0.7% | 135.58% |
| 2028 | 4.4% | 3.0% | 2.2% | +0.2% | 131.76% |
| 2029 | 4.4% | 3.1% | 2.7% | 0.0% | 127.42% |
| 2030 | 4.4% | 3.2% | 3.0% | 0.0% | 122.95% |
Calculated from the Italian end-2026 starting assumption of 138.1% using the exact debt identity. The improvement is hypothetical; the numerical inputs are not official forecasts.
Under the reform assumptions, Italy’s ratio falls by approximately 15.2 percentage points between the projected starting position and 2030. This is a substantial improvement, but the scenario still produces an Italian debt ratio above the Greek baseline by approximately 1.6 percentage points at the end of the horizon. That result again demonstrates the limitations of the bilateral ranking. Italy could achieve a strong debt-reduction outcome and remain the higher-debt sovereign if Greece also sustained rapid debt reduction. Conversely, an economy could improve its relative ranking because another sovereign deteriorated, without making meaningful progress toward its own fiscal sustainability.
The reform scenario also highlights the implementation burden. Raising the primary surplus from 1.5% to 3.0% of GDP while accelerating real economic growth would require a combination of fiscal measures and structural reforms whose effects are not guaranteed to occur simultaneously. Tax measures can affect incentives and investment; expenditure restraint can weaken demand if implemented abruptly; productivity reforms may require several years before measurable output gains emerge. The scenario is therefore useful as a benchmark for the potential benefits of successful reform, but it should not be treated as an immediately available policy choice without costs or transitional constraints.
Cross-scenario outcomes: the ranking reversal is robust to the selected pathways, but the fiscal consequences are not
The three scenarios produce substantially different Italian debt outcomes while retaining a common central feature: Greece’s debt ratio remains lower by 2030 under the selected assumptions. This does not establish that an Italian overtake is certain. It establishes that, once the difference between the two projected end-2026 ratios has narrowed to 2.6 percentage points, a continued Greek debt reduction of the magnitude contemplated in available institutional assessments can generate a reversal even if Italy simultaneously improves its fiscal trajectory. The result is particularly sensitive to the Greek starting point, primary-surplus performance and nominal GDP growth. Consequently, the crossover should be described as a conditional event under the specified scenarios, rather than assigned an unsupported probability.
Table 7.8 — Debt/GDP outcomes under three alternative scenarios
| Scenario | Sovereign | 2027 | 2028 | 2029 | 2030 | Change from projected end-2026 |
|---|---|---|---|---|---|---|
| Baseline | Italy | 138.28% | 137.72% | 136.39% | 135.19% | −2.91 pp |
| Baseline | Greece | 134.99% | 129.98% | 125.53% | 121.37% | −19.33 pp |
| Adverse | Italy | 142.33% | 146.18% | 149.85% | 153.83% | +15.73 pp |
| Adverse | Greece | 138.63% | 137.03% | 136.06% | 135.23% | −5.47 pp |
| Reform | Italy | 135.58% | 131.76% | 127.42% | 122.95% | −15.15 pp |
| Reform comparator | Greece | 134.99% | 129.98% | 125.53% | 121.37% | −19.33 pp |
Computed from the disclosed annual assumptions and rounded to two decimal places. The reform comparison holds Greece on its baseline path to isolate the effect of Italian reforms. These results are not the published forecasts of the IMF, European Commission or national governments.
The difference between the baseline and adverse Italian outcomes reaches approximately 18.6 percentage points of GDP by 2030. This is not an estimated confidence interval. It measures the distance between two deliberately different parameter combinations. The scenario spread is large because the model compounds several changes over four years, including higher effective financing costs, weaker nominal output growth, smaller primary surpluses and persistent stock-flow adjustments. Attributing the entire difference to interest rates, or any single component, would therefore be incorrect.
The reform scenario improves Italy’s 2030 ratio by approximately 12.2 percentage points relative to the baseline. Its significance is not that such an outcome can be guaranteed through discretionary economic policy, but that a credible combination of stronger productive growth and primary fiscal consolidation materially changes the debt trajectory. The model also makes clear that the economic benefits of reform cannot be evaluated without examining implementation lags: institutional reforms that eventually raise potential output may impose initial budgetary costs and may not produce their full growth contribution within a four-year horizon.
Sensitivity analysis identifies the variables capable of changing the debt trajectory
One-variable sensitivity tests provide a more transparent assessment of the debt mechanism than a comparison of bundled scenarios alone. Starting from the Italian baseline, the effective nominal interest rate is increased by one percentage point in every year from 2027 to 2030, with all other assumptions unchanged. A separate test reduces nominal GDP growth by one percentage point annually. Two additional tests reduce the primary surplus or increase stock-flow adjustments by one percentage point of GDP annually. These perturbations are deliberately symmetric in their numerical size, but they are not necessarily equally probable or economically independent.
Table 7.9 — Italy: isolated annual shocks applied to the 2027–2030 baseline
| Sensitivity experiment | 2030 debt/GDP | Difference from baseline |
|---|---|---|
| Baseline | 135.19% | — |
| Effective nominal interest rate +1 pp each year | 140.68% | +5.49 pp |
| Nominal GDP growth −1 pp each year | 140.76% | +5.57 pp |
| Primary surplus −1% GDP each year | 139.23% | +4.04 pp |
| Stock-flow adjustment +1% GDP each year | 139.23% | +4.04 pp |
Reproducible deterministic sensitivity calculations. Each shock is applied separately; the outcomes must not be added together because combined shocks alter the underlying debt stock and can interact nonlinearly.
The near similarity between the effects of a one-point interest-rate increase and a one-point nominal-growth reduction is economically significant. It demonstrates why fiscal sustainability can deteriorate even without an increase in discretionary spending: the denominator may grow more slowly while the existing debt stock becomes progressively more expensive. The primary-balance and stock-flow experiments also show that a sustained annual change of one percentage point produces a cumulative effect exceeding four percentage points of GDP by 2030. This arithmetic reinforces the importance of monitoring the settlement of previously recognised fiscal obligations and the actual implementation of annual consolidation measures.
The interest-rate sensitivity must nevertheless be interpreted with particular caution. A one-point increase in the effective interest rate applied to the existing debt stock over the projection period is not equivalent to a one-point increase in the yield of newly issued government securities. The transmission from marginal yields to the portfolio’s effective cost depends on refinancing, maturity, coupon structures and other debt-management operations. Italy’s outstanding fixed-rate securities provide a degree of protection against immediate repricing; the effective-rate shock therefore represents an adverse portfolio-level assumption, not the automatic consequence of a market spread widening by 100 basis points.
Decomposing a sovereign ranking reversal into its absolute and relative components
The condition for a crossover is that Italy’s debt ratio exceeds Greece’s at the same date. Starting from the mixed-vintage projected end-2026 values of 138.1% for Italy and 140.7% for Greece, the relevant initial gap is 2.6 percentage points. A crossover occurs whenever the cumulative Italian debt-ratio change exceeds the corresponding Greek change by more than 2.6 points. The economic interpretation depends on whether Italy’s own ratio is increasing, stabilising or declining.
Three different outcomes must therefore be distinguished. In the first, Italy’s debt ratio increases while Greece’s falls, producing a widening difference through absolute fiscal divergence. In the second, Italy’s ratio remains broadly stable while Greece’s continues falling, producing a statistical reversal without significant Italian deterioration. In the third, both ratios decline, but Greece’s falls faster, making Italy the higher-debt sovereign despite simultaneous progress in both countries. The baseline and reform scenarios demonstrate the third outcome, whereas the adverse scenario illustrates the first.
This distinction is particularly important for European fiscal surveillance. The legal and economic assessment of each country’s debt sustainability should not depend on whether another member state has achieved faster debt reduction. The Italian government could meet its own debt-reduction objectives and nevertheless become the country’s highest-debt sovereign. Conversely, Italy could improve its relative ranking if Greek debt increased for unrelated reasons, without reducing its own debt burden. The ranking is therefore a useful comparative indicator, but not an independent fiscal-policy objective.
Alternative hypotheses and the indicators capable of distinguishing them
The forward assessment supports three competing, partially overlapping hypotheses. The first is that Italy’s apparent convergence with Greece reflects a lasting difference in nominal growth, primary fiscal performance and financing structures, making a sustained ranking reversal a foreseeable conditional outcome. The second is that some of the divergence has been amplified by temporary factors, including quarterly financing operations, post-crisis Greek recovery and the timing of Italian housing-credit settlements, implying that the gap could stabilise after those factors diminish. The third is that a material improvement in Italian growth and primary fiscal performance could reduce the absolute debt burden sufficiently to change the economic interpretation of any crossover, even if the statistical ranking remains reversed.
Table 7.10 — Competing debt pathways and falsifiable indicators
| Hypothesis | Supporting mechanism | Evidence that would weaken it | Decision-relevant observation |
|---|---|---|---|
| Persistent structural divergence | Greece sustains stronger nominal growth and primary balances; Italy faces higher effective financing costs | Greek growth slows materially or Italian productivity accelerates | Repeated annual debt decompositions and realised primary balances |
| Temporary convergence amplified by timing | Quarterly liquidity management and Italian legacy tax-credit settlement affect reported debt | Divergence persists after stock-flow effects diminish | Annual stock-flow reconciliation and Treasury cash requirements |
| Italian reform changes debt sustainability | Higher potential growth and persistent primary surpluses reduce the required adjustment | Weak real investment returns or persistent growth underperformance | Productivity, investment completion, medium-term fiscal execution |
The hypotheses overlap because temporary stock-flow effects may coexist with a structural growth difference, and productive reforms may improve Italy’s position without eliminating the Greek official-financing advantage. Their relative standing therefore cannot be established from a single quarterly comparison. The appropriate approach is to monitor observations that discriminate between the mechanisms: annual nominal GDP and GDP-deflator developments, primary balances, the financing of outstanding tax-credit obligations, average debt-service costs, and the maturity distribution of new issuance.
The limitations of official projections and the risk of systematic forecast bias
Official debt forecasts are indispensable evidence of government intentions and institutional expectations, but they are not neutral observations of future economic outcomes. National government forecasts may incorporate planned fiscal measures whose implementation depends on parliamentary authorisation and administrative execution. International forecasts may assume unchanged policies or use information that predates subsequent legislative decisions. Debt-management forecasts may rely on assumptions concerning future market rates and issuance conditions that can change rapidly. Moreover, the underlying GDP and fiscal series are subject to statistical revisions, which can alter the starting debt ratio without representing any new borrowing or repayment.
The Italian October 2026 programme illustrates the importance of these distinctions. Its projected reduction in the debt ratio after 2027 depends on stronger primary fiscal outcomes and diminishing stock-flow adjustments. The IMF’s July 2026 baseline and recommended adjustment path reflect different information and policy assumptions. The European Commission’s May forecasts are earlier still. A comparison of their numerical values without reconstructing the vintage and policy basis would attribute differences to institutional disagreement when they may also reflect changed macroeconomic conditions, revised historical data or different definitions of the forecast scenario. Camera dei deputati, DPFP 2026, October 2026; IMF, Italy 2026 Article IV Consultation, July 2026.
The principal model limitations are therefore explicit. The scenarios use selected annual effective interest rates rather than a complete security-by-security repayment and refinancing schedule. They do not model stochastic correlations between growth, inflation, sovereign spreads and fiscal revenues. They treat primary surpluses and stock-flow adjustments as exogenous annual inputs instead of deriving them from detailed fiscal legislation and financial transactions. They also do not estimate the economic effects of fiscal consolidation through an endogenous growth model. These restrictions mean that the outputs should be used for debt-arithmetic sensitivity and conditional comparison, not as a substitute for a complete IMF-style debt-sustainability analysis incorporating financing needs, stochastic fan charts and stress tests.
Key judgments — Chapter 7. The available evidence supports the conclusion that the Italian–Greek debt-ratio ranking can reverse without an Italian sovereign-financing crisis, and that a sustained relative reversal can coexist with improving absolute Italian debt sustainability. In the explicitly constructed baseline, Italy declines to approximately 135.2% of GDP by 2030 while Greece falls more rapidly to approximately 121.4%. Under adverse assumptions, Italy instead rises to approximately 153.8%, illustrating the more consequential danger of a persistent positive interest-growth differential combined with insufficient primary surpluses and debt-increasing stock-flow adjustments. Under the reform scenario, stronger nominal growth and primary fiscal performance reduce Italy’s ratio to approximately 123.0%. These values are conditional model outputs, not assigned probabilities. The most important monitoring variables are nominal GDP growth, effective interest costs, realised primary fiscal balances, refinancing conditions and the remaining financing effects of legacy fiscal obligations.
Chapter 8 — Fiscal and Strategic Policy Options: Debt Stabilisation, Growth Acceleration and European Risk-Sharing
Debt stabilisation requires an integrated fiscal and growth strategy rather than a single adjustment instrument
The principal policy implication of the forward analysis is that Italy’s debt sustainability cannot be secured reliably through a single measure, whether higher taxation, spending restraint, debt-maturity extension or European financial support. Each instrument operates through a different economic channel and imposes different political and institutional costs. Primary-balance consolidation changes the flow of new borrowing generated by government operations. Productivity-enhancing reforms affect the capacity of the economy to produce taxable income and expand the nominal GDP denominator. Debt-management operations alter the timing, cost and liquidity characteristics of financing obligations without necessarily reducing their face value. European instruments can provide targeted financing, institutional support or fiscal flexibility, but they do not automatically remove national repayment liabilities. The relevant policy challenge is therefore to combine instruments that improve the long-term debt trajectory without undermining the economic growth required to sustain the fiscal adjustment.
This conclusion is consistent with the IMF’s 2026 assessment, which identified further fiscal consolidation and productivity reform as complementary requirements for durable Italian debt reduction. The Fund considered additional fiscal effort of approximately 1% of GDP over 2026–2027, beyond the measures then planned, useful for strengthening debt sustainability, while acknowledging that the adjustment could be spread over a longer period if growth disappointed. The Fund also emphasised the importance of expenditure efficiency, tax-base broadening, improved compliance and limiting new spending commitments that lack offsetting financing. These were IMF staff recommendations under the information available in May and July 2026, not legally binding fiscal instructions or a direct assessment of every measure subsequently incorporated in the government’s October programme. Italy: Staff Concluding Statement of the 2026 Article IV Mission — International Monetary Fund, 27 May 2026; IMF Executive Board Concludes 2026 Article IV Consultation with Italy — IMF, 24 July 2026.
The central trade-off concerns timing. Fiscal consolidation can reduce borrowing requirements rapidly if implemented through measures with immediate budgetary effects, but it may weaken economic activity if it reduces productive investment, household purchasing power or private-sector incentives at an unfavourable stage of the cycle. Structural reforms can increase potential output and gradually improve the tax base, but often require implementation expenditure and time before their effects appear in measured productivity. Debt-management operations can moderate short-term refinancing risk without changing the government’s underlying primary fiscal position. European financing can support strategic projects or improve the contractual structure of investment finance, but remains subject to eligibility, legal authority and, where financing takes the form of loans, repayment obligations. These instruments are consequently complementary rather than interchangeable.
Primary-balance consolidation must preserve the distinction between expenditure efficiency and expenditure compression
The immediate fiscal lever available to the Italian government is an improvement in the primary balance through higher recurring revenue, lower primary expenditure or a combination of the two. The economic consequences differ according to the composition of the measures. Reducing poorly targeted transfers or expenditures that generate limited public value can improve the fiscal balance without producing a proportionate reduction in productive activity. Reducing well-designed infrastructure investment, education expenditure or maintenance of critical public assets may improve the current fiscal balance while weakening future economic growth. Similarly, increasing taxation through improved compliance can generate revenue without necessarily raising statutory rates, whereas higher marginal tax rates can affect labour supply, investment or capital allocation depending on their design.
The IMF’s 2026 consultation recommended strengthening spending reviews, using digitalisation to improve administrative efficiency, simplifying the tax system, reducing inefficient tax expenditures and broadening the tax base. It also identified preferential tax treatment, property valuation practices and the design of self-employment taxation as areas warranting examination. These recommendations should be distinguished from enacted Italian government policy. Their significance for debt sustainability is that they seek to improve the primary balance through structural changes in revenue collection and expenditure allocation rather than rely exclusively on reductions in public services or increases in headline tax rates. IMF, Italy 2026 Article IV Consultation, July 2026.
The government’s October fiscal programme provides a numerical reference for the magnitude of the adjustment already envisaged. The policy scenario anticipates increasing primary surpluses in the later years of the plan, while primary expenditure declines as a percentage of GDP. The parliamentary analysis observes that the nominal level of primary expenditure can continue increasing even as its GDP share declines, provided nominal GDP grows more rapidly. This distinction is politically important because it allows fiscal consolidation to occur through expenditure growth below nominal GDP growth rather than necessarily requiring nominal expenditure cuts. The strategy nevertheless depends on the accuracy of nominal GDP projections and the ability to restrain expenditure categories exposed to demographic and inflationary pressures. Camera dei deputati, Documento Programmatico di Finanza Pubblica 2026, sections on primary expenditure and balances.
The quality of consolidation matters as much as the headline primary-surplus target
The macroeconomic effect of fiscal consolidation depends on which components of expenditure are reduced, which revenues are increased and how quickly households and businesses adjust. A consolidation package concentrated on administrative efficiency, procurement transparency and the removal of ineffective fiscal privileges may have different growth consequences from one based primarily on reductions in productive capital expenditure. Similarly, a tax reform that broadens the base while reducing distortionary rates can alter incentives differently from a general increase in taxation. The policy assessment should therefore distinguish the gross budgetary yield of a measure from its net contribution after changes in economic activity, compliance and implementation costs.
Italy’s fiscal framework also creates a specific difficulty associated with recurrent spending commitments. Pension payments, public-sector compensation, healthcare provision and other essential services cannot be adjusted with the same speed or reversibility as discretionary investment subsidies. Demographic ageing and inflation-indexation mechanisms can produce expenditure growth independently of new policy initiatives. Consequently, a credible consolidation programme must account for the legal and demographic characteristics of spending rather than infer that all primary expenditure is equally adjustable. The government’s October programme anticipates an increase in pension expenditure associated with lagged inflation effects, illustrating the persistence of expenditure pressures even when inflation itself begins to moderate. Camera dei deputati, DPFP 2026, analysis of primary expenditure and pension indexation.
An institutionally credible approach would also distinguish temporary fiscal measures from permanent adjustment. One-off revenue operations can improve an annual deficit without changing the underlying structural position, while the cancellation of a temporary expenditure programme may produce an apparent improvement that cannot be repeated in subsequent years. For debt sustainability, the relevant contribution is the persistent improvement in the primary balance relative to the baseline, net of any adverse economic effects. This requirement is particularly important when a government projects a declining debt ratio after the termination of an exceptional financing burden: the disappearance of a temporary stock-flow adjustment may support a short-term improvement, but sustained debt reduction subsequently requires a favourable balance between nominal growth, interest costs and primary fiscal performance.
Productivity reform is a debt-management instrument operating through the economic denominator
The second principal lever is structural growth. In a sovereign with debt near 140% of GDP, small sustained improvements in nominal GDP growth can have substantial cumulative effects on the debt ratio. The scenario analysis demonstrates that a one-percentage-point reduction in annual nominal growth over the projection period increases Italy’s 2030 debt ratio by approximately 5.6 percentage points relative to the constructed baseline. The reverse implication is that a durable improvement in growth can reduce the primary surplus required for stabilisation, provided that it is not offset by a corresponding increase in financing costs or new fiscal liabilities. Structural growth is therefore not merely a long-term economic objective separate from public finance; it is a determinant of the arithmetic sustainability of the debt stock.
The IMF identifies productivity, demographics, imported-energy dependence and the business environment as important constraints on Italy’s medium-term growth prospects. Its policy recommendations include improving competition, strengthening the efficiency of public administration, facilitating labour-market participation and supporting investment through reforms that increase productive capacity. The importance of these measures lies in their interaction. A reform that increases labour supply may have limited aggregate effects if investment and labour demand do not expand sufficiently. Additional business investment may generate weaker productivity gains if administrative delays or infrastructure bottlenecks constrain its productive use. Digitalisation may improve efficiency, but its measured economic effect depends on organisational adaptation, skills and the diffusion of technology across enterprises. IMF Executive Board Concludes 2026 Article IV Consultation with Italy — IMF, 24 July 2026.
This implies that growth-enhancing reforms should be evaluated through observable outcomes rather than the number of measures formally adopted. Legislative approval, administrative implementation, private investment response and realised productivity improvement represent different stages of the causal chain. A reform may satisfy a procedural milestone while producing economic benefits only after several years; alternatively, a technically well-designed measure may generate limited results because complementary conditions are absent. For a debt-sustainability assessment, the relevant evidence is whether the reforms raise potential output, improve employment and productivity or expand the recurrent tax base sufficiently to reduce the required primary adjustment.
Labour-force participation and demographic adjustment create both fiscal opportunities and distributional constraints
Labour-market participation offers an additional route to increasing potential output, particularly where participation rates remain low among women, older workers or other groups facing structural barriers to employment. Increasing participation can raise output, labour-income taxation and social-contribution receipts, while reducing the fiscal consequences of demographic ageing. However, the effect depends on the availability of suitable jobs, skills, childcare and transport infrastructure, the design of tax and benefit systems, and the relationship between wages and productivity. Measures that encourage employment without improving the productive allocation of labour may increase total hours worked but generate a smaller improvement in output per worker.
Pension and retirement policies introduce a further trade-off. Restricting early retirement can increase effective labour supply and moderate future pension obligations, but the economic effects depend on health, occupational conditions, employment opportunities and transitional protection for affected groups. The IMF’s May 2026 consultation welcomed reductions in early-retirement arrangements as a measure capable of supporting labour supply and easing pension pressures over time. Such reforms should not be assessed solely through immediate expenditure savings, because they affect employment, contribution revenue and social distribution across cohorts. IMF, Italy: Staff Concluding Statement of the 2026 Article IV Mission, May 2026.
Debt management can reduce refinancing vulnerability but cannot substitute for fiscal sustainability
The Italian Treasury can influence refinancing risk through the maturity, coupon structure, investor distribution and timing of debt issuance. Extending maturities may reduce exposure to future interest-rate increases and smooth the redemption calendar, but investors generally require compensation for assuming longer-duration risk. Increasing shorter-dated issuance can lower immediate borrowing costs in certain market conditions but creates more frequent refinancing obligations and greater exposure to subsequent interest-rate changes. Inflation-linked securities offer particular investor characteristics but can transmit inflation shocks to the government’s nominal liabilities and interest expenditure. Retail-oriented issuance may diversify the investor base, while buybacks and exchanges can alter maturity concentrations or market liquidity.
These operations can materially improve the management of gross financing requirements, but they do not inherently reduce the government’s underlying fiscal deficit. Issuing a new bond to redeem an existing bond replaces a liability rather than extinguishing the sovereign’s financing obligation. A buyback financed from Treasury cash reserves can reduce outstanding gross debt while also reducing liquid assets. An exchange can extend maturities but may alter coupons, market valuations or contractual costs. The economic evaluation must therefore account for both sides of the transaction and distinguish nominal debt reduction from changes in liquidity, market risk and the present value of future obligations.
The IMF’s July 2026 Italian assessment identifies the need to preserve fiscal credibility and reduce sensitivity to adverse financing conditions, while the European Central Bank’s financial-stability analysis emphasises the growing importance of sovereign financing requirements and investor demand for different maturities. The policy implication is not to prescribe a specific maturity target without market evidence, but to evaluate the Treasury’s debt-management operations against refinancing concentration, effective interest costs and the resilience of the investor base. IMF, Italy 2026 Article IV Consultation, July 2026; European Central Bank, Financial Stability Review, May 2026.
Public guarantees and contingent liabilities require a separate fiscal-risk framework
Government guarantees create potential fiscal obligations that differ from direct Maastricht debt. A guarantee may not initially require a cash payment or immediate recognition as a conventional debt liability, but it can generate expenditure or financing needs if the guaranteed borrower fails to meet its obligations. The economic risk depends on the probability of the underlying default, expected recoveries, the concentration of guarantees and the potential correlation between private-sector distress and a deterioration in public finances. A recession or financial shock can therefore generate simultaneous pressure on tax revenues, social expenditure and contingent liabilities.
The IMF’s 2026 consultation recommended recalibrating Italy’s elevated public guarantees toward pre-pandemic levels as part of rebuilding fiscal resilience. This recommendation does not imply that every guarantee will be called or that their full nominal value should be added mechanically to Maastricht debt. It identifies a potential channel through which fiscal risks can materialise outside the ordinary annual deficit forecast. The appropriate policy response requires transparent reporting of guarantee stocks, beneficiary categories, maturity structures, risk provisioning and realised losses, with particular attention to concentrations among borrowers exposed to the same macroeconomic shocks. IMF Executive Board Concludes 2026 Article IV Consultation with Italy — IMF, July 2026.
The Recovery and Resilience Facility creates a transition from exceptional financing to permanent investment discipline
The closure of the Recovery and Resilience Facility implementation phase is a significant constraint on the policy horizon. The European Commission’s October 2026 annual report states that implementation milestones and targets had to be completed by 31 August 2026, final payment requests submitted by 30 September and payments completed by 31 December 2026. By the beginning of October, approximately €450 billion had been disbursed, representing 79% of the facility’s envelope, while 32 remaining payment requests amounting to €123 billion were under assessment. These figures describe the European Union-wide position, not an amount available to Italy or Greece for discretionary allocation. Recovery and Resilience Facility Annual Report 2026 — European Commission, 7 October 2026.
The facility’s expiry changes the financing of future public investment but does not eliminate the value of already completed projects. Roads, railways, digital infrastructure, energy networks, educational facilities and administrative systems can continue generating economic benefits after the final European payment. However, future investment will require a combination of national budget resources, other European programmes, private-sector financing or new instruments authorised through the appropriate legal procedures. Governments therefore need to distinguish the completion of an investment project from the maintenance and operational expenditure necessary to preserve its benefits. Infrastructure that requires continuing operating subsidies or public maintenance creates future fiscal obligations even when its initial construction was financed through an exceptional grant.
For Italy, the most important policy requirement is to prevent the temporary investment cycle from becoming a permanent financing gap. If public capital expenditure declines sharply after RRF closure, the economy could lose an important source of demand and future productive capacity. If the government attempts to maintain the same expenditure level entirely through additional national borrowing, debt sustainability could deteriorate unless the investments generate sufficiently strong economic returns. A selective investment strategy therefore needs to prioritise projects that remove identifiable productive bottlenecks, support private capital formation and produce measurable long-term benefits. The assessment should not assume a particular fiscal multiplier for all investment, because the economic return depends on sector, design, utilisation and the state of the economy.
European financial instruments offer differentiated forms of support, not a unified debt guarantee
European Union instruments can influence national debt sustainability through several mechanisms. Grants can finance eligible expenditure without creating a corresponding direct loan repayment obligation for the beneficiary state, although the Union must finance its own budget and borrowing commitments. Loans can provide funding with contractual terms different from those available to individual sovereigns, but remain liabilities of the borrower. Guarantees can mobilise private investment while creating contingent exposures. Fiscal flexibility can permit specified deviations from an expenditure path without changing the underlying cash requirement. Monetary-transmission measures can address disorderly financial conditions under the ECB’s mandate, but do not constitute ordinary fiscal financing programmes.
The Security Action for Europe instrument provides a concrete illustration of the loan model. The €150 billion facility was established to support strategic defence financing through eligible loans and procurement arrangements, using European Union market borrowing. Its economic value depends on the financing conditions, the effectiveness of joint procurement and the productive or strategic benefits of the resulting expenditure. It does not represent a grant of €150 billion to national treasuries or an unconditional assumption of their existing debt. SAFE — Security Action for Europe — European Commission.
Any successor to the RRF would require a distinct legal and political decision. The existence of the temporary RRF, SAFE or other European instruments does not establish an approved general-purpose successor facility for national investment after 2026. A responsible financing assessment should therefore distinguish funds legally allocated under existing programmes from possible future instruments that remain subject to institutional negotiation. The political feasibility of broader European risk sharing depends on the legal basis, financial commitments, allocation criteria and willingness of member states to accept associated liabilities. Treating hypothetical future European financing as already available fiscal capacity would overstate the government’s policy options.
A policy trade-off matrix must connect authority, fiscal effect, implementation and risk
The available policy instruments vary not only in their projected economic benefits but also in the authority required to implement them. Some measures can be adopted through the annual national budget, subject to parliamentary approval and domestic legal constraints. Others require administrative reforms, coordination across levels of government or negotiation with European institutions. Debt-management operations generally fall within the Treasury’s authorised financing framework, while changes to European Union fiscal rules or the creation of new common financing instruments require action through the relevant Union legal procedures. This institutional distinction is essential because a technically attractive measure cannot be considered operationally available merely because its economic mechanism is sound.
Table 8.1 — Policy options, institutional authority and fiscal-economic trade-offs
| Policy instrument | Principal authority | Expected debt mechanism | Time to material effect | Implementation burden | Main downside |
|---|---|---|---|---|---|
| Primary expenditure review | National government, Parliament and administrations | Reduces recurring primary financing needs | Near to medium term | Administrative and political | Reductions may affect service quality or demand |
| Tax compliance and base broadening | Parliament, tax administration | Improves recurring revenue without necessarily raising statutory rates | Near to medium term | Administrative systems and enforcement | Compliance costs and distributional effects |
| Tax-expenditure rationalisation | National legislature and fiscal authorities | Reduces revenue forgone through inefficient preferences | Near to medium term | Legal and sectoral review | Changes investment and household incentives |
| Productivity and competition reforms | National and, where applicable, EU authorities | Raises real output and future fiscal capacity | Medium to long term | Institutional reform and complementary investment | Benefits uncertain and potentially delayed |
| Labour participation measures | Parliament and relevant administrations | Expands employment, taxable income and contributions | Medium term | Labour-market and social-policy coordination | Transitional distributional costs |
| Pension-system adjustment | Parliament and social-security institutions | Affects future expenditure and labour supply | Long term | High legal and political complexity | Cohort and occupational inequality concerns |
| Maturity extension and issuance diversification | National Treasury or debt-management office | Reduces refinancing concentration and rate-reset exposure | Immediate portfolio effect; long-run benefit | Market demand and execution | Higher term premium or issuance cost |
| Cash-reserve management | Treasury and competent government entities | Alters short-term liquidity and gross financing needs | Immediate | Operational and institutional | Reduced liquidity buffers if used excessively |
| Public-guarantee reduction | Government and guarantee authorities | Limits contingent fiscal exposure | Medium term | Contractual and beneficiary constraints | Reduced credit availability for eligible borrowers |
| Selective productive investment | National and European programme authorities | Raises potential GDP and future revenue | Medium to long term | Project delivery and evaluation | Cost overruns and weak realised returns |
| Existing EU loan programmes | EU institutions and national authorities | Changes financing terms for eligible expenditure | Programme-dependent | Eligibility, procurement and reporting | Repayment obligations and limited scope |
| New EU common financing | Competent EU institutions and member states | Could expand eligible financing capacity | Requires new institutional decisions | High | Legal, distributional and political uncertainty |
Institutional and policy framework supported by IMF, Italy Article IV Consultation, July 2026, Camera dei deputati, DPFP 2026, European Commission, RRF Annual Report 2026 and European Commission, SAFE. Time-to-effect classifications are analytical judgments, not statutory implementation deadlines.
The matrix identifies no universally dominant instrument. Primary-balance consolidation can affect borrowing more quickly than structural reform, but its composition determines the economic cost. Growth reforms may provide a larger long-term contribution to sustainability but involve uncertainty and delay. Debt management can improve resilience to financial shocks without resolving the underlying fiscal balance. European programmes may improve financing terms for designated expenditure but cannot be assumed to cover general fiscal needs. A coherent policy programme must therefore prioritise measures according to the specific constraint being addressed, rather than treat every instrument as a substitute for immediate debt reduction.
Fiscal choices must be evaluated against their impact on the investment-growth relationship
A significant risk in high-debt economies is that fiscal consolidation becomes concentrated on the easiest expenditure categories to postpone rather than those with the lowest social and economic value. Public investment is often more discretionary in the annual budget than pension or wage expenditure, making it vulnerable to adjustment when governments face binding fiscal constraints. Yet reducing productive investment can weaken future GDP growth and thereby increase the primary surplus required to stabilise debt. The interaction creates a potential adverse feedback loop in which consolidation lowers immediate borrowing but also reduces the denominator of the debt ratio.
The opposite policy error is to classify all public investment as growth-enhancing without demonstrating its productivity effects. Projects may experience delays, cost overruns, limited utilisation or inadequate integration with existing infrastructure. They may also involve significant imported capital goods, reducing their short-run domestic demand effect. A defensible investment strategy therefore requires project-level appraisal and ex-post evaluation, with attention to the additional productive capacity generated and the recurrent fiscal costs created. The fiscal value of an investment cannot be inferred solely from the proportion financed by European funds, because grants and loans have different budgetary implications and projects may create future operating obligations.
The IMF’s emphasis on spending efficiency and productivity reform is relevant to this problem. Its assessment recognises that fiscal adjustment needs to preserve the conditions for medium-term growth and recommends a combination of more efficient expenditure, improved taxation and structural reform. The broader implication is that the primary balance should be improved through measures that impose the smallest feasible loss of productive capacity, while investment should be selected according to demonstrated economic and strategic returns rather than nominal spending targets. IMF Executive Board Concludes 2026 Article IV Consultation with Italy — IMF, July 2026.
Italy and Greece require different policy responses despite their converging debt ratios
The Italian policy problem is dominated by the need to sustain market financing at affordable rates while generating stronger productivity growth and maintaining sufficient primary fiscal surpluses. Greece’s policy problem is different because much of its inherited public debt has long contractual maturities and official-sector financing characteristics, while its medium-term challenge is to preserve fiscal performance, maintain productive investment and avoid the erosion of growth after the exceptional recovery phase. Greece’s official financing structure gives it additional time to adjust to changes in market borrowing costs, but does not remove its need for fiscal discipline and productive economic development.
The IMF’s May 2026 Greece Article IV assessment recognised strong fiscal performance and progress in tax compliance while identifying persistent productivity weaknesses, demographic pressures and investment requirements. It expected primary surpluses to remain substantial over the medium term and emphasised the importance of completing structural reforms. The Greek government therefore faces a policy choice concerning the use of fiscal space: maintaining debt reduction, supporting households, strengthening investment or accelerating repayments to official creditors. The optimal combination depends on financing terms, growth effects and the availability of liquid assets. Early repayment of low-cost official loans does not necessarily provide the same financial return as retiring higher-cost market liabilities or preserving cash reserves, although contractual obligations and institutional objectives may also influence the decision. IMF Executive Board Concludes 2026 Article IV Consultation with Greece — IMF, 27 May 2026.
For Italy, the central policy risk is an adjustment strategy that relies too heavily on optimistic nominal growth or an assumed disappearance of stock-flow effects without sufficient verification of actual cash requirements. For Greece, the principal danger would be interpreting its favourable debt-service profile as evidence that future fiscal discipline or productivity reform is unnecessary. Both countries should be evaluated on the durability of their fiscal and economic outcomes, but the sequencing and implementation of reforms must reflect their different starting conditions.
Decision thresholds should be linked to observable fiscal and financing variables
A monitoring framework for senior policymakers and institutional investors should distinguish leading indicators from outcomes already visible in annual debt statistics. The Maastricht debt ratio is an important summary indicator, but it changes only after the underlying fiscal and financing transactions have occurred. Earlier signals include changes in the primary balance, actual tax revenue, net-expenditure execution, debt issuance costs, refinancing concentration, and the utilisation of tax credits. Longer-term signals include productivity growth, employment participation, investment completion and the extent to which public capital expenditure generates additional private activity.
Table 8.2 — Sovereign debt watch indicators and decision thresholds
| Indicator | Monitoring frequency | Material adverse signal | Required institutional evidence |
|---|---|---|---|
| Primary balance | Quarterly and annual | Persistent underperformance relative to authorised fiscal objectives | National statistical office and fiscal documents |
| Stock-flow adjustments | Quarterly and annual | Residual debt accumulation exceeds reconciled financing assumptions | Eurostat, Treasury and central-bank debt statistics |
| Effective interest expenditure | Quarterly and annual | Sustained increase relative to nominal GDP and planned primary resources | Government accounts and debt-management records |
| New issuance yields | Auction and market frequency | Persistent increase across several maturity segments | Treasury auction results and official market data |
| Gross financing requirements | Annual and rolling maturity horizon | Higher refinancing concentration combined with additional borrowing needs | Treasury funding programmes |
| Net-expenditure control account | Annual | Material accumulated deviations under the applicable EU rules | European Commission and Council assessments |
| Nominal GDP growth | Quarterly and annual | Repeated shortfalls relative to debt-stabilising assumptions | National accounts and official forecasts |
| Productivity | Annual and multi-year | Failure of completed reforms and investments to raise output per worker | National statistics, OECD and Commission evaluations |
| Public guarantees | Quarterly and annual where published | Rising realised losses or concentrated contingent exposures | Government guarantee and fiscal-risk reporting |
| European financing | Programme milestones and decisions | Loss of expected eligible funding or increased national co-financing requirements | Official EU decisions and payment records |
These are analytical decision indicators, not statistically estimated crisis triggers. The applicable numerical legal thresholds are defined separately under the European fiscal framework. Sources: IMF, Italy Article IV Consultation, July 2026; European Commission, RRF Annual Report 2026; Camera dei deputati, DPFP 2026.
The monitoring framework should also preserve the difference between adverse observations that require policy attention and formal legal triggers. An increase in gross financing requirements may be economically important without constituting a breach of European fiscal rules. A net-expenditure deviation may be institutionally significant without implying an immediate sovereign funding crisis. A deterioration in productivity may threaten long-term debt sustainability even while annual deficit targets are achieved. The decision framework must therefore integrate legal compliance, cash financing and economic capacity rather than convert them into a single undifferentiated risk score.
Final policy assessment: the sustainability objective is to reduce vulnerability, not merely achieve a favourable debt ranking
The central policy objective for Italy is to create a debt trajectory that remains manageable under a range of plausible adverse conditions. This requires an improvement in the primary fiscal position, a gradual reduction in reliance on debt-increasing stock-flow transactions, productive economic growth and a financing structure capable of absorbing changes in interest rates without generating destabilising refinancing concentrations. The government’s October 2026 fiscal programme provides a conditional path toward lower debt after 2027, but the path’s credibility depends on its execution and on macroeconomic developments that remain uncertain.
European institutions can contribute through coordinated fiscal surveillance, targeted financial instruments, market integration and monetary-transmission safeguards within their legal mandates. However, no instrument eliminates the national economic requirement to generate sufficient future fiscal resources. The Greek experience demonstrates the importance of creditor structure and nominal growth, while the Italian case illustrates the systemic implications of a large market-financed debt stock. The policy challenge is not to reproduce one country’s historical financing arrangements in another, but to design a sustainable combination of fiscal credibility, growth and institutional resilience appropriate to each sovereign’s structure.
Key judgments — Chapter 8. Italy’s most important policy options are improvements in recurring primary fiscal capacity, sustained productivity growth, efficient public investment, transparent management of contingent obligations and refinancing strategies that preserve market access under adverse conditions. The IMF’s recommendations provide an institutional reference for fiscal adjustment and growth reform, while the October 2026 government programme establishes the national policy trajectory currently under consideration. European programmes and fiscal flexibility can support selected objectives, but they do not replace the need for debt-service capacity. The effectiveness of each instrument depends on implementation, timing, economic incidence and the interaction between fiscal consolidation and growth.
WordPress Scheme 7A — Interactive Sovereign Debt Sustainability Laboratory, 2026–2030
This component is intended for placement after Table 7.9. It contains the baseline, adverse and reform scenarios, annual Italian and Greek debt projections, a 3D-style comparison of the 2030 outcomes, a reproducible debt-recursion engine and four adjustable Italian sensitivity parameters. The initial values reproduce the numerical outputs in Chapter 7. Users can switch among English, Italian, Spanish, French and German, with the interface text and explanations updating automatically.
The component is enclosed in its own Shadow DOM, introduces no styles into the surrounding page, and requires no external JavaScript libraries, fonts, API calls or plugins. Calculated outcomes are labelled as illustrative scenarios, never as official forecasts or probabilities.
WordPress Scheme 8A — Strategic Policy Trade-offs and Implementation Matrix
This second isolated component is intended for placement after Table 8.1 in Chapter 8. It turns the policy trade-off assessment into an interactive comparison of fiscal consolidation, growth reform, debt management and European financing, without assigning arbitrary numerical risk scores. Selecting a policy instrument displays its competent authority, principal transmission mechanism, implementation horizon and material limitations. The complete matrix remains accessible in table form.
Final Net Assessment — Sovereign Risk and Euro-Area Strategic Stability, 2026–2030
The Italian–Greek convergence in public-debt ratios is best understood as the outcome of different nominal GDP trajectories, fiscal adjustments, creditor arrangements and financing requirements, rather than as a direct measure of relative sovereign strength. Italy’s large debt stock and reliance on market financing create a different exposure to refinancing costs and financial-market transmission from Greece’s long-duration official debt. Nevertheless, both countries’ future debt sustainability depends ultimately on their ability to maintain credible primary fiscal positions and generate sufficient economic growth relative to their financing costs. Neither the debt ranking nor the existence of institutional support removes that fundamental arithmetic requirement.
The scenario analysis demonstrates three distinct policy environments. Under the baseline, Italy’s debt ratio declines moderately while Greece’s falls more quickly, producing a statistical reversal without an accelerating Italian debt burden. Under adverse conditions, Italy experiences a sustained increase in the ratio, making refinancing costs, debt-management resilience and the economic consequences of fiscal adjustment considerably more important. Under reform assumptions, Italy’s debt ratio declines substantially, but the numerical ranking may remain reversed because Greece also continues reducing its liabilities. The decisive conclusion is that an Italian overtake of Greece would be a meaningful statistical and political signal, but the trajectory of each sovereign’s own debt burden remains the more important indicator of fiscal sustainability.
The European Union faces a related strategic constraint. Defence financing, energy resilience, infrastructure modernisation and economic competitiveness require capital at a time when national fiscal capacity is unevenly distributed and the extraordinary Recovery and Resilience Facility is approaching its final payment deadline. European financing instruments can improve the contractual terms or institutional coordination of selected investments, but they do not eliminate national fiscal obligations or substitute for economic productivity. The credibility of European governance therefore depends on maintaining a distinction between common strategic objectives, legally authorised fiscal flexibility, conditional financial support and the fiscal responsibilities of sovereign governments.
Final confidence assessment: High confidence in the documented institutional frameworks, observed debt developments and underlying debt-sustainability arithmetic. Moderate confidence in the proposition that Italy and Greece will retain substantially different financing sensitivities over the medium term. No numerical probability is assigned to a sustained ranking reversal because the necessary calibrated forecasting distribution has not been established.
What would materially change the final judgment: A persistent change in Italy’s productivity and nominal growth, realised primary-surplus performance materially different from the October 2026 fiscal programme, a substantial revision to the settlement profile of legacy tax credits, persistent changes in effective sovereign borrowing costs, or evidence that Greek primary fiscal performance and nominal economic growth no longer support continuing debt reduction. Changes in European financial instruments or the contractual characteristics of official-sector debt would also affect the comparison, but would require separate evaluation of their legal and economic consequences.


